[Crypto Trading with Moving Average] - Steemit Crypto Academy | S6W2 | Homework Post for professor @shemul21

Question 1
Explain Your Understanding of Moving Average.
Moving Averages
The Moving average indicator is a trend-based indicator derived from calculating the average movement of price within a specified interval. The Moving average indicator is comprised of a single continuous oscillating line on the price chart that indicates the current trend (bullish, bearish, or sideways), trend reversals, support and resistance levels, and trade opportunities based on its calculation and the period used.
The moving average indicator works by plotting the calculated average of price within a specified period, this ensures that the price representation is smoothened. The moving average line is extended after the close of a candlestick, following the newly adjusted average.
In a bullish trend, the moving average indicator identifies the bullish trend by crossing and staying below price movement. Occasionally during pullbacks, price moves close to the moving averages and, rejects the moving average. This implies that the pullback is over and the continuation of the trend movement.
Similarly, in a bearish trend, the moving average indicator identifies the bearish trend by crossing and staying above price movement. During pullbacks, prices tend to test the moving average and reject. This implies that the pullback is over and the continuation of the trend movement.
In cryptocurrency trading, a moving average indicator is used by traders and investors to identify trend movement. Generally, all moving averages interpret trend formation the same way regardless of the period used.

Question 2
What Are The Different Types of Moving Average? Differentiate Between Them.
Types of Moving Averages
There are mainly three types of moving averages, they include the following:
1- Simple Moving Average
The Simple Moving average is a type of moving that is characterized by a line that follows the movement of price closely and is calculated from the average closing of price within a period (candlestick). The Simple moving average considered and represent all price points equally, allowing for a smoothened representation of price. The simple moving average line is extended at the close of a candlestick in proportion to the newly adjusted average.
The simple moving average has a mathematical expression that represents its calculation. The expressions are as follows:
SMA = P1 + P2 + P3 +.... Pn / n
Where:
P = price at a given interval
n = number of periods
Generally, Moving Averages provides a clear view of the market by eliminating false signals made by price. It provides potential opportunities for investors depending on the timeframe and the type of trading system used. Long-term investors like swing traders use simple moving averages with a higher period number, like 50, 100, 200 each representing the number of candles within the timeframe used. While short-term investors like scalpers use 8, 10, 13, 20, etc, also representing the number of candles within the specified period.
2- Exponential Moving Averages
The exponential moving average is very similar to the Simple moving average, the only difference is in how it is calculated. Exponential moving average follows price movement closely and is calculated from the most recent price movement data changes, its fast reaction to price movement and indication of a trend change is why most traders prefer it to the simple moving average. The exponential moving average is a trend indicator used by investors in technical analysis to determine the movement of price and areas of support and resistance.
The exponential moving average has a mathematical expression that represents its calculation. The expressions are as follows:
EMA = Cp × multiplier + EMAprev × (1-multiplier)
Where;
Cp = closing price
EMAprev = Previous day EMA
Multiplier = value is calculated using the arithmetic expression: multiplier = (2 ÷ periods + 1)
As new price data is added to the market, the EMA calculation emphasizes on the recent the most recent data, while the previous data becomes less important. This makes the EMA react fast to price movement more than the SMA, which can give an early good indication of market movement. Investors capitalize on these indications to make good investment decisions.
Similar to SMA, the period setting also depends on the type of trader and the trading system used. Swing traders will use EMA settings with higher periods like 50, 100, 200 EMAs, while Scalper and Intra-day trades will you EMA setting with smaller periods like 8, 18, 21 EMAs.
3- Weighted Moving Averages
The weighted moving average is a type of moving average that lay emphasis on the most recent price points more than previous price data. The weighted moving average is similar to the exponential moving average but they differ based on their calculations. Each candle is multiplied by a weighted factor that allows the WMA indicator to focus on the most recent price points while ensuring that the sum of the weighted averages is summed up to 1 or 100%.
The weighted moving average has a mathematical expression that represents its calculation. The expressions are as follows:
WMA = P1 × n + P2 × (n-1) +.... Pn / [n × (n+1)] / 2
Where;
n = number of periods
P = price points
Similar to other moving averages, the weighted moving average is used by traders and investors to identify a trend, support and resistance areas, and trend reversal. the period setting also depends on the type of trader and the trading system used. Swing traders will use WMA settings with higher periods like 50, 100, 200 WMAs, while Scalper and Intra-day trades will you WMA setting with smaller periods like 8, 18, 21 WMAs.
Difference Between SMA, EMA, and WMA
There are notable differences between the different types of moving averages, they include:
1- Calculation
SMA
The simple moving average is calculated based on the average of the price at a given interval, such that individual price point is properly represented.
EMA
The exponential moving average is calculated based on recent price changes within a specified period, such that recent data is given more emphasis than previous.
WMA
The weighted moving average is calculated based on recent price points, such that a weighted factor is applied to the recent price point to ensure smoothening of moving average data.
2- Trend Identification
SMA
The SMA is ideal for identifying long-term trends because of its average price representation.
EMA
The EMA is ideal for identifying short-term based trading because of its priority to recent price changes.
WMA
The WMA is ideal for short-term trading because of its priority to recent price points.
3- Price Reaction
SMA
SMAs react slowly to price because of that applied average smoothing.
EMA
EMAs react faster than the SMA to price changes because of their priority to recent price change data.
WMA
WMAs react faster to price changes than the SMAs and EMAs because of their priority to recent price points.

Question 3
Identify Entry and Exit Points Using Moving Average. (Demonstrate with Screenshots)
Entry & Exit points using Moving Averages
Identifying entry and exit points using moving averages requires a basic understanding of trends and trend structures, since moving averages work well in trending markets. There are several ways to identify entry and exit points, they include:
1- Moving Average and Price Action
Following a trending structure, moving averages multiple moving averages can be combined to determine entry and exit points. For this Illustration, the 20 EMA and the 100 SMA was used.
In an uptrend, the moving average line should be below price movement, with price forming consistent higher highs and higher lows. During pullbacks, wait for the price to reject the moving average line, indicating the end of the pullback and the continuation of the uptrend. A buying opportunity can be executed once the price rejects the moving average upwards. Consider the chart below:
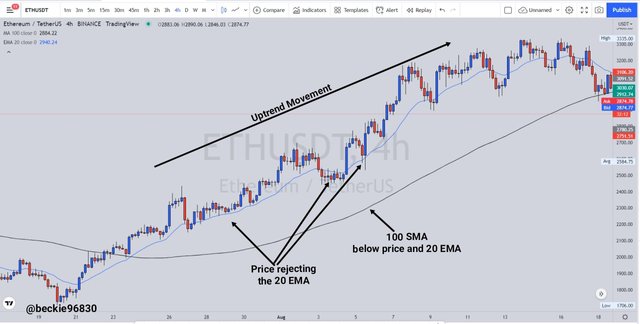
Observing the chart above, the current trend is bullish, which is confirmed by price action and the moving averages with the 20 EMA above the 100 SMA. As seen, the EMA is serving as dynamic support to price movement. After a bull back, the price rejects the 20 EMA and moves upward to form a new high point. A buy trade can be executed when the price rejects and moves away from the EMA.
While In a downtrend, the moving average line should be above price movement, with price forming consistent lower highs and lower lows. During pullbacks, wait for the price to reject the moving average line, indicating the end of the pullback and the continuation of the downtrend. A selling opportunity can be executed once the price rejects the moving average downwards. Consider the chart below:
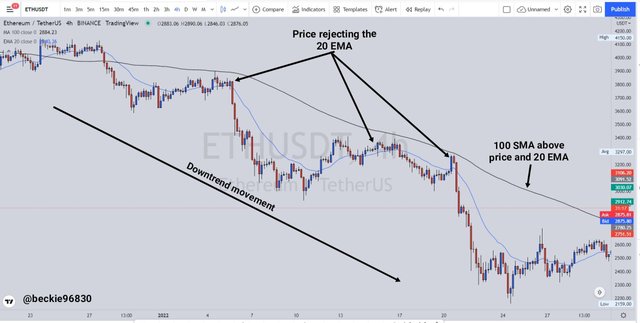
Observing the chart above, the current trend is bearish, which is confirmed by price action and the moving averages with the 20 EMA below the 100 SMA. As seen, the EMA is serving as dynamic resistance to price movement. After a bull back, the price rejects the 20 EMA and moves downward to form a new low point. A sell trade can be executed when the price rejects and moves away from the EMA.
2- Moving Average and Resistance and Support Zones
Moving averages can be combined with horizontal support and resistance levels to identify entry and exit points of a trade. This adds an extra layer of confirmation to the trading sentiment. Ideally, when price approaches a level of resistance or support, a reaction between buyers and sellers is encountered following the principles of demand and supply. Depending on the trend, a continuation or rejection can occur around those levels. To illustrate this, consider the chart below:
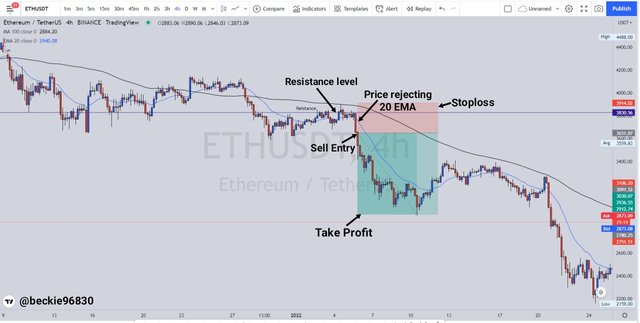
Observing the chart above, the trend was bearish, and the price approached a resistance level, following the reaction between buyers and sellers, a rejection of the resistance was encountered and the price also rejected the 20 EMA. A sell order can be executed after price close below the 20 EMA. The Stoploss should be placed above the recent lower high point and the take profit targeting previous lows.

Question 4
What do you understand by Crossover? Explain in Your Own Words.
Moving Average Crossing
The moving average crossing is a trading strategy that utilizes two moving averages with different period settings, with one having a shorter setting and the other a longer period setting. Ideally, the moving average with a shorter period setting reacts faster to price movement while the moving average with a longer period setting reacts slower to price movement. The combination of the two moving averages is used by traders to identify buying and selling opportunities in a traded market. To illustrate this, I will use the 50 and 200 EMAs.
Ideally, when an EMA with a smaller period (50) setting crosses above the EMA with a higher period (200) setting is considered a bullish signal, hinting at buyers being in control of price movement. A buy trade can be executed after the crossover and price bouncing off the EMA as support. To illustrate this, consider the chart below:
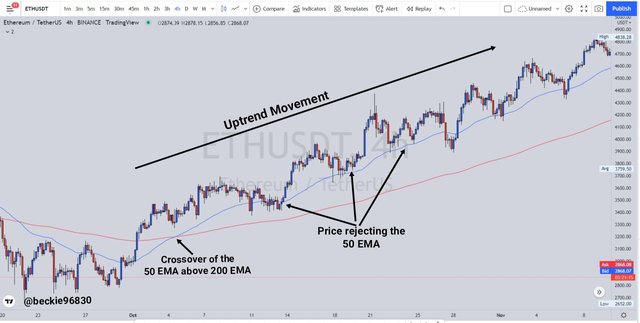
Observing the chart, the 50 EMA crossed above the 200 EMA which indicated the presence of buyers being in control of price. Following the subsequent development of price, the uptrend was maintained with the formation of consistent higher highs and higher lows, with the 50 EMA serving as dynamic support to price movement.
Similarly, when the EMA with a higher period (200) setting crosses above MA with a smaller period (50) setting, it's considered a sell signal, hinting at sellers being in control of price movement. A sell trade can be executed after the crossover and price bouncing off the EMA as resistance. Consider the chart below:
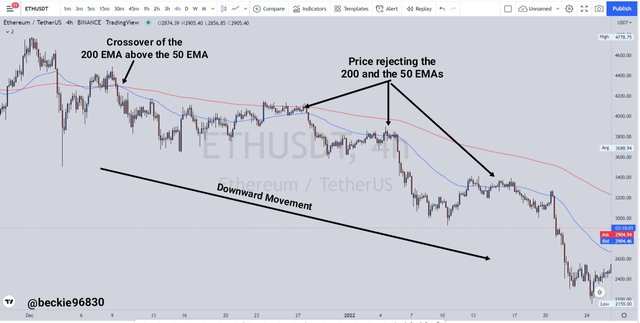
Looking at the chart, the 200 EMA crossed above the 50 EMA which indicated the presence of sellers being in control of price. Following the subsequent development of price, the downtrend was maintained with the formation of consistent lower highs and lower lows, with the 50 and the 200 EMAs serving as dynamic resistance to price movement.

Question 5
Explain The Limitations of Moving Average.
Limitations of Moving Averages
There are notable limitations to moving averages, they include:
1- Lagging Indicator
The moving average indicator is a lagging indicator because it has no impact on the current price formation as its basis and the calculation is based on previous price movement. This makes it less useful in active price predictions as trade signals are revealed late.
2- Trend Limitations
Moving averages are trend-based indicators, this implies that moving average only works well in trending market conditions. In the absence of a trend, the moving average indicator is of limited use.
3- Indicator Rules
The moving average indicator does not have a laid-out rule on how to choose a period setting. This can result in the generation of false trading signals as different indicator settings are required in different trading systems.
4- Data Calculation
Moving average data is recalculated after every candle is closed, this results in the revaluation of the indicator values continuously, which may generate distorted signals in hindsight.

Conclusion
The Moving average indicator is a trend-based indicator derived from calculating the average movement of price within a specified interval. Moving average indicator works by plotting the calculated average of price within a specified period, this ensures that the price representation is smoothened. The moving average line is extended after the close of a candlestick, following the newly adjusted average. While moving average crossing is a trading strategy that utilizes two moving averages with different period settings, with one having a shorter setting and the other a longer period setting.
Thank you professor @shemul21 for this educative and insightful lesson.
Take away a free NTF from Enjin wallet!)