Fibonacci Tools - Crypto Academy / S6W4 - Homework post for pelon53 | by @benjamin09


1.- Explain in your own words what you mean by Fibonacci retracement. Show an example with screenshot.
In the market, there are 3 types of market phases; the uptrend, downtrend and ranging market. During a trend, (whether bull or bear) the market doesn't just move in a straight line. Highs and lows are to be created during a trend, in order to make the market structure for the said trend. It is for this reason why the Fibonacci retracement tool was formed.
The Fibonacci tools(both retracement and extension) use a set of points on the chart as lines are created in order to determine the retracements and extensions of the price. The various points used to create the Fibonacci tools are 23.6%, 38.2%, 50%, 61.8% and 76.8%. Another important thing to note about the Fibonacci tools is that they act like mathematically calculated support and resistance lines.
To determine how long the price will move away from the trend direction in order to create a good entry point when the price continues in its original trend direction. Let us understand Fibonacci retracement now for both trends.

Bullish retracement.
During a bullish trend, there is major upward movement in price. At the point when the price starts moving downwards away from the trend, a high is formed and a retracement is begun. The Fibonacci retracement tool can be used to be able to predict how long the price will fall, in order for a low to be created and the price continues in its original upward movement. The Fibonacci retracement tool is also useful to help determine good entry positions into the bullish market as the price bounces off any of the Fibonacci lines. Let us see a practical example below for a bullish retracement using the Fibonacci retracement tool.
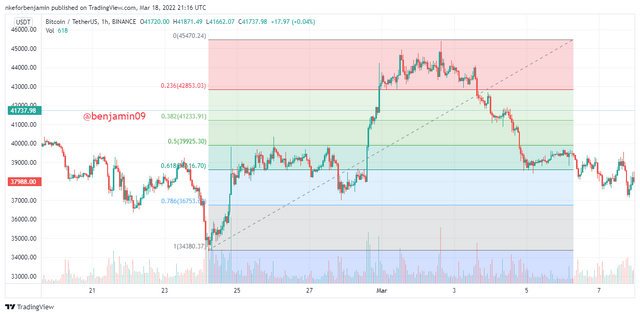
As we can see in the above BTCUSDT chart, the price started rising steadily until the trend slowed down between 0.5 and 0.618. Then there was a retracement for the bullish trend when the price fell towards 0.786 where the price bounced and continued its original bullish trend.
Bearish retracement.
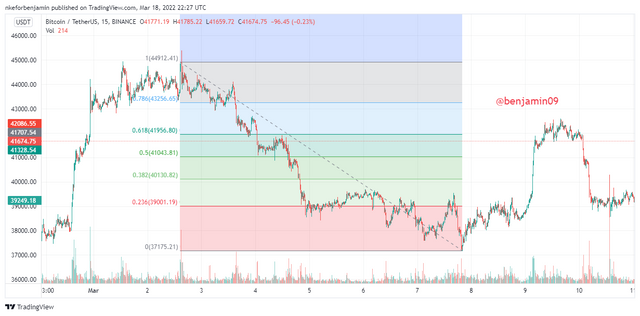
During a bearish trend, the price of an asset doesn't just move downwards continuously. There must be setbacks when the price moves upwards to create a new high. This setback movement is the bearish retracement. During a bearish retracement, the Fibonacci retracement tool will be used to determine how much the price will rise during a bearish retracement. The various points or lines will be used to determine how long the price may rise and these points could be used as entry points into the bearish market. An example of a bearish retracement using the Fibonacci retracement tool is shown below.
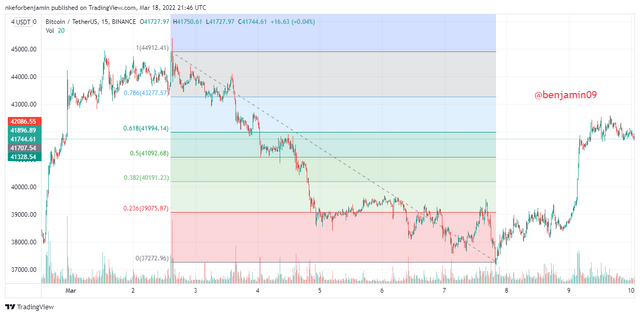
From the above screenshot of the BTCUSDT chart, we can see the chart in a bearish trend and the Fibonacci retracement tool has been drawn with the lowest and highest points of the trend. We can see a retracement when the price hits the 0.5 level and then moves upwards towards the 0.618. At 0.618, the retracement was over and the bearish trend continued.
2.- Explain in your own words what you mean by Fibonacci extension. Show an example with screenshot.
Just like we discussed above, the Fibonacci tools are only useful during trending markets. When the market is in a trend and there is a retracement(as explained above in Fibonacci retracements), the Fibonacci extension tool is now used to determine how long the price may continue in its original trend movement by the use of mathematically calculated lines and points. Let us understand the Fibonacci extension tool with the various trends.
Bearish trend continuation(extension).
During a bearish trend, the price is in a downward movement. Then, there is a retracement as the price moves upwards and creates a new high point for the trend. After the retracement, the price is expected to fall. At this point, we can use the Fibonacci extension tool to be able to determine how long the price will fall again and continue in its bearish trend formation of lower lows. The Fibonacci extension tools are used to create various lines which should be used as the take profits and stop losses during a downward trend. Let us see an example below.
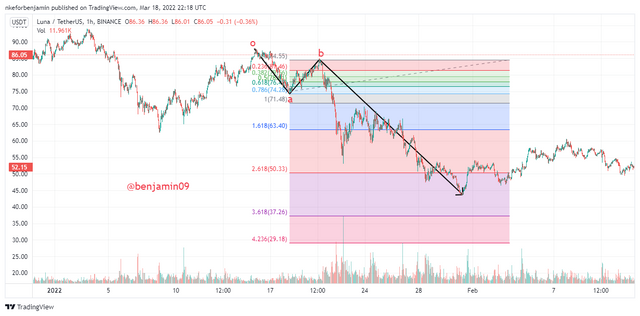
In the above LUNAUSDT chart, we can see the price start a downtrend at point o and then move downwards until the price starts a retracement at point a. The retracement ends at point b and at this point, the Fibonacci extension is drawn. And just as predicted by the Fibonacci extension tool, the price did fall until the level of 2.618 where the downtrend ended.
Bullish trend extension(continuation).
During a bullish trend, the price is having a major upward movement. But since price doesn't move in a single direction during a trend, the price will have to fall creating a retracement. At the end of the retracement, a new low is created for the bullish trend. At this point, we use the Fibonacci extension tool to be able to determine how long the price will rise again in its uptrend formation of higher highs. The various lines and points created by the Fibonacci extension tool can be used as exit positions for the bullish trade. An example is shown below.
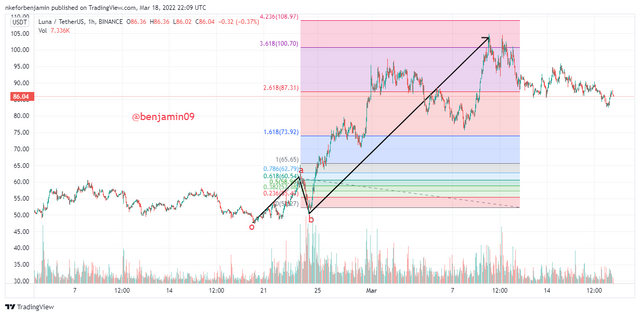
In the above chart of LUNAUSDT, we can see the price move in a small uptrend where a high was created(o), then there was a retracement(a). At this point of b, the Fibonacci extension shows the possible price rise and as is seen above. The price did rise significantly to a point of 3.618 level as was predicted by the Fibonacci extension tool.
3.- Perform the calculation of the Fibonacci retracement, for the levels of: 0.618 and 0.236. Pick a crypto pair of your choice. Show a screenshot and explain the calculation you made.
Before we do the calculations, let us first of all identify the formula to be used for the calculation.
R1 = X + [(1 - % Retrace1/100) * (Y – X)]
Where:
- Y is the maximum value of the price during the trend, where the Fibonacci retracement ends.
- X is the first value of the price during the trend, where the Fibonacci retracement begins.
- R1-5 are the various retracement levels to be calculated.
- %Retrace1 is 23.6%
- %Retrace2 is 38.2%
- %Retrace3 is 50.0%
- %Retrace4 is 61.8%
- %Retrace5 is 78.6%
0.618 Fibonacci Retracement calculation with the BTCUSDT chart.
From the above chart, we can identify the following for the calculation.
X=$44912
Y=$37175
R4 = 44912 + (1-0.618) * (37175-44912)
R4 = 44912 + (0.382*-7737)
R4 = 44912 - 2955.5
R4 = 41,956.5
As is seen in the chart, my calculation is correct and accurate.
0.236 Fibonacci Retracement calculation with the ETHUSDT chart.
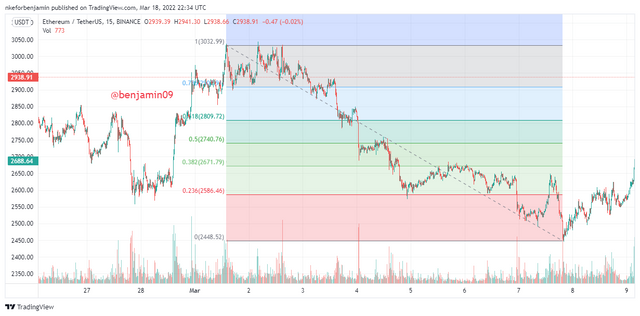
From the above chart;
X = $3022
Y = $2448
R1 = 3022 + (1-0.236) * (2448-3022)
R1 = 3022 + (0.764*-574)
R1 = 3022 - 438.5
R1 = 2583.5
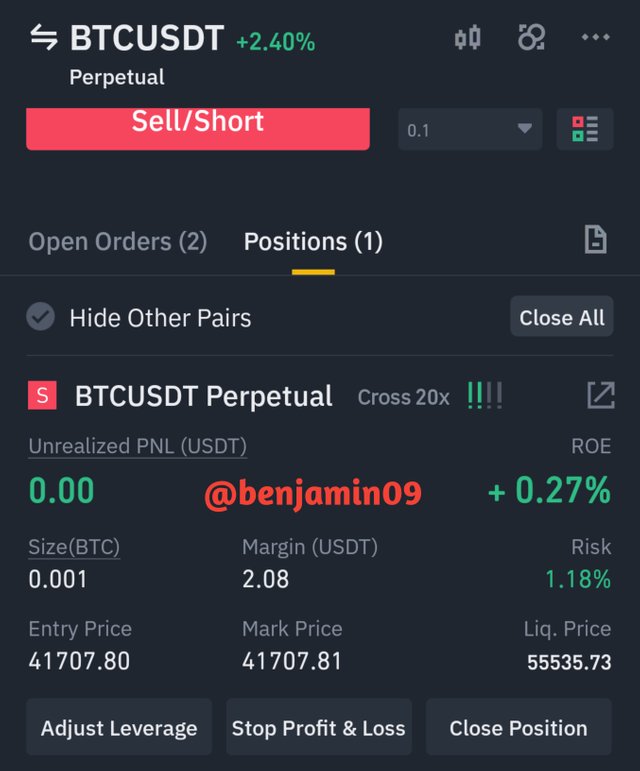
4.- On a Live account, trade using the Fibonacci retracement, screenshots are required.
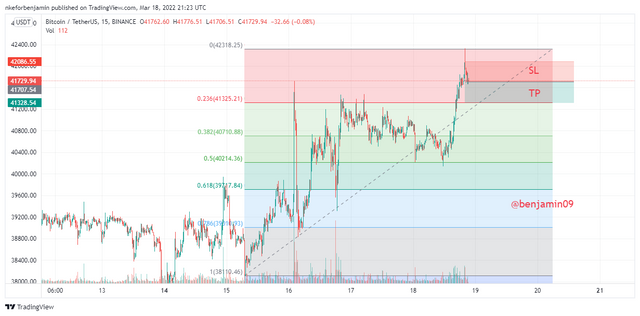
As we can see in the above screenshot, we can see the price of BTCUSDT in a bullish market. So, I drew my Fibonacci Retracement with the highest and lowest points of the trend as was explained in class by professor @pelon53. Then, we can see the price entering a retracement phase and moving down towards the 0.236 level of the Fibonacci Retracement diagram. So, I placed my sell trade for the retracement phase with the entry position at the current market price and the exit positions such that, the take profit is at the 0.236 level and the stop loss is such that the risk:reward ratio is 1:1. We can see the real trade screenshots as was taken from the Binance mobile app using the Futures account.
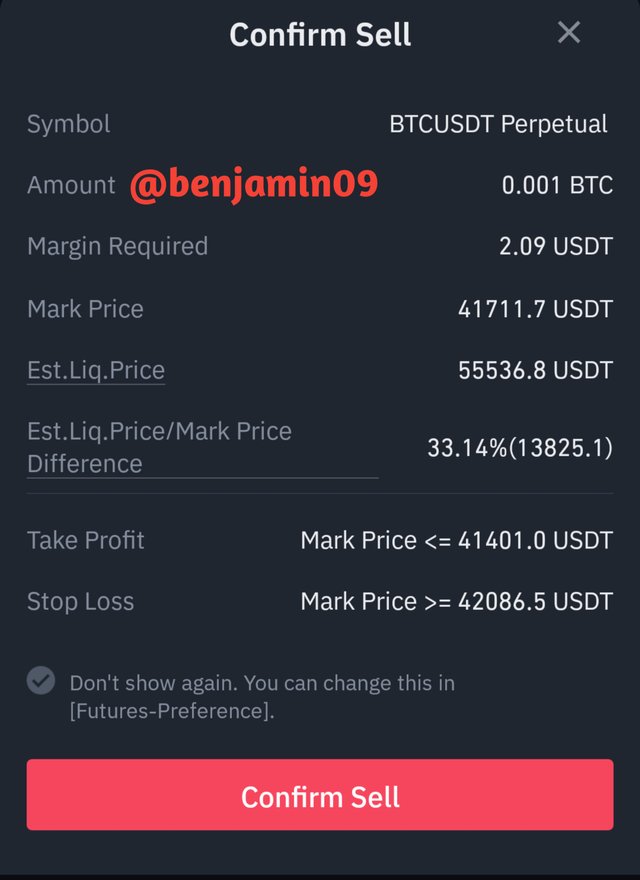
Binance mobile app
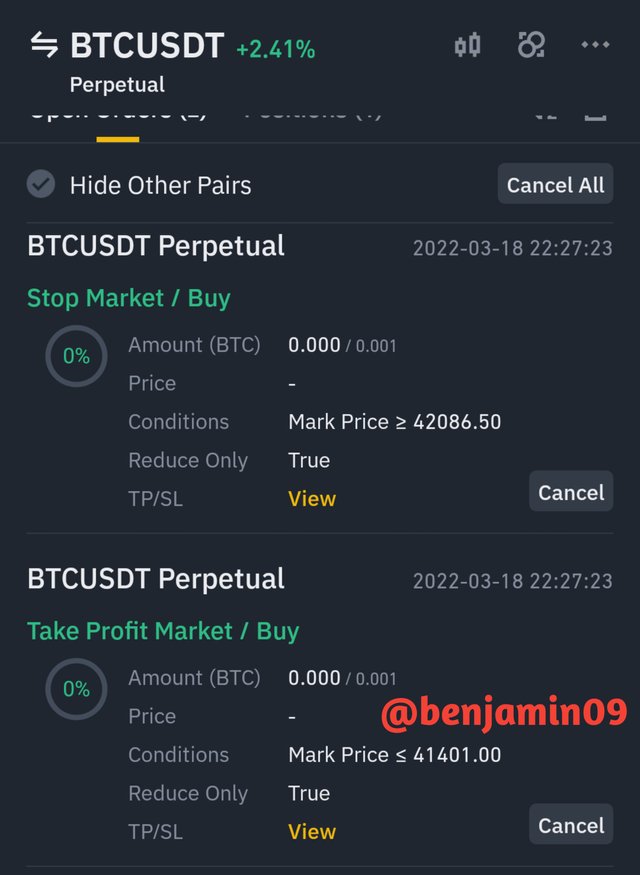
Binance mobile app
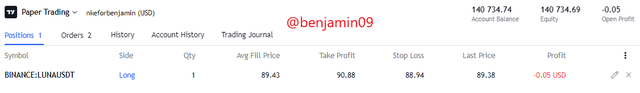
5.- On a Demo account, make a trade operation using the Fibonacci extension. Screenshots are required.
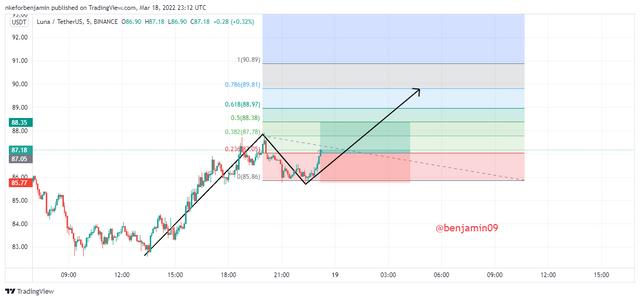
As we can see in the above LUNAUSDT chart, a trend formation started and then later on, a retracement occurred. I used these various points to plot my Fibonacci extension diagram. From this diagram, I have derived my entry and exit positions My entry position into the bullish market is at the 0.236 level at the Fibonacci diagram. My take profit is at the 0.5 level and the stop loss is at the retracement point such that the risk:reward ratio is 1:1. The demo trade screenshots can be seen below as I placed my bullish trade using the Paper trading account in the Tradingview website.
Conclusion.
The Fibonacci tool is a really effective and convenient set of mathematical tools that help a trader in identifying and profiting from the trend movements (whether retracement or extension). This was a very good lesson that broadens the trend trader's horizons.
Thank you for reading.
@pelon53