[Crypto Trading with Moving Average] - Steemit Crypto Academy | S6W2 | Homework Post for professor @shemul21
Introduction

In this section, we would be looking at the Moving Average indicator is one of the technical indicators tools used by traders in predicting and confirming the price movement and signals of an asset. The Moving Average indicator is one of the trend-based technical indicator tools used in predicting and identifying the price movement of an asset on crypto charts.
This indicator also helps traders to identify possible trend reversals in the price of an asset. It again aids traders to identify the current price movement or trend of an asset on charts. The Moving Average indicator also serves as dynamic support and resistance which tends to help in detecting price reversals of assets.
A mathematical price equation of data points is used in calculating moving averages. Through the use of moving average indicators, traders can easily spot out and filter fluctuations in the price of an asset in the market. When using a 100 moving average indicator implies that the average data price points of the assets over the past 100 days will be taken into account. An illustration is shown below from the chart below.
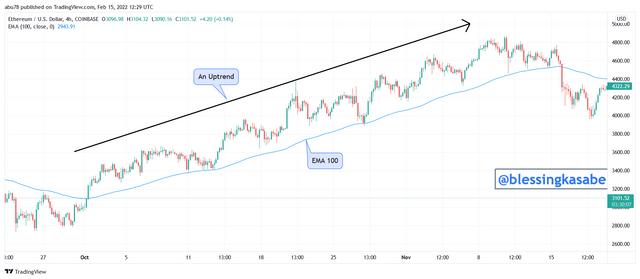
From the chart shown above, we can clearly see that the price of ETHUSD was moving or trending above the EMA 100 indicator which indicates an uptrend in the price movement of ETH as shown in the chart above.
In this section, we would be looking at the types of moving average indicators we have. There are three types of them and we will look at how they function. We also look at their differences as well.
The Simple Moving Average (SMA)
The Simple Moving Average indicator is a simple moving average indicator that uses or considers the average prices of an asset over a specific time. The simple moving average indicator helps traders to identify the average price of an asset within a certain period and it is dynamically plotted as the price of the asset fluctuates. The SMA also has a specific equation used in its calculation and the formula is given below.
SMA = (A1 + A2 +...+An) / n
Where n = the number of periods taken into consideration (e.g 100 day periods) and
A = the average price data points of the asset over a certain period.
We then look at the next moving average which is the Exponential Moving Average (EMA).
The Exponential Moving Average (EMA)
The Exponential Moving Average is also a type of moving average that is similar in function to that of the simple moving averages. The exponential moving average was developed or created to enhance improvement in the Simple Moving Average indicator which was having some lags in it. The EMA helps traders to easily identify recent price movements of assets faster. It is more advanced as compared to the SMA. The EMA is a good moving average for short-term traders and when it is combined with the SMA it can produce information for both long-term and short-term traders. The Exponential Moving Average also has its own specific formula used in its calculation. The formula is shown below.
EMAc = [ Cp × (s/1+n)] + EMAp × [1 - (s/1 + n)]
Where,
EMAc = the Current EMA,
Cp = the Current price of the asset,
EMAp = the previous day EMA,
s = the Smoothing factor,
n = the Period (number of days).
Now let's look at the last type of the moving average indicator, which is the Weighted Moving Average.
The Weighted Moving Average (WMA)
The Weighted Moving Average is the type of moving average that considers or takes into account the current price of the asset without giving much importance to the price of the previous day. Looking at the EMA and SMA which take into account the previous data points of the asset, the weighted moving average, on the other hand, does not consider the previous data points of the asset but rather considers the current or recent data point of the asset. The WMA is possibly to do this because the indicator moves a bit faster than the current price trend of the asset in the market. The WMA also has its own formula in calculation and the formula is stated below.
WMA = (Price1 × n + Price2 × (n-1) +...Pricen)/ [ n × (n+1)/2]
n = the Period(number of days)
Now let's look at the difference between these three types of Moving Averages from the table shown below.
Differences between the SMA, EMA, and WMA indicators.
In this section, we would be looking at some of the differences between the three different moving averages mentioned above in this article.
| SMA | EMA | WMA |
|---|---|---|
| The SMA is a good tool for long-term traders because it considers the average price of an asset to enable them to detect long-term patterns. | The EMA on other hand is good or suitable for use by short-term traders because it helps in detecting trend reversals as well as moves a little bit faster ahead of the price trend of the asset | The WMA is also suitable for scalp traders because it aims at the current price of the asset in detecting signals. |
| The SMA considers the average price of an asset over a specific period in its calculation | The EMA considers the current price of the asset and also a multiplier for smoothing | The WMA considers the current or recent price data of the asset with little attention to the previous data point of the asset. |
| The SMA lags behind the current price of the asset | The EMA reacts faster to the change in the price of the asset | The WMA on the other hand reacts faster to a small change in the price of the asset. |
| When higher values are used with the SMA, it produces more accurate signals because it calculates for longer days price data points in order to filter signals | On the other hand, the EMA produces more accurate signals when lower values are used because it is more concentrated to the recent price of the asset in predicting for signals | The EMA on the hand can produce more accurate signals for both higher and lower values because it takes into account the most recent price points of the asset in its calculation. |
I would show all these three indicators on a single chart so that we see their differences clearly on the crypto chart.
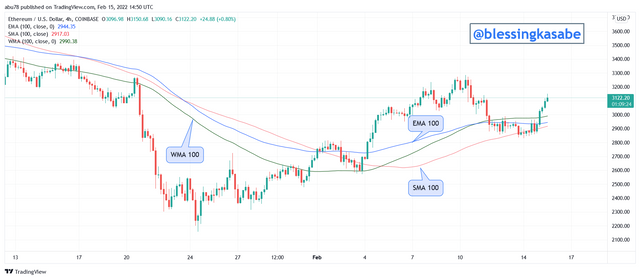
From the chart shown above, we can clearly see the differences between the three moving averages. We can see that the SMA lags behind the price of ETHUSD from the chart shown above and it's far away from the price of ETH. We again see that the EMA is somehow closer to the price of ETH because of the smoothing in the calculation of the recent price of ETH. Finally, we can also see that the WMA is closer to the price of ETH because it reacts faster to any small change in the price movement of the asset.
In this section, I would be explaining how to identify entry and exit points using the moving average strategies. In this lesson, I would be combing two moving averages that are SMA 100 and EMA 20 in identifying the entry and exit positions on crypto charts.
Buy Opportunity using Moving Averages (100 SMA and 20 EMA).
In order to determine or identify a buying opportunity, the price of the asset must be in a bullish trend whereby the price of the asset should be trending above the moving averages and forming consistent higher highs and higher lows on the chart. You then wait for the price of the asset to reject the moving average line during pullbacks which indicates a trend reversal in the upward direction and a stop to the pullback. Once the price of the asset rejects the moving average line, then a buy order can be executed immediately. An illustration is shown in the chart below.
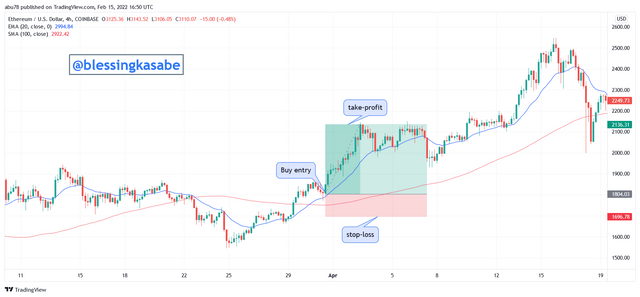
From the ETHUSD 4H chart shown above, we can clearly see that after a trend reversal in the asset from bearish to a bullish trend, the price of ETH pulled back and find support on the EMA 20 as shown above after which a buy order entry was executed. Stop-loss was placed below the SMA 100 indicator and take-profit was placed closer to the nearest higher high. The risk to reward ratio for the trade was 3.1
Sell Opportunity using Moving Averages (100 SMA and 20 EMA).
In order to determine or identify a selling opportunity, the price of the asset must be in a bearish trend whereby the price of the asset should be trending below the moving averages and forming consistent lower highs and lower lows on the chart. You then wait for the price of the asset to reject the moving average line during pullbacks which indicates a trend reversal in the downward direction and a stop to the pullback. Once the price of the asset rejects the moving average line downwards, then a sell order can be executed immediately. An illustration is shown in the chart below.
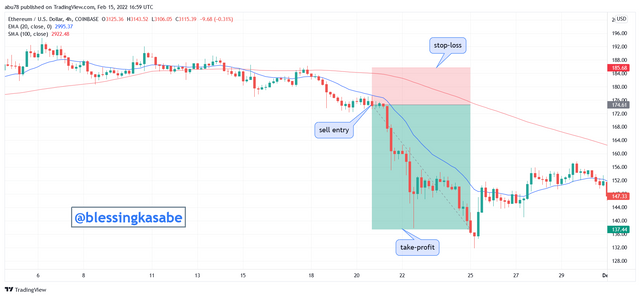
From the ETHUSD 4H chart shown above, we can clearly see that after a trend reserved in the asset from bullish to bearish trend, the price of ETH pulled back and find resistance on the EMA 20 as shown above after which a sell order entry was executed. Stop-loss was placed above the SMA 100 indicator and take-profit was placed closer to the nearest lower high. The risk to reward ratio for the trade was 3.36
In this section, I would be explaining crossover using moving averages. Crossover or moving average crossing refers to the method of combining two moving averages to easily detect trend reversal signals before their formation. These two moving averages should be a slow reading moving average and a fast-moving average whereby the slow-moving average indicator would react to the price of the asset at the exact price data points whilst the fast-moving average would react faster to the price of the asset taking into account few price data points of the asset.
In using the two moving averages, when the fast-moving average indicator crosses above the slow-moving average indicator then it is an indication of a bullish trend reversal in the price of the asset, and a buy order can be looked for.
Similarly, when the fast-moving average indicator crosses below the slow-moving average indicator then it is an indication of a bearish trend reversal in the price of the asset, and a sell order can be looked for.
I would practically demonstrate this using the crypto charts below in this article. I would combine a slow-moving average (SMA 100) and a fast-moving average (EMA 20) to illustrate the crossing over.
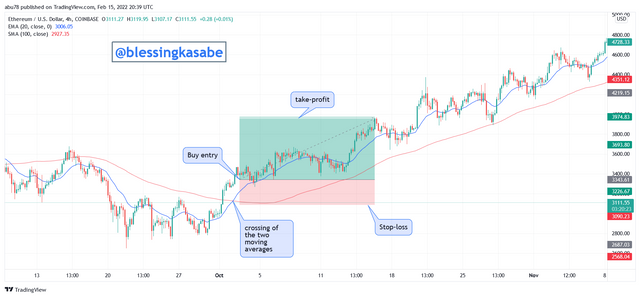
From the ETHUSD 4H Chart shown above, we can clearly see that the fast-moving average line crosses above the slow-moving average line which indicates a bullish trend reversal in the price of ETH. After the crossing, we can see that the price of ETH continued moving upwards and a good buy entry position can be taken after the breakout of the candle by setting stop-loss below the slow-moving average indicator.
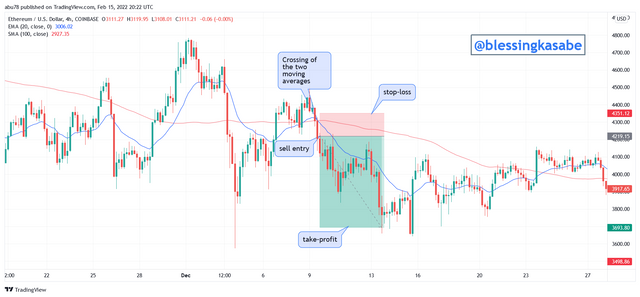
From the ETHUSD 4H Chart shown above, we can clearly see that the fast-moving average line crosses below the slow moving average line which indicates a bearish trend reversal in the price of ETH. After the crossing, we can see that the price of ETH continued moving downwards and a good sell entry position can be taken after the breakout of the candle by setting stop-loss above the slow-moving average indicator.
In this section, I would be enumerating some of the limitations of using moving averages and they include the following,
Moving averages only perform or function correctly in trending markets because they are trend-based indicators. It becomes limited in use when there is no trend in the market.
Again, the moving averages have a lot of lags in their use due to the historical price data points of assets they take into consideration during their calculations. Due to the laggings they contain, they can deceive traders to enter into a trade when not necessary.
Furthermore, the moving averages can lead to the identification of false signals because they are very sensitive to the periods used during analysis. This indicates when a period is selected by a trader in a wrong timeframe, it can result in false signals in the market.
- Lastly, the moving averages indicator solely depends on the historical price data point of an asset and doesn't take into consideration other factors and price information which can also affect the price of the asset in the market.
Conclusion
To conclude, I would like to briefly summarize what has been done so far in this homework task. First of all, we looked at the concept of moving averages and their benefits or importance as well. Furthermore, we then looked at the different types of moving averages that we have and we mentioned that there are three of them i.e. EMA, SMA, and WMA. We also looked at the differences between these three moving averages.
In addition, we looked at how to use moving averages to identify entry and exit points on crypto charts by practically performing some illustrations.
Moreover, we looked at the concept of crossover in moving averages and we used two moving averages to explain that including examples on crypto charts.
Finally, we looked at some of the limitations or disadvantages of moving averages.
I would like to say a very big thank you to professor @shemul21 for this wonderful lecture. I have really understood the concept of "Crypto Trading with Moving Averages".
Thank You.
Thank you for sharing your knowledge @blessingkasabe