Crypto Academy Season 4 | Intermediate course by @allbert –week 1: Trading with Strong, Weak and Gap Levels.
Image from source

Trading has been essentially very important for so many people, trading is one part anyone can just enter the market and click on buy/sell he might be lucky or unlucky but Understanding the market takes gambling away from your trade. For you to understand the market properly, you have to practice and understand the full price action of the market.
In Understanding the Price action of the market, there are some essentials that you can’t do without if you want to be an effective trader. Today, we will be looking at one of them. The essential that I believe should be the fundamental for anyone in the market should be to understand what levels are. Levels are areas or region of high liquidity in the crypto space. There are lots of potential profit in the levels and the is where the traders usually places their orders, it can either a buy order or a sell order. It basically comprises of the support and the resistance level.
Support levels normally occurs at the bottom of the market, it serves as a wedge that prevents the market from going downward, so traders usually buy or place a pending order at these supports levels most of the times. While the Resistance levels are usually on the up side of the market that normally resistance the price from moving further upward unless there is a breakout and most traders uses the resistance level to place a sell order or a pending sell order. From studies and some many analysis, it has been found out that some levels are stronger than others, so quickly, we will discuss about strong levels and weak levels in the market.
Strong Levels Vs Weak Levels
Strong Levels can either be support or resistance that has a lot of pending orders that already has been placed by trader anticipating that the price will go in their direction which they have placed the trade. In Strong Level, there is usually a very high liquidity level which shows the high flock of pending orders that has already been placed. So what makes a level strong, lets quickly look at the factors or criteria that make a level to be strong.
- The first and the most popular criteria that are used to determine how strong a level is is the number of bounces that have occurred previously on that level. The Bounces that to be above 3 that has occurred. Both at the support level and on the resistance levels.
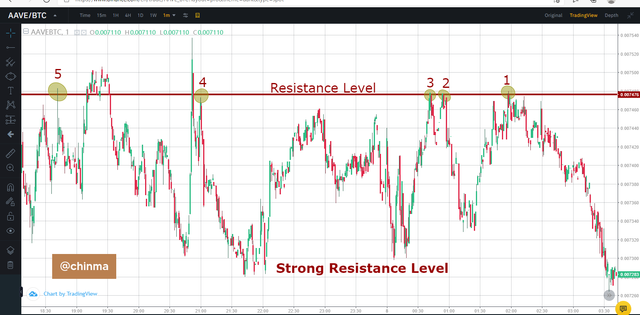
This is a chart of AAVE/BTC on a 1min time frame, showing a very strong resistance by the number of times the price has bounced on the resistance. From the chart, you can see that the number of bounce were above 3, so this indicates that the resistance level is strong.
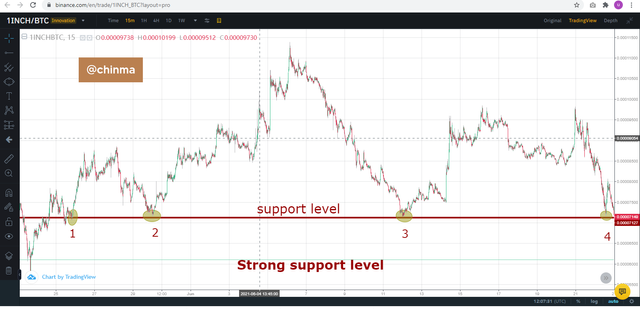
This is a chart of 1INCH/BTC in a 15mins time frame, from the chart we can see that the price bounced on the support more than 4 times, this is a very clear indication that the support level is very strong and you can trade in this level.
On the other, there is Weak levels, Normally weak levels have very low liquidity which also shows the presence of little pending at the region, weak levels can also result in breakout. SO with the number of bounces, how can you know that a level is weak be it at the support or the resistance level. Highest number of bounce the weak level should is 3 bounce, if it exceeds 3 then it is gradually becoming a strong level..
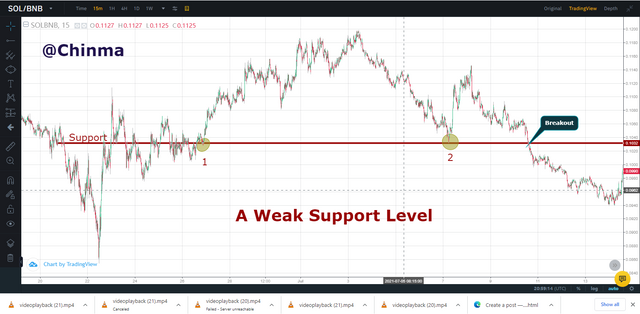
From the above of SOL/BNB on a 15mins time frame, we spotted very weak support, the support was weak because of the number of times there was bounce or the price touched the support line. That is why a breakout happened easily after two times the price touched the support. The Support level could not hold it very well, so it let the price broke through it.
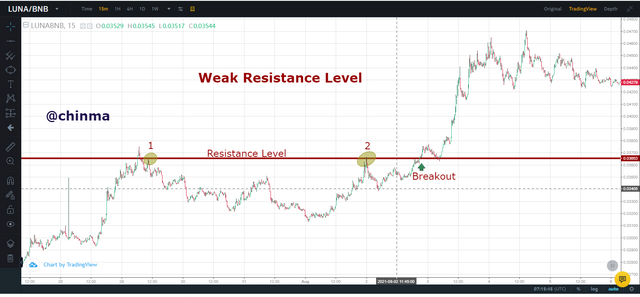
From the chart above of LUNA/BNB on 15mins time frame, from the chart, you can see that the price bounced back only twice and this made the resistance level to be weak. And you can see that there was a breakout not too long after the second bounce.
- Another way to check if a level is strong, is look the height of the price after bouncing on the any of the levels. If the distance from the level to where the price’s peak is high, then it is an indication of a strong level but if the distance from the level to peak of the price is low then you should be getting ready for a weak level.
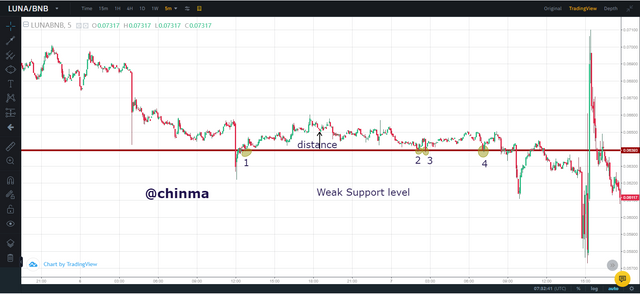
From the chart of LUNA/BNB in 5mins , we can see that the distance of the price for the support is not far, making it weak support because sellers are really pushing the buyers downwards, with time the pressure will be high and it can easily lead to breakout.
- Another way to know the strong or weak level is simply by going to the larger time frame, and check the trend, if the trend in the larger time frame is going the same direction in the smaller time frame, then that can be said to be a strong level but if the trend in a smaller time frame is not in line with the trend of the larger time frame, this can be weak level. Because the Larger time frame has more effect than that of the smaller time frame.
Gaps are common in the crypto market, and they are usually between day to day. A Gap is simply were no trade took place between one moment to the next. And these happen frequently on the Intra day chart between one day to the next. You can say that a gap happens if the new day’s price candlestick is a distance away from the close of the previous day candlestick in the distance recreated there is no record of any price created.
- One the factor that is responsible for Gaps is News. When the market closes, A news which could be positive or negative could be releases and this could make the price to either jump upwards or go downward. An example of this news in the Covid-19 virus news.
- Another factor that can cause gaps in the crypto market is when there is a very large volume of either buyer/sellers at the same in the market, these can lead to the jumping of the price . Gaps can also be caused when the information of huge investors is being released or changed at the end of the day’s trade.
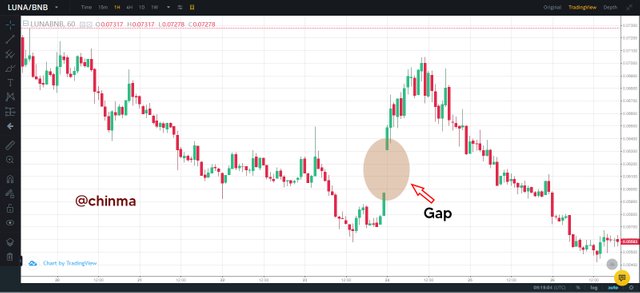
From the chart above of LUNA/BNB in a 1-hour time frame, we can see the space between two candlesticks, that no trade took place at that area, which is called a Gap. Maybe one of the above-listed factors might have caused it.
We have just seen the definition of gaps, so let us look at the various types of Gaps that we have in the market. The types of Gaps that we have includes
- Breakaway Gaps
- Runaway Gaps
- Exhaustion Gaps.
Breakaway Gaps:
This type of Gaps is being produced the price of a market breaks Chart pattern which can be a trend, a wedge, a triangle, a shoulder etc., it normally produces new chart pattern movement, the new pattern can be a trend, a wedge etc. It most times shows that the level which a support or resistance level is strong, this can be caused by the high number of buyers/sellers to dominate the market at a particular of the day.
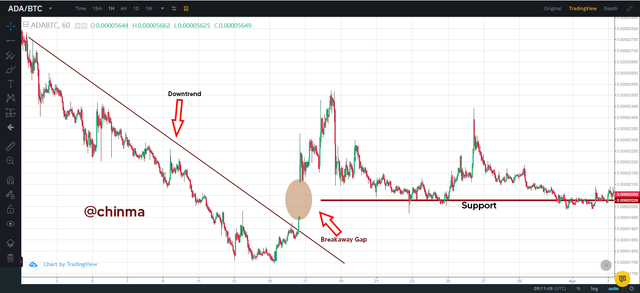
From the chart of ADA/BTC in a 1hour time frame, a gap was produced, after the market trended down, the gap helped to end the downtrend and changed the trend, though we can see that after the gap, the market was ranging. The gap also led to the creation of strong support.
Runaway Gaps:
This type of Gap is when the price candle stick skips a price point due to the high interest of investors or when the asset of the investor is being exchanged. It most shows that a trend will continue and happens at the beginning of the trend. Sometimes, runway gaps can serve as a strong resistance or support depending on where it is been located.
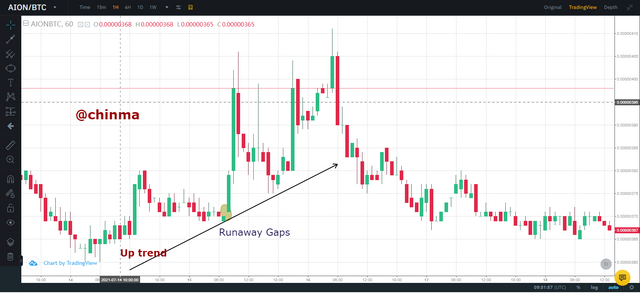
From the chart above of AION/BTC in a 1-hour time frame, you can the formation of a gap that is formed at the beginning of the trend, after the gap, the trend continues moving upwards. if you look further, you will notice that the gap provided a great support level.
Exhaustion Gaps.
This gap usually signals the end of a trend that is upward, after a fast-rising price, the gap is usually seen at the space lower in price. If you want to trade with this gap, it is advisable to trade it in its opposite direction because most times the price comes to fill the space.
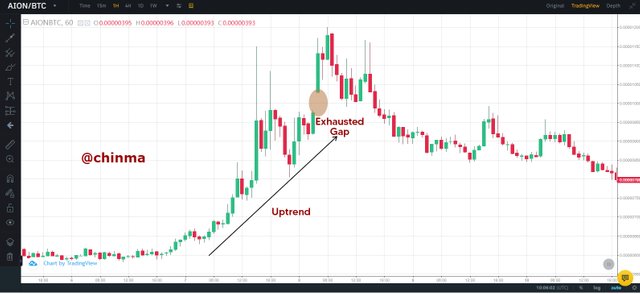
From the chart above, AION/BTC, in a 1hour time frame, we can see a clear indication of an exhausted gap.
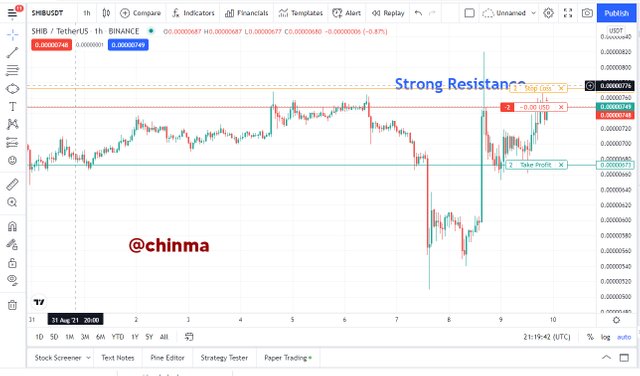
The first trade I took, has a very strong resistance with more than 3 tests, the BRB was put into test. The BRB (Break Retest Break) showed that the price has broken the resistance and retested it, then from analysis, the price will move downwards, so I sold. My Risk to Reward ratio was 1:2. My take profit was set just in the closet support on the chart. The Chart was from SHBUSDT in a 1-hour time frame,
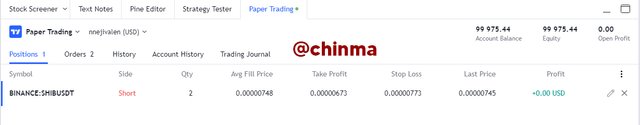
The result was just starting so I screenshot it, the result will manifest more with time.
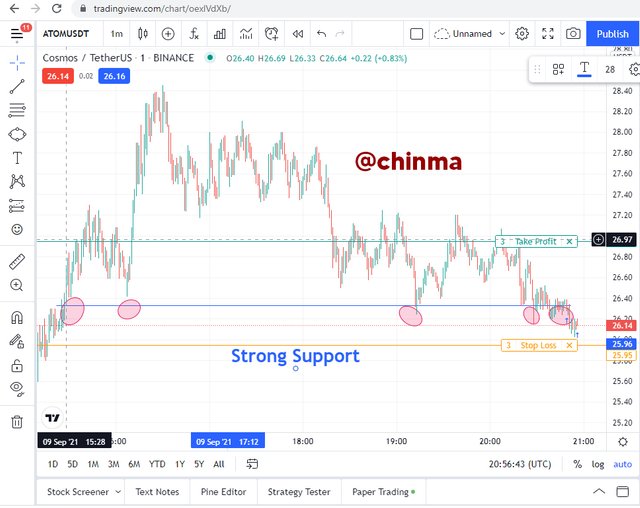
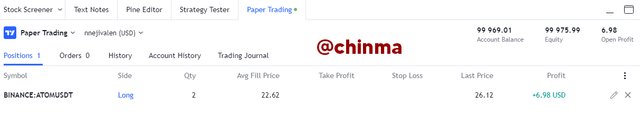
From the chart below, I bought, due to the number of test that has occurred on the support level which makes it a very strong support, there has being some series of Break and retest which makes it more valid to execute the buy order. So I my demo account, I executed the buy order, using a Risk to reward ratio of 1: 2 also. I was already getting my reward using this strategy. The chart was from ATOMUSDT in 1min time frame. My profit was set using the next resistance that is above while the stop loss was set using the lowest support in the chart at the moment. The BRB strategy was also put into Consideration, the support was broken at some point and later retested.
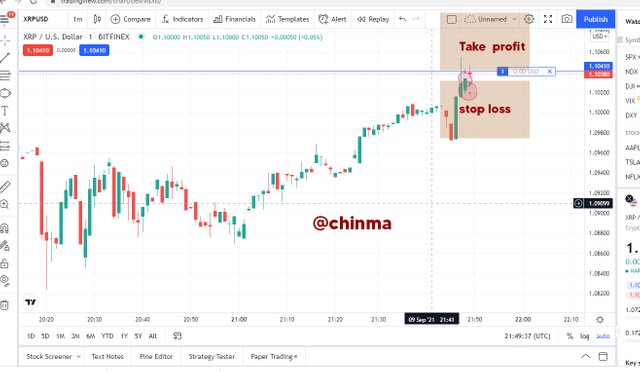
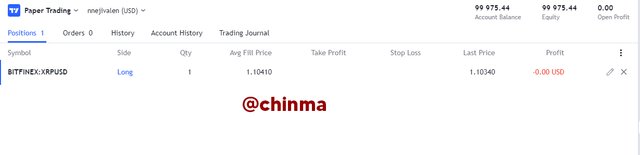
From the chart of XRPUSD in the 1 min time frame, I observed a gap in which I entered the trade. I bought with a lot size of 0.01 and I used risk to reward ratio of 1:2.
In conclusion, This Assignment looks simple from a distance, but when I sat down to do it, I observed a lot of things. Now I know that the simple things that we ignore have a lot of value. Before this assignment, I barely about Gaps, but from the particular assignment, I have learned how to trade using gaps and how they serve as a resistance or support level.
I also took my time to study the different types of gaps. Now I can say that I have really learned. Even what happens at the strong levels and the weak levels were all mysterious to me, but from the completion of this assignment, I have also known. From the assignment I have learned that we should not take simple things simple, there is a lot to learn. Thank you, Professor, for these assignments.
Cc @allbert