Trading with Accumulation / Distribution (A/D) Indicator. @allbert
Good day, steemit, another wonderful opportunity for us all

"1.Explain in your own words what the A/D Indicator is and how and why it relates to volume. (Screenshots needed)."
If you have been asking what a volume-based indicator is? Accumulation and distribution are some of the volume-based indicators, and today we are going to do some justice to it and making it simpler. The A/D was discovered by mark Chaiken. Mark Chaiken made the indicator to use volume as part of its calculation which helps you to determine the price trends in the market. So, what are Accumulation and Distribution?. They are used to describe the up and down movements in price.
Accumulation can be defined as when traders are buying in the market or it simply means having many assets and holding them at a particular spot, this makes the price go up. And we should note that while buyers are buying, they usually buy the cryptos at a rate that will not drive the price to go much higher, because if they buy too rapidly, they start will start buying at higher prices.
While Distribution can be defined after the buyers have bought, they begin to unload their positions by selling their crypto and they usually do so at a rate that is not going to cause the price with speed. So in general, the Accumulation Distribution indicator is a kind of indicator that uses the data from the volume and price to know if the crypto is being accumulated or distributed.
When you use volume you will easily see the range of interest that traders regarding buying and selling when being compared to the price. As we know that volume precedes price movement, the number of cryptos that is bought and sold can be compared to the rise and fall of the Accumulation/Distribution indicator Line
The A/D indicators relate to volume by being affected by the number of buyers or the sellers at the time. Volume is simply the number of buyers or sellers. The number of the higher the number of Buyers you should know that accumulation is taking place but the higher the number of sellers you should know that distribution is taking place. So In general, the volume determines the direction of the A/D indicator. As I said in the beginning that the A/D is a volume-based indicator.
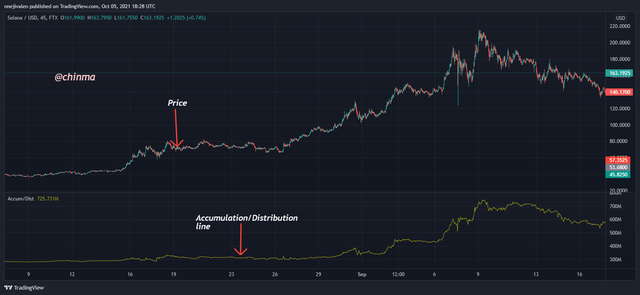
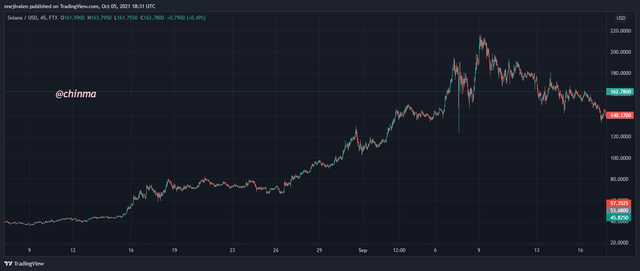
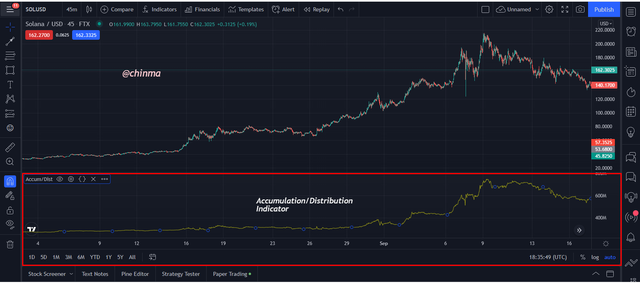
This is an example of a chart with the A/D indicator below.
"2-Through some platforms, show the process of how to place the A/D Indicator (Screenshots needed)."
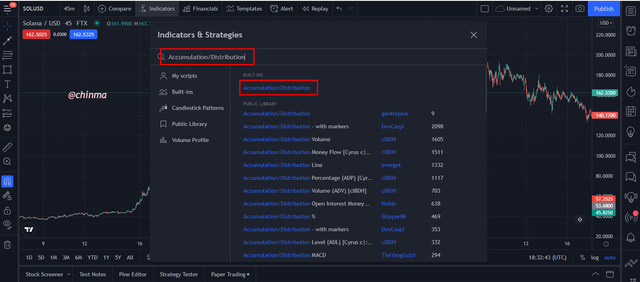
In this illustration will be using SOLUSD chart in 45mins time frame, the steps to open an accumulation/distribution indicator can be sen below
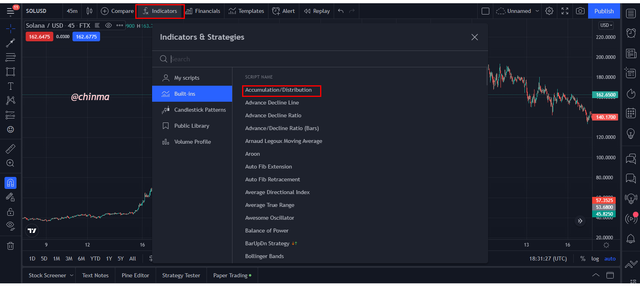
- Open your tradingview, you can use the site
- Select indicator and you will see the accumulation/distribution indicator first, you can select the indicator immediately
- In case, you did not see the indicator in the drop list, you can simply type the indicator in the search bar and later select the accumulation/distribution indicator
- The indicator has been opened for you, it has its window below,
- In case you want to edit the Indicator, you can click the gear icon and do the necessary adjustment but you can see that it does not have period or level settings.
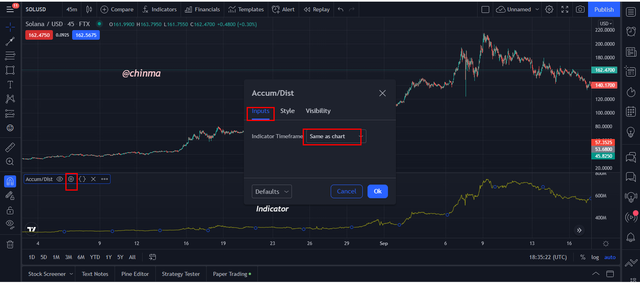
Picture from tradingview
"3-Explain through an example the formula of the A/D Indicator. (Originality will be taken into account)."
The formula for accumulation/distribution indicator requires a few steps
Money Flow Multiplier
MFM = [(Close - Low) - (High - Close)] / (High - Low)
Where
Close = Closing price
Low = Low price for the period
High = High price for the period
MFM = Money Flow Multiplier.If the Money Flow multiplier is positive, it simply means buying pressure is higher than selling price within that period. This calculation also gives us the direction of the money flow.
Money flow volume = MFM X Volume for the period
Finally, Accumulation/Distribution line = Prevoius A/D + Current period’s money flow volume.
Example, if the
Close price = 155USDT
Low Price = 100USDT
High Price = 200USDT
CMFV= 400
Previous Period AD = 500MFM = (155-100) - (200 - 155) /(200-100)
= 0.1Money FLow Volume = MFM X Period Volume
= 0.1 X 500
= 50A/D = Previous A/D + CMFV
=400 + 50
=450If the A/D is positive it simply shows that it is Accumulating.
"4-How is it possible to detect and confirm a trend through the A/D indicator? (Screenshots needed)"
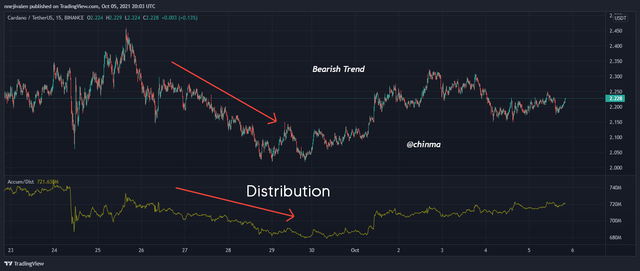
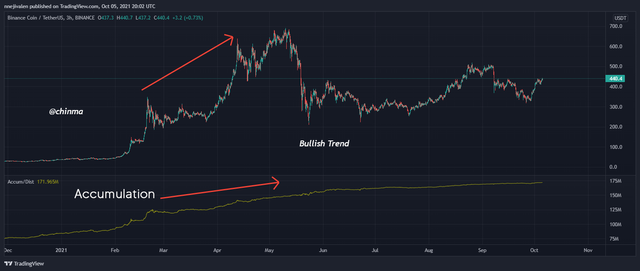
I have stated the fact that the volume in the market is directly proportional to the Accumulation/Distribution line of the market, this simply means that if the trend of the price is bearish, then the A/D line indicator will also be on a bearish trend, in other words, they are moving in the same direction. The trend is confirmed the A/D line tells us what is happening, where, and how the money is flowing to.
For the chart of ADAUSDT in the 15mins time frame, we can see where the price was on a bearish trend and also the A/D line indicator is on the downward trend.
Picture from tradingview As the price is on a bullish trend, the A/D line will also be on an uptrend, this also means that the traders are holding the asset and we can see that from the Chart of ADAYSDT in a 15 mins timeframe where the price was on a bullish trend and the A/D line is also on a bullish trend.
Picture from tradingview
"5-Through a DEMO account, perform one trading operation (BUY or SELL) using the A/D Indicator only. (Screenshots needed)."
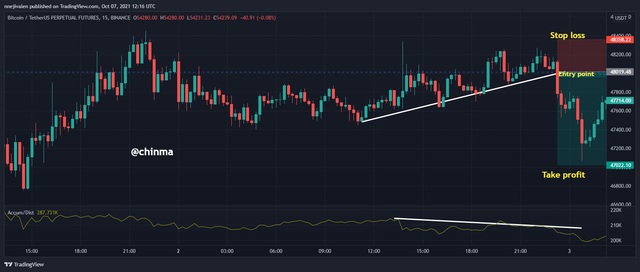
In the chart of BTCUSDTPERP below in on a 15mins time frame, I took a sell trade with the following points. My entry and exit conditions will be listed below for proper understanding
Entry Criteria:
- I draw a trend line to determine the direction of the price and from the trendline, it was on an uptrend
- I also used another trendline to determine the trend of the A/D indicator which was on a downtrend.
- We can notice that there is a divergence between the price and the A/D indicator
- Once the price breaks the trendline, I entered a sell order
Entry Criteria
- I placed my stop loss at the recent Resistance line
- With the Stop loss I place, I used risk to reward ratio of 1:2 to determine my take profit.
- The price is on the downtrend
- Both the RSI and the A/D indicators should be in uptrend
- The movement of the trend has caused a divergence
- Price must break the trend of the price to begin another trend.
- The RSI must have indicated either Oversold or overbought, depending on where it was seen, which signifies a weak of sellers in the market
- The confirmation is now double, now your believe might have strengthen.
Picture from tradingview You can also see the result I have already made using this wonderful strategy below.
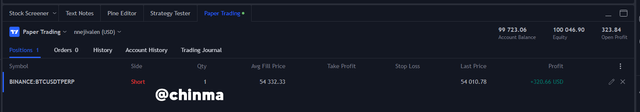
Picture from tradingview
"6-What another indicator can be used in conjunction with the A/D Indicator. Justify, explain and test. (Screenshots needed)."
Indicators are very when they are used in conjunction with one another, so we will putting two powerful indicators to give us a very powerful entry point that will give us profit as a crypto trader. We will be combining the Accumulation and Distribution Indicator which is commonly known as the A/D indicator with the Relative Strenght Index which is commonly called the RSI. So let's quickly know how to combine both indicators to produce an entry point.
First of all, we should that when these two indicators come together, they help to filter false signal in the market and also shows us when a price has overbought and oversold.
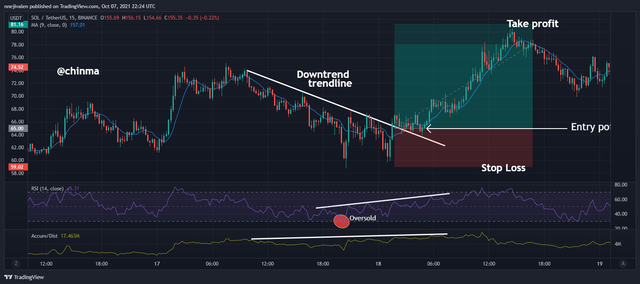
In the chart below, The RSI and the A/D indicator are added below. How can know the accurate point to make an entry using this strategy, with the following points below, you will know
We can that in the chart SOLUSDT below, And the chart met all the criteria required.
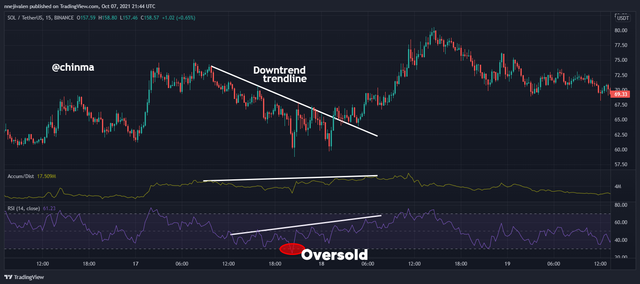
Picture from tradingview Using this strategy to place a trade to properly show you that the strategy works effectively
The Price was on a downtrend in the case but the AD and RSI were both showing us an uptrend, this led to a very good divergence, and the RSI was at Oversold, this is another confirmation for a buy in the market, once the price breaks the trend and the above the condition are all in place, you can entry your sell order. The stop loss should be place in the closet Support line that is there and the take profit should be determined by using the Risk to Reward Ratio of 1:2, which was done effectively.
Picture from tradingview This result of the trade we took last time is given below.
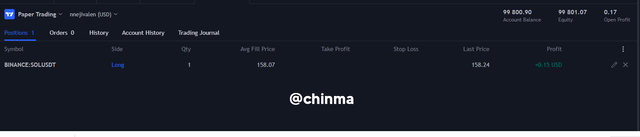
Picture from tradingview
Conclusion
Accumulation is simply meant for traders to hold their assets while Distribution is leaving their assets, and thus both can be seen in an indicator called the Accumulation / Distribution Indicator, which is a volume base.
This indicator is trying from time to time. It is a very good indicator that we should try using itCc: @allbert
Hello @chinma Thank you for participating in Steemit Crypto Academy season 4 week 5.