Steemit Crypto Academy | Season 4 : Trading with Strong, Weak and Gap Levels | Homework task for @allbert
Hello All Steemians !!!
Today I'm going to make my Steemit Crypto Academy Homework task by professor @allbert that talking about Trading with Strong, Weak and Gap Levels. Very interesting lessons. Actually I have very little knowledge about this, but I will try to discuss it to improve my writing skills. On this occasion I will try to discuss it.

Explain the Difference Between Weak and Strong Levels
Strong Level
In the world of cryptocurrencies, support and resistance indicators are factors that can be analyzed by traders to help the process of price prediction and trading execution of a crypto asset. A strong level indicates that the support and resistance levels are reliable. Strong support and resistance levels indicate several times the price has experienced price rejection or pull back. When analyzing the chart of a crypto asset, as a trader you can observe strong levels marked by support and resistance levels that make the price go up or down several times in the market.
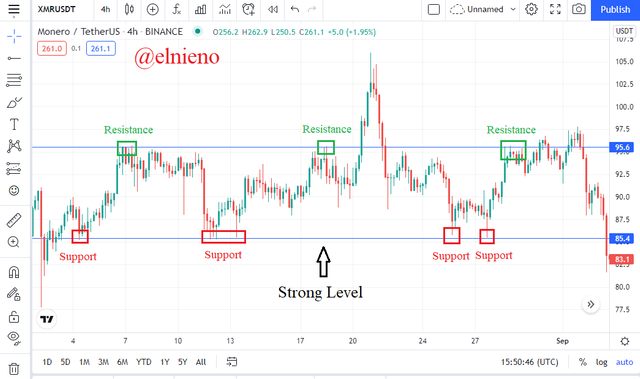
Based on the chart above, you can see several support and resistance levels. The price of XMR/USDT has increased several times from the support level to the resistance level. This proves that there is a strong level forming in the market. What causes strong levels in the market is the high trading volume and the many buy and sell orders that traders place at any given time. When the price reaches the support and resistance levels, pending orders will be executed and making the market liquid. This affects the price movement of XMR/USDT which goes up or down after reaching certain support and resistance levels.
Weak Level
Conversely, a weak level indicates that the support and resistance levels are unreliable. Weak support and resistance levels indicate the price has broken through support and resistance levels and is able to bounce the price only once or twice. When analyzing the charts of crypto assets, as a trader you can observe weak levels marked by broken support and resistance levels that make prices continue to rise or fall in the market.
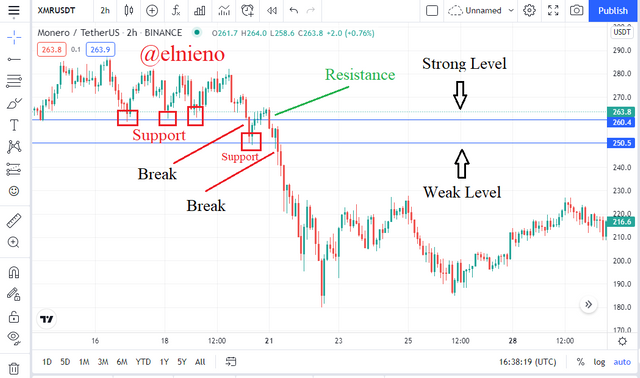
Based on the chart above, you can see several support levels and one resistance level. The XMR/USDT price has broken through the support level and only bounced back to the resistance level once. This proves that there is the formation of weak levels in the market. What causes weak levels in the market is low trading volume and fewer buy and sell orders that traders place at any given time. When the price reaches the support level, pending orders will be executed but only a little and quickly run out. This affects the price movement of XMR/USDT has increased once. When the price reaches the support level again and there are no more pending orders, the support and resistance levels are broken.
Explain What a Gap is
A gap is a jump in the price of a crypto asset that appears on the chart indicating the price has crossed a certain level and created a new level without the previous level. In this case, the price shows that it has opened a new price after the last closing price but there is a price gap between the two. On the chart you can see and analyze based on the formation of a new candlestick that does not match the closing of the previous candlestick because of the empty candlestick in the middle.
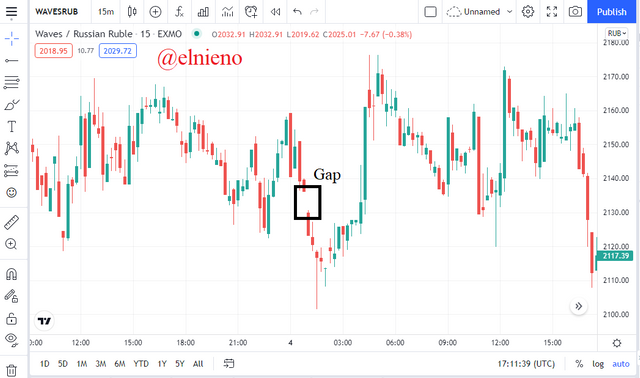
Based on the chart above, a gap occurs in the WAVES/RUB market, which indicates a sudden jump in price movements due to high trading volume. This happens in the transaction process because many traders buy or sell assets in the market. Another possibility is that many traders take all the assets, causing a gap in the market and causing the price to fall. A gaps that form in the market will usually fill over time and can be used as support and resistance levels.
Explain the Types of Gap
Breakaway Gap
A breakaway gap is a type of gap that indicates a breakout in the market structure and indicates a changing trend in the market. After this gap is formed, here the market indicates the start of a new trend. It also indicates a strong support and resistance level.
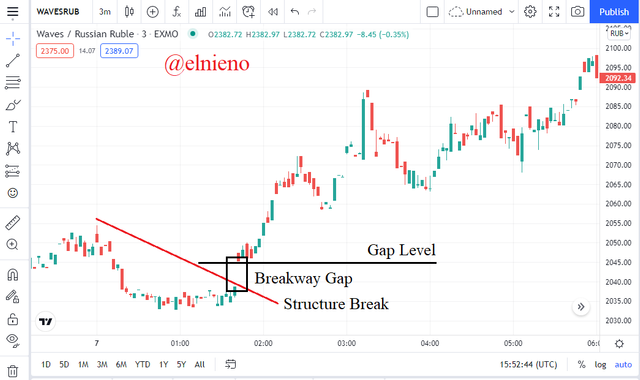
Based on the chart above, WAVES/RUB is experiencing a decrease in price and a downtrend in the market. A breakaway gap is formed on the chart, this indicates a breakout in the market structure and indicates a change from a downtrend to an uptrend in the market.
Runaway Gap
Runaway Gap is a type of gap that indicates trend continuation and occurs in the middle of the market structure. This gap is formed because several traders are trying to buy or sell an asset at any given time. It also indicates important support and resistance levels.
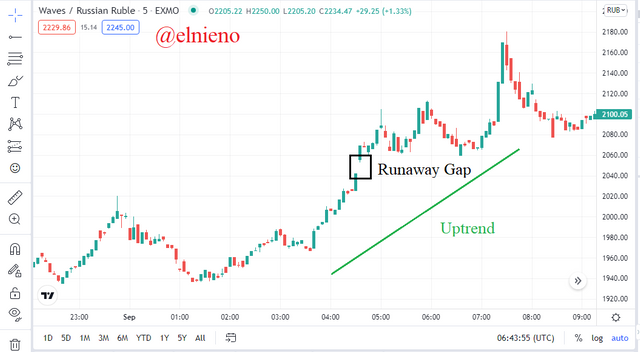
Based on the chart above, WAVES/RUB is experiencing an inrease in price and a uptrend in the market. A runaway gap is formed on the chart, this indicates a trend continuation in the market.
Exhaustion Gap
Exhaustion Gap is a type of gap that indicates almost over the current trend. This gap forms when the market is showing exhaustion and will provide a final push or pull back. The price movement in the market will fill the gap formed. This indicates the market is moving in the opposite direction. support and resistance levels don't really matter.
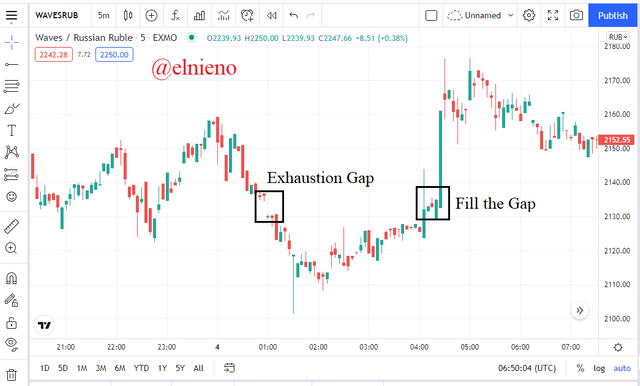
Based on the chart above, WAVES/RUB is experiencing a decrease in price and a downtrend in the market. A exhaustion gap is formed on the chart, this indicates almost over the current trend in the market. The rising price movement will fill the previously formed gap.
Perform the (Buy/Sell) Through Strong Supports and Resistances
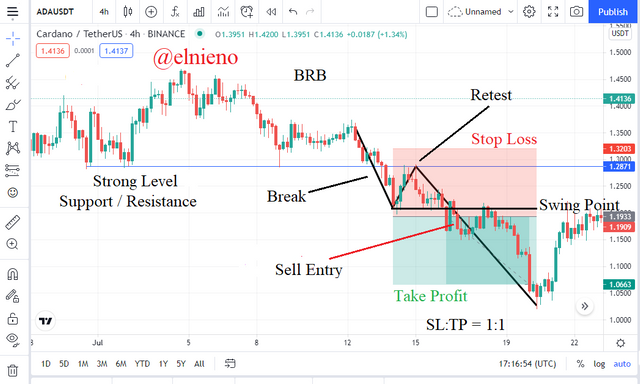
Based on the chart above, I use the Break Retest Break (BRB) strategy which shows a break of the support or resistance level of the ADA/USDT. I analyze the market trend which shows a downtrend. I identify and mark support or resistance levels. I saw the price of the ADA/USDT break through a support or resistance level and create a swing point. I saw the price of the ADA/USDT rising and retesting a support or resistance level. I saw the price of the ADA/USDT breaking the swing point. I placed a sell entry below or after the break of the swing point. I set the stop loss and take profit ratio 1:1.
Perform the (Buy/Sell) Through Gaps levels
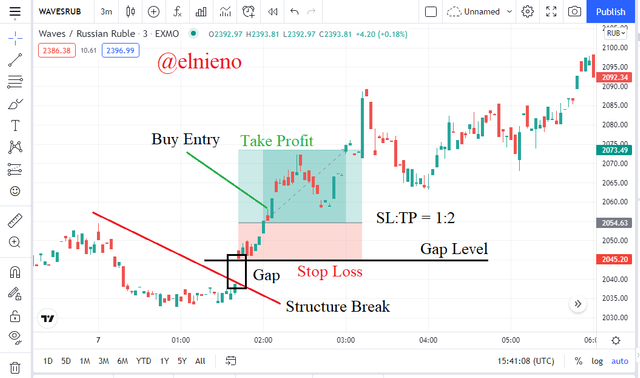
Based on the chart above, I placed a buy entry WAVES/RUB on a bullish candlestick after the gap formed and broke through the market structure. Here the market shows a change from a downtrend to an uptrend. I set the stop loss and take profit ratio 1:2.
Conclusion
In the world of cryptocurrency trading, there are many strategies and indicators that can help traders run trades in predicting prices and executing buy or sell orders. The support and resistance indicator is one that is often used by many traders. The use of this indicator increases the trading success rate and is very profitable. Analysis of strong and weak support and resistance levels can help provide accurate information about price movements and changing trends in the cryptocurrency market.
Hello @elnieno Thank you for participating in Steemit Crypto Academy season 4 week 1.
Thank you professorrr!!!