You are viewing a single comment's thread from:
RE: Steemit Crypto Academy Season 6 Week 2 - Crypto Trading Strategy with Triple Exponential Moving Average (TEMA) Indicator
So I'm wondering, if in a bullish trend, the price is above the TEMA, how can it be resistance by the TEMA?
For a clear uptrend, the asset would be trading above TEMA, when the market tends to change direction even in a bullish trend, the candlesticks appears below TEMA and find it hard to break above again. Such that a new trend is beginning. Same thing applies to the opposite trend. Thanks. You can check on the chart below to understand it better.
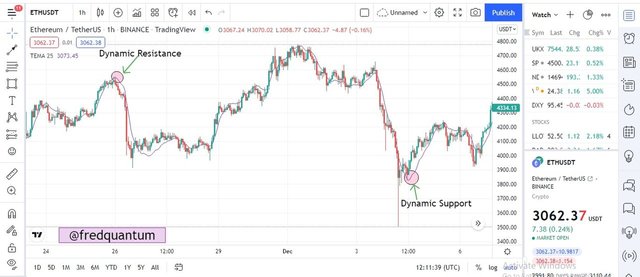
The candlesticks were above TEMA earlier then comes below and was unable to return to trading above the TEMA. As such, TEMA serves as dynamic resistance and support as the price was unable to break through it again in an existing trend. I hope you get it now.
Okay. I get your point. Thanks for the explanation.