Trading Steem with the Ichimoku Cloud.
I am excited to join this competition and explore the Ichimoku Kinko Hyo also called the Ichimoku Cloud a popular tool in technical analysis. This indicator help traders understand market trend and make better trading decision. In this post I wll Explain how it work and how I use it to analyze the Steem/USDT pair.
.png)
I will breaks down the key part of the Ichimoku cloud like the Tenkan sen Kijun sen Senkou span A Senkou Span B and Chikou Span. Then I will shows how i use these part to spot trends reversal and Potential trade set up in the markets.
Five Components of the Ichimoku Cloud and Their Role in Trading Steem |
|---|
The Ichimoku Cloud is an amazing tool that gives full picture of market trend and helps me make beter trading decision. It has five key components and each one play an important role in Analyzing the market. Let me explain each One in details and how I used it when trading the Steem token.
1. Tenkan Sen (Conversion Line)
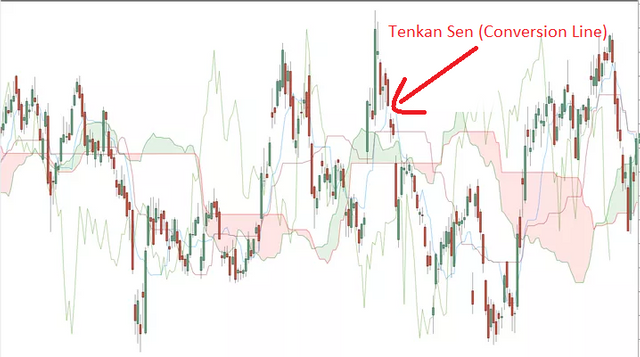
The Tenkan sen is the fast moving line in the Ichimoku Cloud. Its calculate by taking the Average of the highest high and lowest low over the last 9 period This line helps me understand the short term trend.
- Example: If the Tenkan sen is moving upwards it show that prices have been increasing recently When I see this it tell me that the short term momentum for Steem is strong On the other hand if the Tenkan sen is flat it might indicate that the price is moving sideway and there is not much of trend right now.
2. Kijun sen (Base Line)
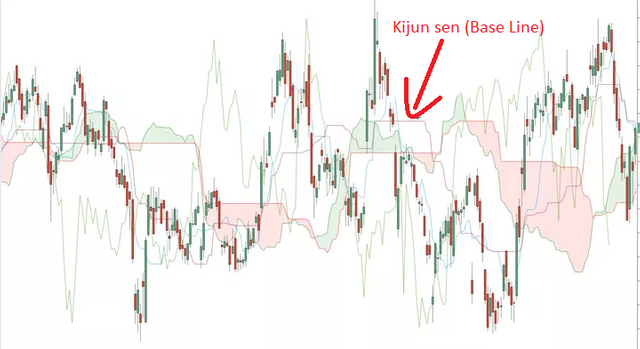
The Kijun Sen is the slower moving line and is calculated using the average of the highest high and lowest low Over the last 26 periods. This line help me understand the medium term trend and act as key support or resistance Level.
- Example: If the price of Steem is above the Kijunsen it tells me that the market is still in an uptrend in the medium term. I often use this line to set my stop loss or to watch for potential trend reversals. If the price crosses belows the Kijun sen it may be a signal that the trend is weakening.
3. Senkou Span A (Leading Span A)
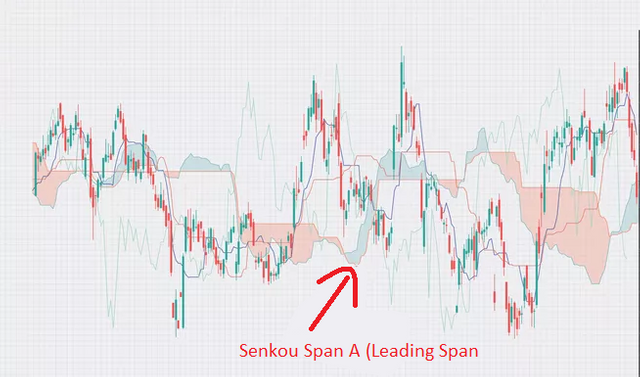
The Senkou Span A is one of the two lines that form the Ichimoku Cloud (the shaded area). Its calculating by averaging the Tenkan sen and Kijunsen and then ploting that value 26 periods ahead. This helps me get a forward looking idea of Suport and resistance level.
- Example: If the price of Steem is above the Senkou span A this suggested that the market is bullish and the cloud can act as future support. If the price is below this line I see it potential resistance and it could be harder for the price to rise.
4. Senkou Span B (Leading Span B)
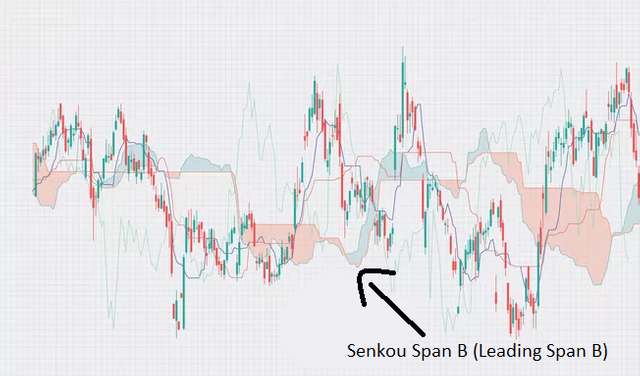
The Senkou Span B is the second line that forms the other boundary of the Ichimoku Cloud. Its calculated by taking the average of the highest high and lowest low over the past 52 periods and plotting it 26 periods ahead. This line moves slower than Senkou Span A and gives me a sense of longer term trend.
- Example: If the Steem price is below both the senkou Span A and Senkou Span B the market is bearish and the cloud acts as resistance zone. When the price is within the cloud I know the market is in consolidation Phase and I might wait for clearer direction before making move.
5. Chikou Span (Lagging Span)
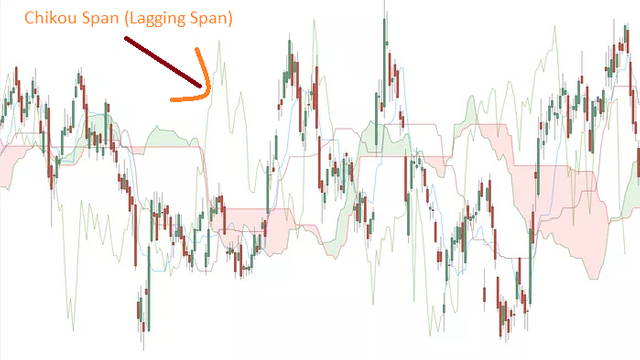
The Chikou Span is a line that plots the current price 26 period back. It help me compare the curent market price with the pasts price and show me the strength of the trend.
- Example: If the Chikou Span is above the price chart it confirms that the market is in strong uptrend. when the Chikou span is below the price chart it signals a downtrend. This is Useful for confirming my analysis before I enter trade on Steem.
Bringing It All Together
When I used the Ichimoku Cloud for trading Steem I look at all five component together. For example if the price is above the cloud the Tenkan seen is above the Kijun sen and the Chikou Span is above the price it gives me strong signal that the market is in uptrend and I might consider buying. on the other hand if the price is below the cloud the line are Pointing downwards it might be time to sel or stay cautious.
This indicator helps me plan my trade more effectively because it does not just show me the curent trend it also gives me sense of future support and rsistance level which is really helpful in the volatile cryptocurrency market.
Trend Direction with the Ichimoku Cloud for Steem/USDT |
|---|
In analyzing the trend direction of steem/ USDT using the Ichimoku Cloud we can see that the cloud offers us a comprehensive view of the markets trend by provide several key indicators. These include the Kumo (Cloud) Tenkan Sen (Conversion Line) Kijun-sen (Base Line) Chikou Span (Lagging Line) and the overall placements of the price action relative to the Cloud.
Uptrend Downtrend or Consolidation
Looking the historical price data for Steem/USDT from early August to mid October 2024 we can use the Ichimoku Cloud to determine Whether the market is in uptrend downtrend or consolidation Phase.
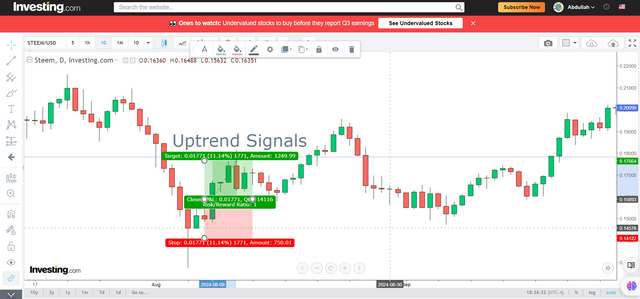
1. Uptrend Signals:
An uptrend is usually indicated when:
- The price is above the cloud.
- The Tenkan-sen is above the Kijun sen.
- The Chikou Span is above the price.
From August 8 2024 to August 12 2024 we can observe period of up ward price movements where the price rises from $0.14997 on August 7 to $0.17312 by August 13. During this time the Ichimoku Cloud would likely have been provides buy signal as the price stay above the cloud showing potential bullish strength.
.png)
Example:
Imagine the cloud as a support level. When the price is above this "cloud " traders often consider buying opportunitie. For instance if the price on August 9 was Supported above the cloud it would signal that the trend is up wards and traders might see this an Opportunity to buy into the strength.
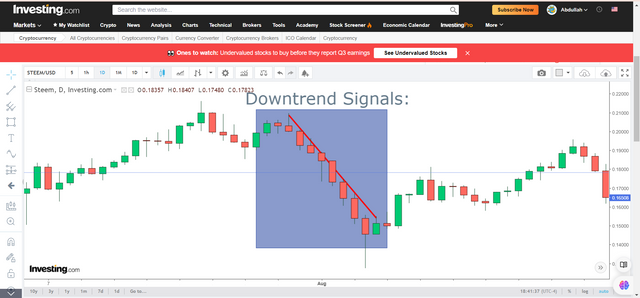
2. Downtrend Signals:
A downtrend is confirmed when:
- The price is below the cloud.
- The Tenkan-sen is below the Kijun-sen.
- The Chikou Span is below the price.
From August 1 to August 5 2024 Steem/USDT experienced a clear downtrend. The price dropped from $0.18443 on August 1 to $0.14571 by August 5. During this period the price would have been below the Ichimoku cloud signaling a bearish trend and potential seling opportunities. Aditionally the conversion line would likely have been crossing below the base line reinforcing the down trends.
.png)
Example:
If you are driving down a hill and see a steep decline its a signal that the road ahead (the market) is bearish similarly when the price moves below the Ichimoku cloud it signals to trader that selling might be more favorable because the downward momentum is strong.
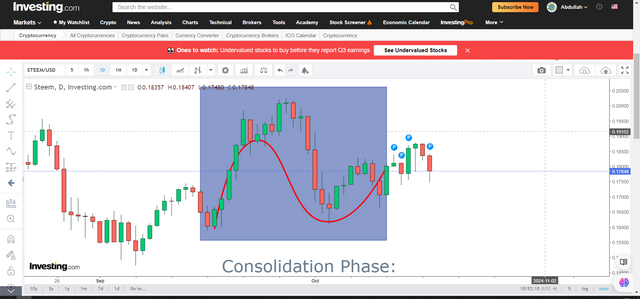
3. Consolidation Phase:
When the price is inside the cloud it signals a period of indecision or Consolidation. During this time the market could be fluctuating between buyers and sellers with neither side having clear control.
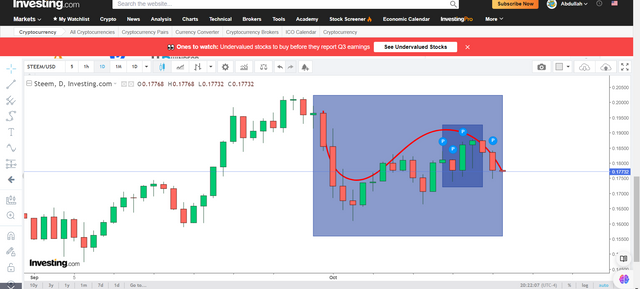
In the chart from September 16 to October 10 2024 Steem/USDT shows several days where the price fluctuates without a clear upward or downward direction. Prices ranged between $0.16036 to $0.18682 with both upward and downward movement. This could suggest Consolidation phase where the price might be within the cloud.
.png)
Example:
Consider the cloud as a foggy road where visibility is unclear. When the price is inside the cloud it hard to predict whether it will go up or down. During this phase trader might avoid entering the market until clear breakout occur either above or below the cloud.
Potential Buying or Selling Opportunities
The Ichimoku Cloud also helps identify key buying or selling opportunities based on crosovers and cloud thickness:
- Buying Opportunity: When the price moves above the cloud and the conversion line crosses above the base line this signal a potential buy.
- Selling Opportunity: When the price moves below the cloud and the conversion line crosses below the base line this signala potential sell.
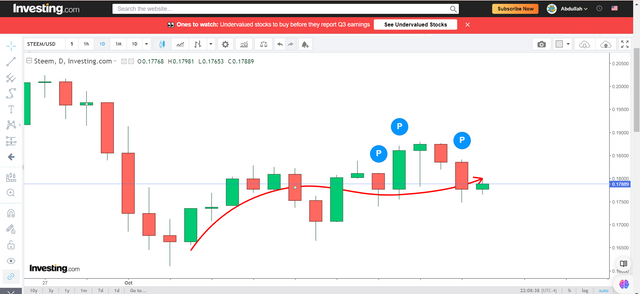
In this case if we look at the recent price data from October 10 to October 17 2024 we notice that the price has been gradually declining from $0.18357 to $0.17732. Given the overall bearish trend the Ichimoku cloud would likely be indicating seling opportunities as the price is either below or approaching the clouds.
.png)
| By using the Ichimoku Cloud on the Steem/USDT chart I can clearly see when the market trends up ward downward or consolidates. Each element of the cloud provide useful insights from identifying strong support and resistance level to signaling potential entries and exit. |
|---|
Identifying Support and Resistance Levels with Ichimoku Cloud in Steem Price Action |
|---|
The Ichimoku Cloud is powerful indicator for identifying suport and resistance levels dynamically. The cloud represents these level base on past price action projecting them into the future. In this case the cloud helps in showing areas where price may struggle to break through or bounce off.
Example of STEEM/USDT Price Action
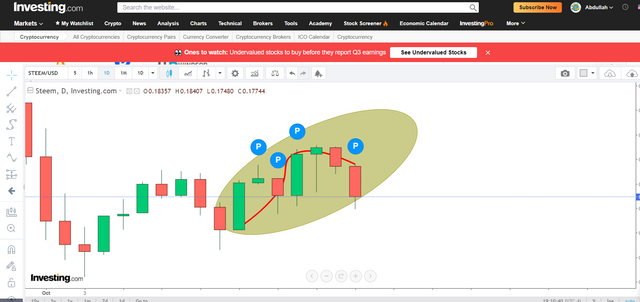
On October 17 2024 the price of Steem dropped by 3.40% to $0.17732. Before this on October 16 Steem was trading above $0.18357 showing a slight downward trend. During this period the Ichimoku Cloud was acting resistance as the price was below the cloud. This was a signal that further down ward movement might be expect. The cloud acted as dynamic resistance helping to predict the continuation of the downtrend.
.png)
Conversely on October 12 2024 when the price was around $0.1811 the Ichimoku Cloud was providing suport since the price was above the cloud. As a result the price managed to bounce up to $0.18605 by October 14 indicating bullish reversal.
| In both example the Ichimoku Cloud served as a reliable tool for identifying support and resistance. When the price is above the cloud the cloud acts support when the price is below it serves resistance. These dynamics can be critical for predicting reversals and continuation which are essential for successful trading decisions. |
|---|
Trading Strategy Using Ichimoku Cloud for Steem Token |
|---|
To develop trading stratgy using the Ichimoku clouds i focused on key signal generated by the clouds components such as Tenkan Sen (conversion line) Kijun sen (base line) and Chikou span (lagging span). Here how I would aproach trading the Steem token
Entry Strategy:
Bullish Signal (Buy Setup):
- Tenkan sen Croses Kijun sen Above the Cloud: This is strong bulish signal. I will enter buy Position when the Tenkan sen crosse above the Kijun sen while the price is also trading above the cloud (Kumo). this indicates momentum and potential trends reversal to the upside.
- Price Above the Cloud: When Steem price break above the cloud this reinforces the bulish sentiments and increases the likelihood of the trend contine upward.
- Chikou Span Confirmation: If the Chikou Span is above the price from 26 period ago and the cloud is gren (uptrend cloud) it confirm a strong bullish trend.
Bearish Signal (Sell Setup):
- Tenkan sen Crosses Kijun sen Belows the Cloud: This is strong bearish signal i will enter sell position when the Tenkan sen croses below the Kijun sen while the price is trading below the cloud
- Price Below the Cloud: If the price drop below the cloud it signals a bearish trend and I will consider shorting Steem or exiting any long Position.
- Chikou Span Confirmation: When the Chikou Span is below the price from 26 period ago and the cloud is red (downtrend cloud) it confirm bearish momentums.
Exit Strategy:
Take Profit for Buy Positions:
- Tenkan-sen Crosses Kijun-sen Below the Cloud: If the Tenkan sen croses below the Kijunsen while price approaches the cloud it signals potential weakening of the trend. This would be a good exit point to lock in profit.
- Price Approaching the Lower Cloud Boundary: If the price starts aproaching the lower boundary of the cloud after a rally it may indicate reversal so I will exit my buy position to avoid losses.
Take Profit for Sell Positions:
- Tenkan sen Crosses Kijun sen Above the Cloud: If the Tenkan sen crosses above the Kijun sen it suggest a potential reversal. I will consider exiting my short position.
- Price Approaching the Upper Cloud Boundary: If the price approaches the upper cloud boundary I will consider exiting as it indicates possible resistance or consolidation.
Real Chart Example:
Using the price data for Steem between October 1 2024 and October 17 2024:
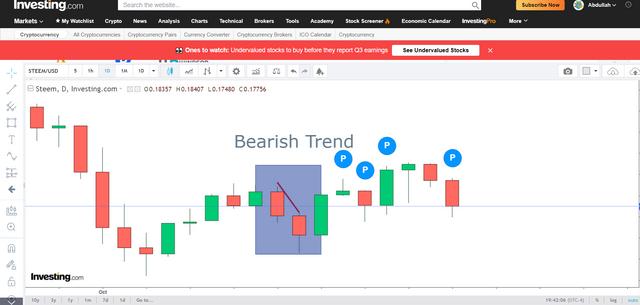
- October 10 2024: The price of Steem closed at $0.17069 slightly below the cloud. The Tenkan sen crosed below the Kijun sen earlier and the Chikou Span is below the price. This indicates a bearish trend. I would enter short position here targeting further downside.
.png)
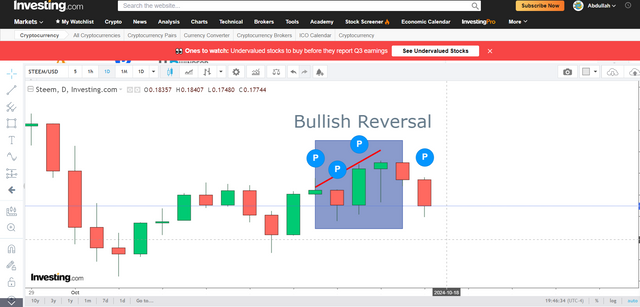
- October 14 2024: The price broke above the cloud at $0.18605 and the Tenkan Sen crossed above the Kijun sen confirming a bullish reversal. This was good point to exit the short position and posibly go long.
.png)
forecasting Future Price Movement Using the Ichimoku cloud for Steem Tokens |
|---|
When applying the Ichimoku Cloud to forecast the future price movement of Steem I look at several key elements within the Ichimoku system particularly the Senkou Span A and Senkou Span B Which define the cloud and project potential suport and resistance areas.
Senkou Span A: This line represents the midpoint between the Tenkan sen (9 period average) and the Kijun-sen (26-period average) and is ploted 26 periods ahead of the current price. When prices are above senkou Span A the market is generaly considered to be bulish and this span acts as a potential suport level.
Senkou Span B: This line is the 52 period average and is also plotted 26 periods ahead. It generally moves slower than Senkou Span A creating the second boundary of the cloud. When prices are above this line it is considered strong support level and when prices are below it the market is considered bearish.
Forecast Based on Ichimoku Cloud for Steem
Looking at the recent price (as of October 17 2024) Steem has been experiencing downward trend with its current price at $0.17732 down from the high of $0.19652 on September 30 2024.
.png)
Bearish Cloud: If the current price is below both Senkou Span A and Senkou Span B the Ichimoku Cloud would signal a bearish forecast indicating a higher probability of continued downtrend. In this case the cloud would serve a resistance zone for future up ward movements.
Potential Reversals: However if the price approaches the cloud from below we might observe a potential reversal if the price breaks above both Senkou Span A and B turning the cloud into a support zone. This shift could hint at bullish trend if supported by rising volumes.
Key Observations for Steem Next Moves
Support Zone: If Senkou Span B is flat it often indicates a strong support level around that Price. Based on historical price we might see support near the $0.160 range (which has been a recent low) as this aligns with previous low.
Resistance Zone: Senkou Span A which move faster may present a resistance level around $0.184-$0.185. A break above this level would sugest a bulish reversal.
| In conclusion based on the Ichimoku Cloud Steem next moves are likely to be guided by whether it can hold above the $0.160 support level or break the $0.184 resistance. If it remains below the cloud further downward pressure is expect. However if it break above a bulish trend may develop. |
|---|
THE QUEST TEAM has supported your post. We support quality posts, good comments anywhere, and any tags