Steemit Crypto Academy Contest / S14W4 - Fibonacci Retracements.

Edited with canvas
As a crypto or forex trader that have been on the market for a long, I am sure you might have noticed that there is a certain pattern that the price of the cryptocurrency you are trading follows which happens as a consolidation between the price range of the cryptocurrency.
The price of an asset will continue to be in a consolidation range forming a move which you might have noticed in q market trends how the price of an asset moves to a specific level before another region can continue moving. Fibonacci retracement tools are the best tools traders use to identify potential pullback and the reversal points of an asset.
In your own words, what are Fibonacci Retracements and what are they used for?
Fibonacci retracements as we have earlier said, are one of the best tools you can use as a trader to confirm an entry point, Stop-loss, and take profit in the crypto or forex market.
Simply put, Fibonacci retracements is a line that is horizontal which shows (display) how support and resistance levels can likely occur.
Fibonacci retracements tools are connected with a percentage (%) that indicates, how far a previous move of the price of the traded asset has retraced back. Normally, if you look at Fibonacci retracements on a chart you will see that it begins with 23.6%, 61.8%, and so on.
The drawing of a Fibonacci retracements tool begins from the current highs to the current lows which are represented in percentages as previously discussed in this post. Crypto traders take advantage of Fibonacci retracements tools to place a trade when the price has reversed during a retracements at the support and resistance levels.
Fibonacci extension is a bit different from Fibonacci retracements tools since it doesn't have a specific formula that can be used for calculation. What you should know about FB extension is that it is used in combination with FB retracements to know the target price of an asset.
| The use of Fibonacci retracements |
|---|
This I have introduced earlier, and I am going to elaborate more on the use of Fibonacci retracements for you to understand better. Without wasting your time, Fibonacci Retracements is used in the following ways.
To place entry orders
To determine stop-loss and take profit levels
It is used to set price targets.
Fibonacci Retracements is also used to draw support lines
It is used to identify resistance levels.
| Example of Fibonacci retracements tools on STEEM/USDT pairs |
|---|
 Tradingview
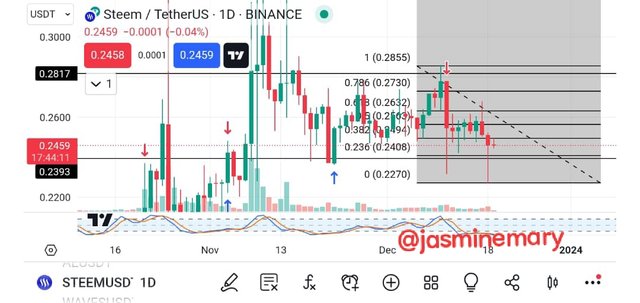
From the above chart of STEEM/USDT, you will see that from December I have identified a reversal level following price retracements at the time the Steem was on a downtrend.
On the chart again we can see that the Fibonacci retracements tools were drawn starting from the current high price of 1(0.2855) down to the current low price of 0 (0.2270). As for the support and resistance levels, from the chart, we can see that the support level is at 0.235% $0.2408 which represents the key level of the Fibonacci retracements tools.
Explain the most important Fibonacci levels and show at least one example on a chart of a cryptocurrency pair.
As I have discussed earlier Fibonacci retracements are used to identify potential levels of support and resistance which begin with 0 and 1 numbers and above.
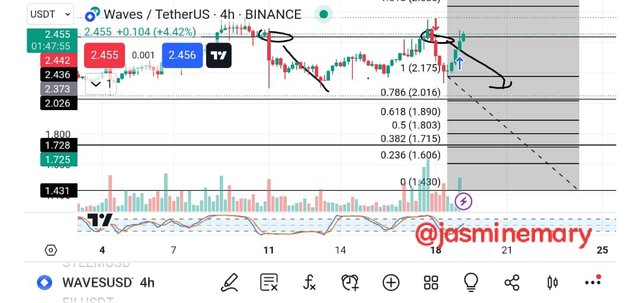
The important levels of FB are what is used for the calculation of Fibonacci retracements. Having said that the important Fibonacci levels are 0.236%, 0.382%, 0.5%,0.618, and 100%.
 Tradingview
These levels of Fibonacci as you can see from the above chart of WAVE/USDT pairs are considered the most important levels because they are the levels that correspond to the key psychological level when you are using Fibonacci retracements to analyze the market.
Use the STEEM/USDT chart and show how Fibonacci retracements work.
This is a chart of STEEM/USDT
 Tradingview
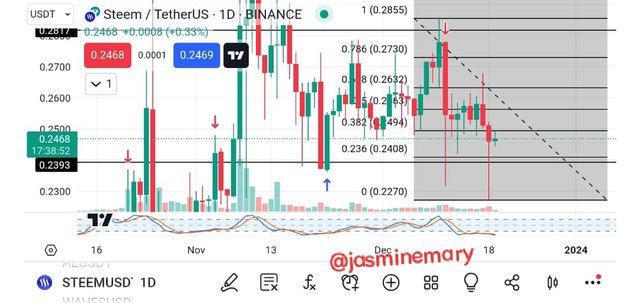
From the above chart, the price of STEEM/USDT rises from its highest high to its lowest low. With this type of retracements, if it breaks any key levels of Fibonacci, the market will either break up or break down depending on the direction of the market.
How the Fibonacci retracements work is that if it breaks down at any level it gets the point and if it doesn't break down further 0(0.2280) which is a rejected support level and with the rejection the market flips upward in an opposite direction to 0.38 retracements.
Advantages and disadvantages of Fibonacci retracements.
Whatever has Advantages also has its disadvantages in this post, I have shared the advantages and disadvantages of using Fibonacci retracements.
| Advantages of Using Fibonacci Retracements |
|---|
Objective Levels:
Using Fibonacci retracements provides you with better objective price levels that can help you identify your potential entry point and exit points and also the levels of stop-loss and take-profit.
Support and Resistance:
The levels of Fibonacci can stand as a dynamic level for support and resistance, which can help you as a trader to know where the price of the asset you are trading will get a reversal or continuation.
Trend Confirmation:
It can be used in conjunction (together) with a trend indicator to confirm the direction and strength of a trend. It helps traders to have more confidence in the market.
Risk Management:
Using FB retracements helps traders manage their risk since it can be used to set stop-loss orders and manage risk properly. With Fibonacci retracements as a trader, you can place your stop-loss order below or above the key levels of Fibonacci to limit your losses.
| Disadvantages of Using Fibonacci Retracements: |
|---|
Subjectivity:
It is not easy when select the beginning and ending points when drawing Fibonacci levels. Doing this can lead to variations in multiple results.
Psychological stress:
Relying on Fibonacci levels to get the best results can be stressful as drawing Fibonacci is not usually easy for both experienced and novice traders.
False Signals:
Just like other technical Indicators are capable of producing false signals it is how Fibonacci retracements can also give traders false signals if they didn't use additional indicators for confirmation.
Complex for Novices:
It is hard to use for both novice and expert. Novices are the ones that find it difficult and confusing to use. It is not easy to understand it takes time and patience.
Conclusion:
Fibonacci retracements tools are used by a trader to determine and confirm their entry and exit point in the market which we have learned in this post. Also as for the Fibonacci extension, it is used to determine where the price is moving next.
@dave-hanny, @yakspeace, and @kuzyboy I am inviting you all
Hello friend. What an interesting post you hsve shared. I want to first of all commend your overall content from the good choice of words to the way you navigated your points. Hopefully, a beginner who has no single idea about the World pf cryptocurrency and forex trading will understand everything about Fibonacci retracements and it extension...
Fibonacci retracements are one of the best tools that a trader can use to confirm and determine his or her entry to the market as well as exit. It is called one of the best because it has helped to show traders how support and resistance cam likely occur in the market.. the Fibonacci extension is truly different from the FB retracements. They have their respective functions as you have evaluated them...
You gave good uses of the Fibonacci retracements from the placing of go entry to setting of price target, determining stop loss and take profit levels as well as other notable uses. Indeed this tool is very useful to traders...
Using the graphics of the trading view of STEEM/UDST and WAVE/USDT provides a clear understanding of how this tools works as the contest question demands.. For sure, any thing with advantage must have a disadvantage. Thanks for broadly explaining that also...
Thanks for sharing and good luck with the challenge...
Thanks for your compliment sir.
Absolutely! Recognizing those consolidation patterns and understanding the intricacies of price movements is key. Fibonacci retracement tools indeed play a crucial role in identifying potential pullbacks and reversal points. Keep trading smart!
I have also participated in the contest, do well to check it out and engage. My post link to the contest.
Thank you, friend!


I'm @steem.history, who is steem witness.
Thank you for witnessvoting for me.
please click it!
(Go to https://steemit.com/~witnesses and type fbslo at the bottom of the page)
The weight is reduced because of the lack of Voting Power. If you vote for me as a witness, you can get my little vote.
Your post has been successfully curated by @sduttaskitchen at 35%.
Thanks for setting your post to 25% for @null.
We invite you to strive to publish quality content.
It could qualify you to be nominated for the weekly Top of our curation team.
Burning STEEM by sending it to the @null account helps reduce the supply of STEEM and so increases its price.
Greetings friend,
You've shared your thoughts on the topic of discussion for this week, the Fibonacci retracements. You mentioned and explained the important levels and even showed an example on a ETH/USDT chart.
You've also used the STEEM/USDT chart to explain Fibonacci retracement and discussed its advantages and disadvantages. Overall, you've displayed great efforts into answering each question. All the best.
Thank you sir, for your support.
You are welcome and you inspire me a lot.
¡Hola @jasminemary!
Excelente explicación sobre Fibonacci retracements. Has proporcionado una descripción clara y detallada de cómo funcionan y cómo los traders pueden utilizarlos en el análisis técnico.
Me gustó mucho cómo presentaste los usos prácticos de los retracements en el trading de criptomonedas, y también proporcionaste ejemplos con gráficos de pares como STEEM/USDT y WAVE/USDT. Esto ayuda a visualizar cómo los niveles de Fibonacci pueden influir en las decisiones comerciales.
También, abordaste de manera completa tanto las ventajas como las desventajas de utilizar Fibonacci retracements. Es valioso señalar que, aunque son una herramienta poderosa, también pueden tener desafíos, como la subjetividad en la selección de puntos de inicio y fin.
En general, has hecho un gran trabajo en explicar un tema técnico de manera accesible. ¡Sigue así! Si tienes alguna pregunta o necesitas más información, no dudes en preguntar. ¡Saludos! 😊✨
Thanks. Indeed Fibonacci retracements is a good tools to used.
Saludos amiga jasminemay.
Te felicito por tan buena participación, tus palabras son claras y precisas, además fáciles de procesar, nos presentaste buenos ejemplos en los gráficos y un buen análisis de cada situación.
Te deseo muchas bendiciones, feliz y bendecido día.
Dejas claro que los retrocesos de Fibonacci se utilizan de diferentes maneras para realizar órdenes de entrada, determinar los niveles de entrada y salida, para establecer precios objetivos, para definir líneas de soporte y/o resistencia.
Gracias por haber participado, has hecho un buen trabajo para responder cada pauta relacionada al tema.
Saludos y éxitos.
Greetings, my friend @jasminemary!
Your in-depth analysis of Fibonacci retracements is phenomenal! The way you simplify complex concepts for traders is remarkable.
Keep sharing such insightful posts; they're incredibly valuable. All the best in the contest, success for you! 👍🌟👏
Thanks.