Trading Crypto with Keltner Channels - Crypto Academy / S5W6 - Homework Post for @fredquantum

Q.1. Creatively discuss Keltner Channels in your own words.

"Variety" they say, "is the spice of life." This also holds true for trading in the crypto market. When navigating through the tempestuous volatility of crypto prices, the more analytical tools a trader has, the merrier.
Whether it's confirming a trend, spotting a reversal or just identifying the magnitude of price volatility, the importance of gunning down the right signals cannot not be overemphasized. The ammo? Technical analysis.
Technical analysis has to do with studying price behaviors via a chart or something else to ascertain the current and probable future price conditions.
When done on a chart, technical analysis enjoys a vast repertoire of tools and/or indicators, some optimal for magnitude study, some for measuring volatility, some for trend identification and/or confirmation and some a bit of all.
One indicator that can be used to study and/or measure price volatility is the Keltner Channels. Chester W. Keltner is credited as the first developer of the Keltner Channels though the version used in today's crypto trading had inputs from Linda Raschke.
Keltner Channels measures the volatility of the price of an asset. It strikes a similiar pose with the Bollinger Bands in that it uses three lines or bands if you're used to Bollinger. The peripheral bands are identified as upper and lower bands according while the middle one is an EMA. It's period is 20 by default.
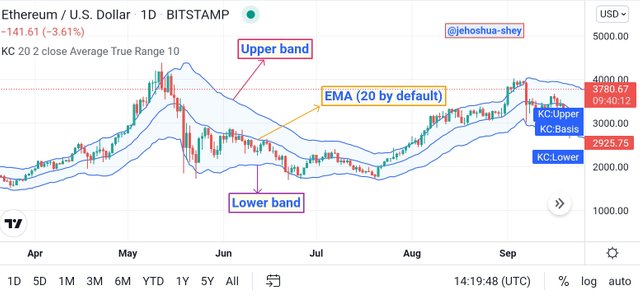
With these three lines, the trader can get insights as to the price behaviors. They can also ascertain support, resistance, trends, breakouts, etc.

Q.2. Setup Keltner Channels on a Crypto chart using any preferred charting platform. Explain its settings. (Screenshots required).

Setting up Keltner Channels on a crypto chart chart is all to easy, if you know what to do that is. One of the standard crypto charts available is Tradingview and I'll use it to demonstrate how to set up the Keltner Channels.
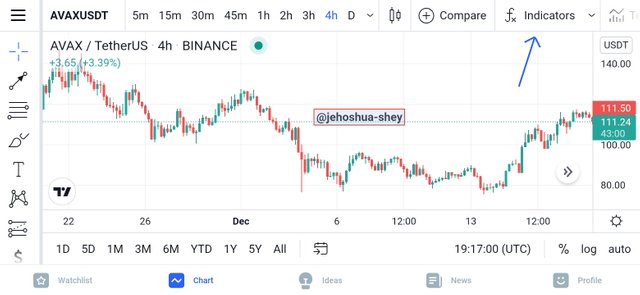
First, open the Tradingview app or web version and select a pair to open the chart. On the chart, click on indicator as shown below
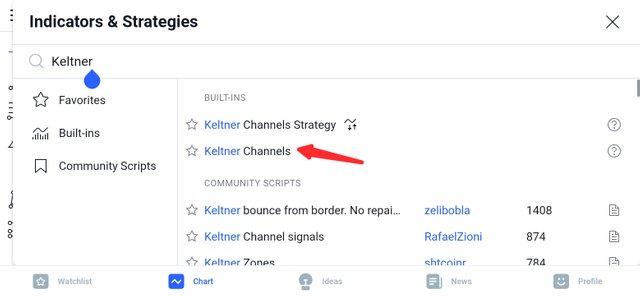
On the dialog box type 'Keltner' in the search box and then select 'Keltner Channels' as shown in the image below.
The indicator appears on the chart and next, we have to configure it. Click on the indicator at the top left and click on the settings icon like in the image below.
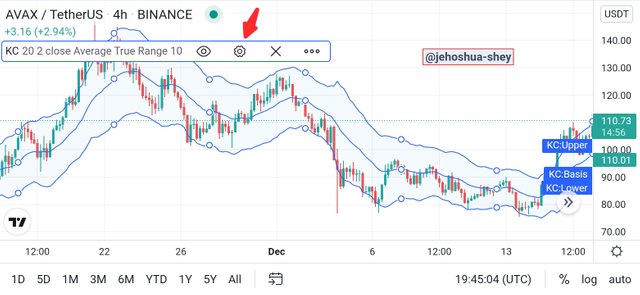
The settings dialog box comes up and from there we can see the different settings tab. The first one is the input tab.
(i.) Input tab: On the input tab, we can set the length of the EMA, the multiplier and the price source (i.e if we want to use the opening, closing, high, or low prices)
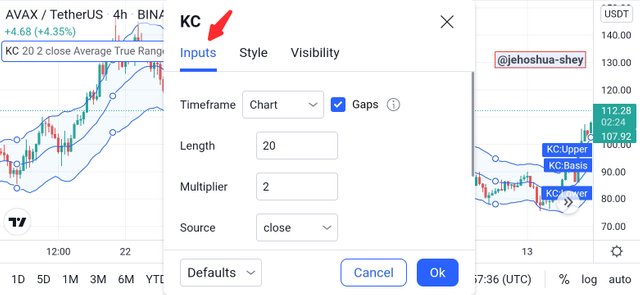
From the image above, we see a default length setting of 20 (i.e 20 EMA), and default multiplier of 2, with opening prices preferred as source.
Scrolling down, we see that we can decide to or not to use an EMA. We can also set up how the bands will appear and adjust the length of our Average True Range ATR
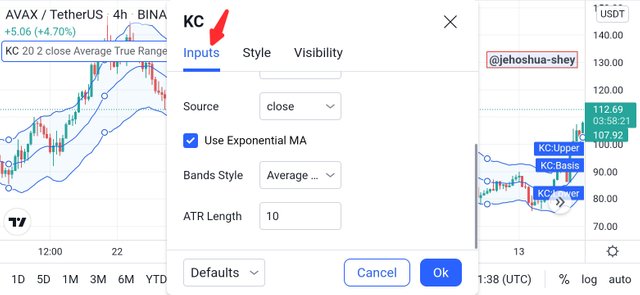
(ii.) Style Tab: Here you can affect the feel of the indicator. Tweak it to your taste. Of course, you need to be in a very stable state of mind when trading cryptos, so of colors mean anything to you, at the style tabs, you can change the colors of the different parts of the indicator.
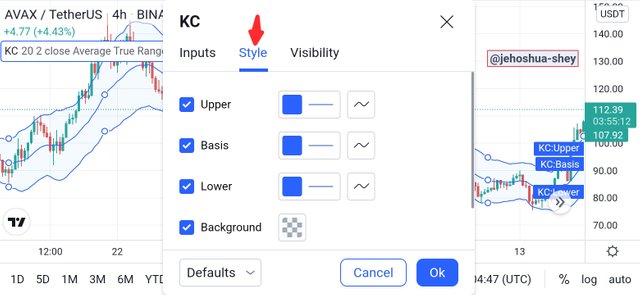
From the image above we see that one can change the colors of each band or line in the Keltner Channels, as well as the background.
Furthermore, we can also set the precision of the indicator in the style tab. Depending on preferences though, it is better left at default.
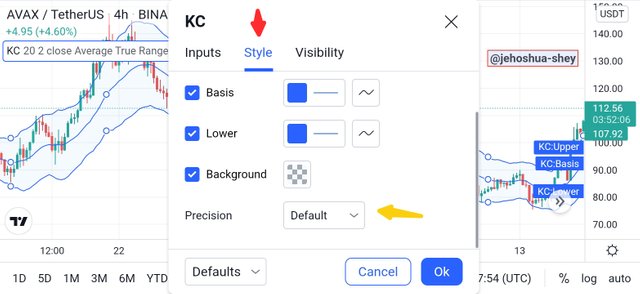
When we're done with our settings, we simply click on the blue 'ok' button at the bottom of the settings dialog box. Once that is done, the Keltner Channels is completely set up.

Q.3. How are Keltner Channels calculated? Give an illustrative example.

Keltner Channels comprises 3 bands namely upper, middle, and lower bands. These are all calculated differently and this is illustrated below.
MIDDLE BAND
First the middle band is simply an EMA. The length is set from the input tab in the settings dialog box and by default is 20. Mathematically,
Where:
MB = Middle Band/Line
EMA = Exponential Moving Average
UPPER BAND
Next is the upper band which is calculated using the formula,
Where:
UB = Upper Band/Line
MULT = Multiplier
ATR = Average True Range
LOWER BAND
Lastly is the the lower band which is calculated using the formula,
Where:
LB = Lower band
EXAMPLE ON CALCULATING THE KELTNER CHANNEL
To calculate the Keltner Channels, you'll need to specify your Exponential Moving Average (EMA) length, your Multiplier, and your Average True Range (ATR) length.
For this example, let's assume the following specifications:
EMA length = 20 periods
Multiplier = 2
ATR length = 10 periods.
To calculate the Keltner Channels, we take the following procedures:
Our middle band becomes EMA 20
For the upper band, we add the product of our multiplier and the ATR value to the corresponding EMA 20 value to get each point on the upper band. Doing this for successive price periods gives a loci of points above the EMA 20 which is our upper band.
Upper Band = EMA 20 + (2 x ATR 10)
- For the lower band, we subtract the product of our multiplier and the ATR value from the corresponding EMA 20 value to get each point on the lower band. Doing this for successive price periods gives a loci of points below the EMA 20 which is our lower band.
Lower band = EMA 20 - (2 x ATR 10)
- Thus, we see that the upper and lower bands are at the same distance from the middle band since it's the same value that is only just subtracted (for lower band) or added (for upper band) from/to the middle band.

Q.4. What's your understanding of Trend confirmation with Keltner Channels in either trend? What does sideways market movement looks like on the Keltner Channels? What should one look out for when combining 200MA with Keltner Channel? Combine a 200MA or any other indicator of choice to validate the trend. (Separate screenshots required)

One of the applications of the Keltner Channels is in confirming trends. This indicator comes in very handy in this area. It can tell when the market is bullish and when it's bearish. Sideways or ranging market can also be identified by this indicator and making all these confirmation is anything but difficult.
UPTREND CONFIRMATION WITH KELTNER CHANNELS
Using the Keltner Channels to confirm uptrend, we first turn on the lights and observe the angle of the indicator. When the price is in an uptrend, the indicator is inclined in the upward direction (i.e. rising from left to right). Think of it like a plane taking off 🛫.
The price also falls within the upper band and the middle band. In an uptrend, the price does not get to the lower band. A good instance is depicted in the image below
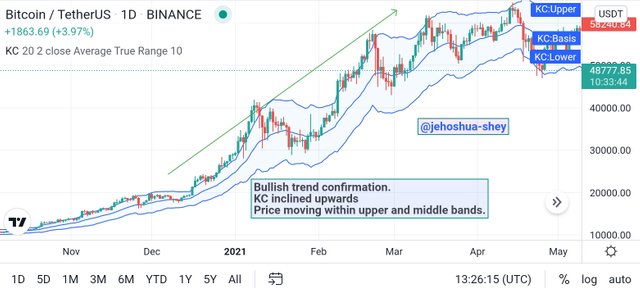
From the image above, we see the Keltner Channels (KC) is inclined upwards and the price is trading within the upper and middle bands. During this bullish or uptrend period, the price does not touch the lower band but stays well above it.
Clearly this is an uptrend and it can help traders to maximize the benefits of such a season.
DOWNTREND CONFIRMATION WITH KELTNER CHANNELS
Using the Keltner Channels to confirm downtrend, we also have to first turn on the indicator and observe it's angle. When the price is in a downtrend, the indicator is inclined in the downward direction (i.e. falling from left to right). Think of it like a plane landing on the tarmac 🛬.
The price also falls within the lower band and the middle band. In a downtrend, the price does not get to the upper band. A good instance is depicted in the image below
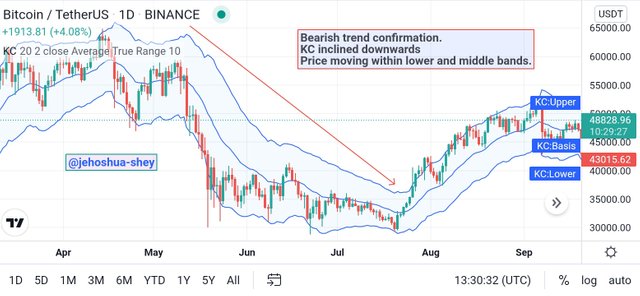
From the image above, we see the Keltner Channels (KC) is inclined downwards and the price is trading within the lower and middle bands. During this bearish or downtrend period, the price does not touch the upper band but stays well below it.
Clearly this is a downtrend and it can help traders to maximize the benefits of such a season as well as minimize the losses.
SIDEWAYS MARKET ON KELTNER CHANNELS
Assuming the price literally goes sideways and you want to see how it looks on a Keltner Channels, how will it look like?
Well, you're right.
There's not going to be an angle with the indicator. It's just going to line straight to the right in the x axis. There's also going to be a fully vertical price movement, the price will trade from the upper to the lower band. A good instance is depicted in the image below.
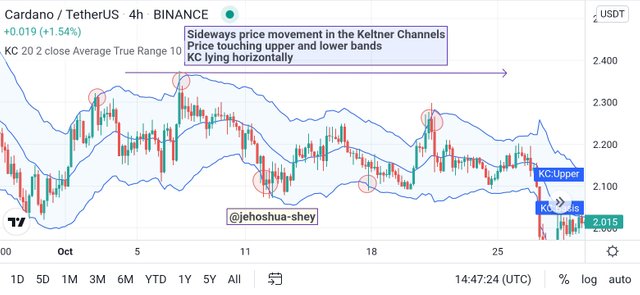
From the image above, we can see that the indicator is relatively straight along the x-axis. The price also touches the upper and lower bands within that period. This shows a sideways market and helps the trader to maximize the benefits of such a season.
COMBINING 200MA AND KELTNER CHANNEL
Combining indicators have always been the safe play when doin technical analysis. It helps to strengthen signals and also filter out fake signals. Using the Keltner Channels and the 200MA can be a very potent combination for deciphering and confirming market signals.
When using these two, here are the signals to look out for
For an Uptrend, Keltner Channels should be above the 200MA
For sideways price movement, the 200MA should be found within the Keltner Channels
For a downtrend, Keltner Channels should be below the 200MA.
Let's apply the 200MA in each of the previous instances depicting Keltner Channels in ranging and trending markets.
UPTREND
Below, we apply the 200MA to the BTCUSDT 1D bullish chart shown earlier to confirm the Uptrend.
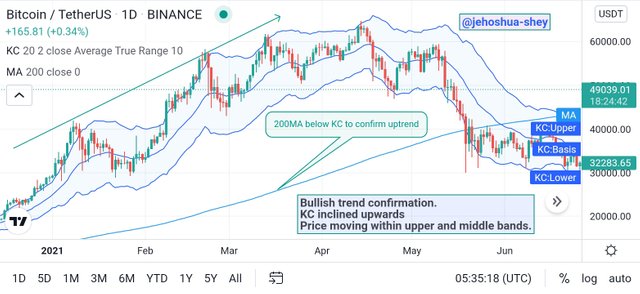
Here, we see that the Keltner Channels is above the 200MA for a bullish trend, confirming the bullish trend.
DOWNTREND
Below, we apply the 200MA to the BTCUSDT 1D bearish chart shown earlier to confirm the downtrend.
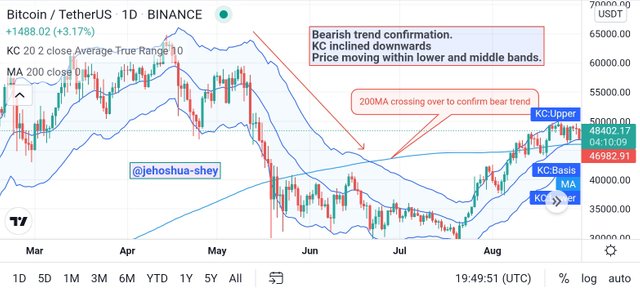
Here, we see that initially the Keltner Channels is above the 200MA for a bearish trend. However, as the trend progresses,the 200MA crosses above the Keltner Channels such that the Keltner Channels went below the 200MA, confirming the bearish trend.
SIDEWAYS PRICE MOVEMENT
Below, we apply the 200MA to the ADAUSDT 4H bullish chart shown earlier to confirm the sideways price movement.
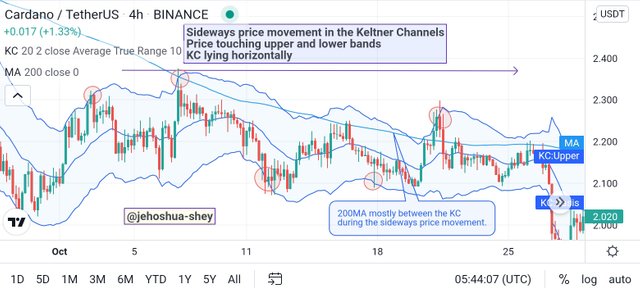
Here, we see that initially the Keltner Channels is above the 200MA for a bearish trend. However, as the trend progresses,the 200MA crosses above the Keltner Channels such that the Keltner Channels went below the 200MA, confirming the bearish trend.

Q.5. What is Dynamic support and resistance? Show clear dynamic support and resistance with Keltner Channels on separate charts. (Screenshots required).

Sometimes, support and resistance is not straight forward. They might happen in a diagonal form and in such cases, they are referred to as dynamic support and resistance. Dynamic support and resistance usually occur in a ranging market or a market where price is trading sideways.
As was illustrated earlier, such market can be clearly outline by a combination of the Keltner Channels and the 200MA. Here also, price touch both the upper and lower bands of the Keltner Channels. The upper band of the Keltner Channels serves as resistance while the lower band serves as support.
Let's take the following instances below to illustrate dynamic support and resistance.
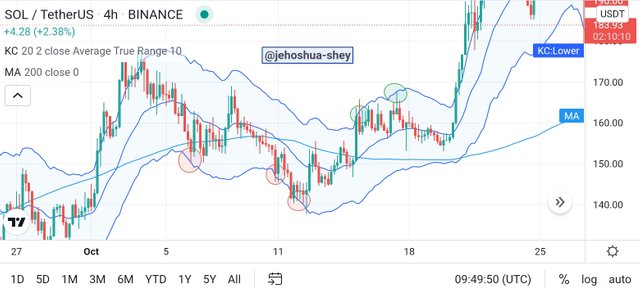
The image above is a 4H SOLUSDT chart where the price traded sideways for a considerable period of time. We see the lower band act as dynamic support for the price and is respected as such at the red-circled points.
Also, the upper band acted as dynamic resistance for the price during the ranging period and was respected as such at the green-circled points.
Let's consider another instance below.
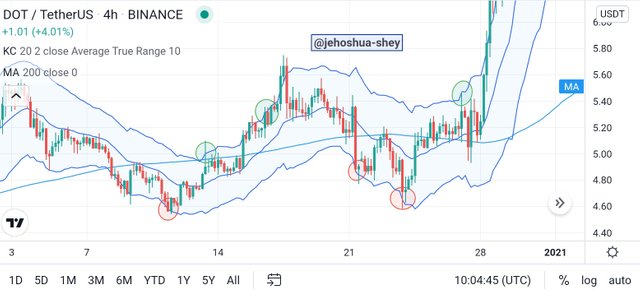
The image above is a 4H DOTUSDT chart where the price also traded sideways for a considerable period of time. We see the lower band also act as dynamic support for the price and is respected as such at the red-circled points.
Also, the upper band acted as dynamic resistance for the price during the ranging period and was respected as such at the green-circled points.

Q.6. What's your understanding of price breakouts in the Crypto ecosystem? Discuss breakouts with Keltner Channels towards different directions. (Screenshots required).

In crypto trading, when we're not talking about resistance and support, we're talking about breakout. Resistance and support are point the price tends to be unable to cross, upward and downward respectively.
When price is unable to cross above a point, it's called resistance and when it's unable to cross below, it's called support.
If after numerous attempt, the price finally breaches the resistance and support point, it's called a breakout. If price breaches a resistance point, it's called a resistance breakout. If price breaches a support point, it's called a support breakout
BREAKOUT WITH KELTNER CHANNELS
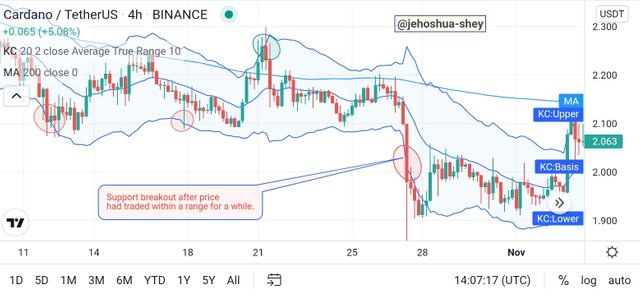
When using the Keltner Channels, we can see that sometimes, after the price has traded within a range for some it breaks out in the upward or downward direction.
For an upward or resistance breakout, the price rises above the upper band as shown in the image below
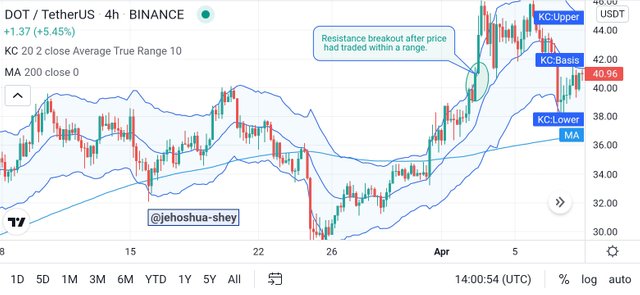
While for a downward or support breakout, the price falls below the lower band as shown in the image below

Q.7. What are the rules for trading breakouts with Keltner Channels? And show valid charts that work in line with the rules. (Screenshot required).

When trading breakouts with the Keltner Channels, we need to carefully study the movement of price against the upper and lower bands as well as the middle bands.
For resistance breakout, we study the movement of price against the upper and middle band while for support breakout, we study the movement of price against the lower and middle bands.
The rules are stated below.
RULES FOR TRADING RESISTANCE BREAKOUTS USING KELTNER CHANNELS
Wait for a clear breakout above the upper band. The price for the period (i.e. the candle) should close above the upper band.
Allow the price to return and respect the middle band as support.
Allow the price to also form a resistance above the upper band and then give a space of 3 or 4 candles before making an entry.
Stoploss should be below the EMA line or middle band at the entry point.
For take profit, proper trade management should be applied. A healthy risk to reward ratio should serve, i.e. 1:1, 1:2, or 1:3 depending on trader's choice.
Consider the 1D SOLUSDT chart below for a typical instance of trading resistance breakout using Keltner Channels.
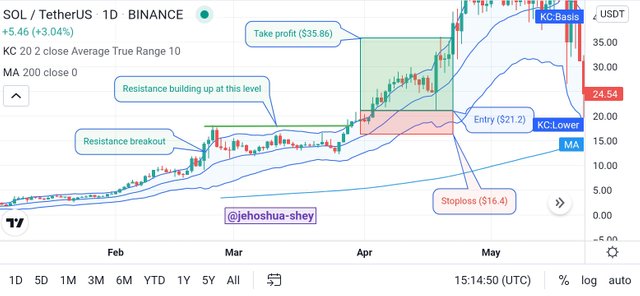
In the instance above, first, we see a resistance breakout North of the upper band then we see a resistance formed above the upper band with the middle band or EMA line respected as support.
After confirming this, we allowing a space of about 5 candles before making an entry. Stoploss was set below the EMA line at entry point and take profit was boldly set at a rail to reward ratio of 1:3.
As can be clearly seen, our take profit was hit.
RULES FOR TRADING SUPPORT BREAKOUTS USING KELTNER CHANNELS
Wait for a clear breakout below the lower band. The price for the period (i.e. the candle) should close below the lower band.
Allow the price to return and respect the middle band as resistance.
Allow the price to also form a support below the lower band and then give a space of 3 or 4 candles before making an entry.
Stoploss should be above the EMA line or middle band at the entry point.
For take profit, proper trade management should be applied. A healthy risk to reward ratio should serve, i.e. 1:1, 1:2, or 1:3 depending on trader's choice.
Consider the 4H ADAUSDT chart below for a typical instance of trading support breakout using Keltner Channels.
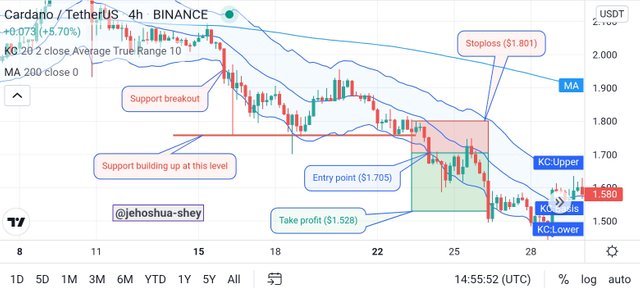
In the instance above, first, we see a support breakout South of the upper band then we see a support formed below the lower band. For sometime, the middle band or EMA line respected as resistance but later it was breached.
Price however came down to our support below the lower band and we took advantage of the next support breakout below the lower band to make our entry. Stoploss was set below the EMA line at entry point and take profit was boldly set at a risk to reward ratio of 1:2.
As can be clearly seen, our take profit was hit.

Q.8. Compare and Contrast Keltner Channels with Bollinger Bands. State distinctive differences.

These two indicators are similar but there's a major difference that also ripples into other differences. Below, their similarities are first listed, then their differences.
SIMILARITIES BETWEEN KELTNER CHANNELS AND BOLLINGER BANDS
Both are made up of three bands namely upper, middle and lower bands.
Both can measure volatility of prices.
Both can be used for trend confirmation.
Both are envelope based indicators.
DIFFERENCES BETWEEN KELTNER CHANNELS AND BOLLINGER BANDS
| Keltner Channels | Bollinger Bands |
|---|---|
| Uses ATR to calculate upper and lower bands | Uses standard deviation to calculate upper and lower bands |
| Uses an exponential moving average as it's middle band | Uses a simple moving average as it's middle band |
| Uses a multiplier | Uses an offset |

Q.9. Place at least 4 trades (2 for sell position and 2 for buy position) using breakouts with Keltner Channels with proper trade management. Note: Use a Demo account for the purpose and it must be recent trade. (Screenshots required).

So for this task, I placed for trades using the Keltner Channels. 2 sell trades and 2 buy trades. Of the 4 trades I made, only one hit the stoploss while 3 did hit the take profit. That's 75% win rate. I'll outline the details of these trades below.
Trade 1
SHIBUSDT 15 mins.
I placed a buy trade on the SHIBUSDT pair after getting the necessary signals.
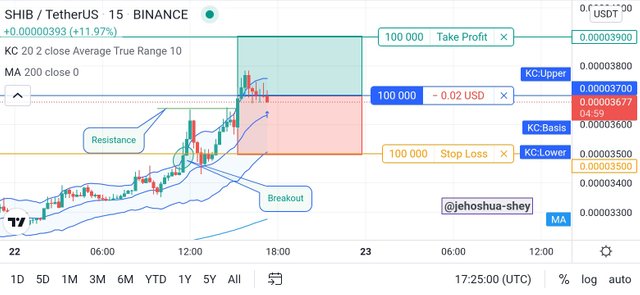
I waited for a close above the upper band and also for a formation of a resistance thereafter with the middle band seemingly respected as support. Some candles later, I entered the trade.
Unfortunately, this trade hit stoploss.
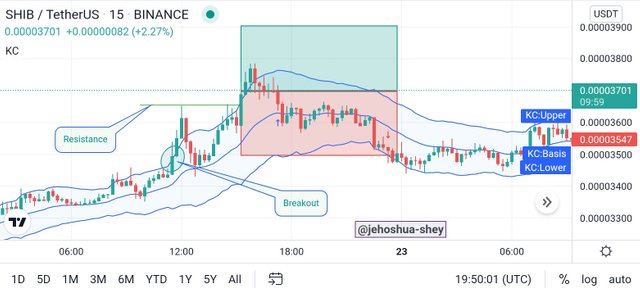
Proof of demo trade
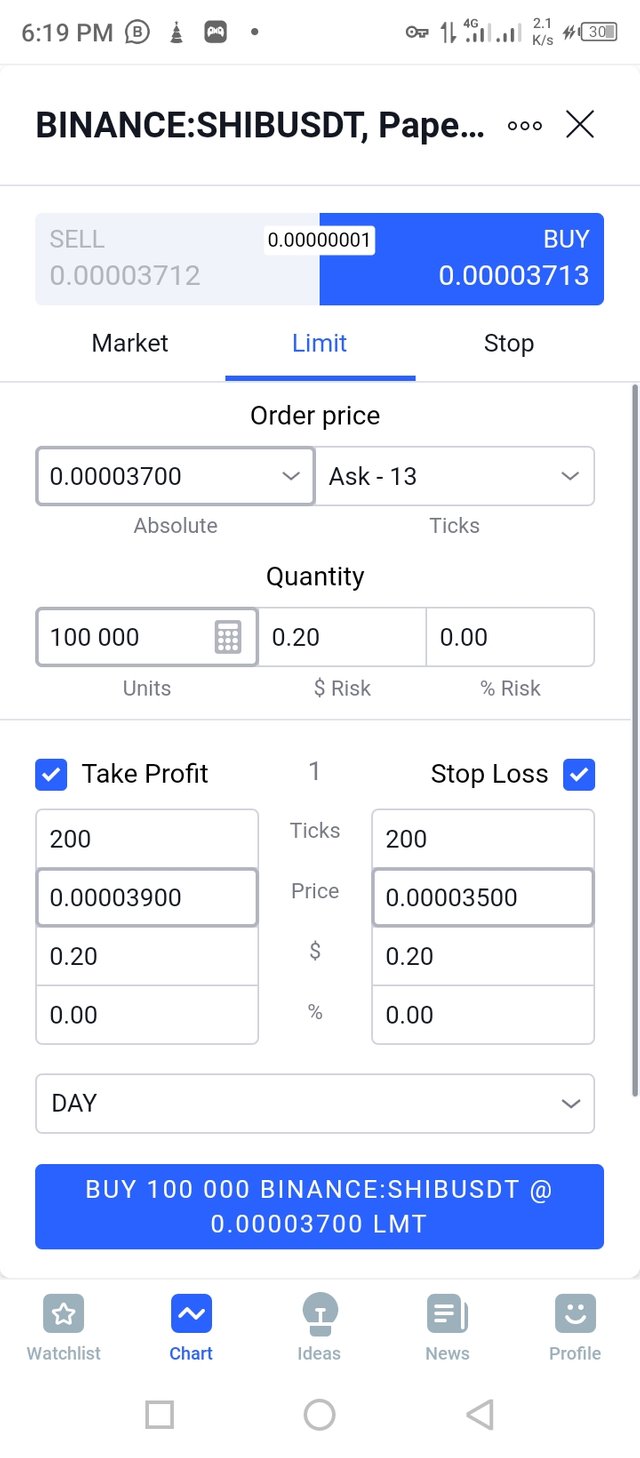
Trade 2
C98USDT 1 hr.
I placed a buy trade on the C98USDT pair after getting the necessary signals.
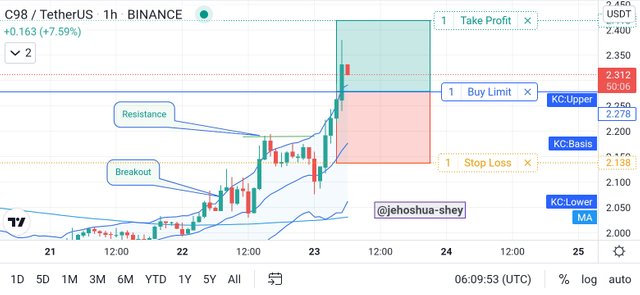
I waited for a close above the upper band and also for a formation of a resistance thereafter with the middle band seemingly respected as support. Some candles later, I entered the trade.
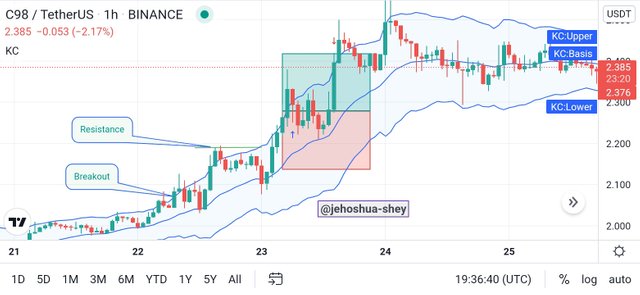
Shortly after, this trade hit my take profit.
Proof of demo trade
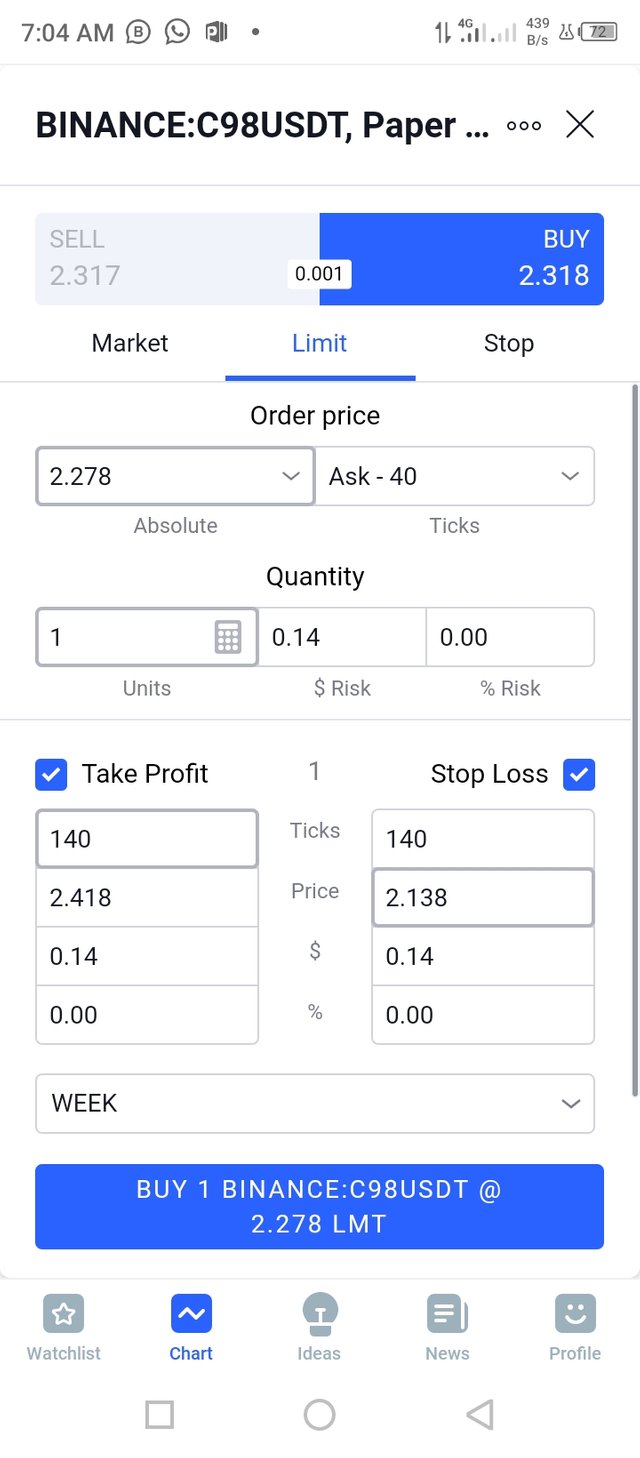
Trade 3
DARUSDT 15 mins.
I placed a sell trade on the DARUSDT pair after getting the necessary signals.
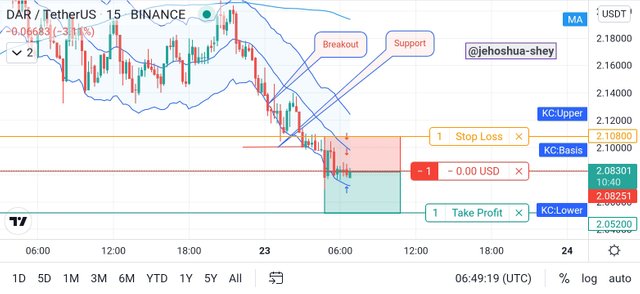
I waited for a close below the lower band and also for a formation of a support thereafter with the middle band seemingly respected as resistance. Some candles later, I entered the trade.
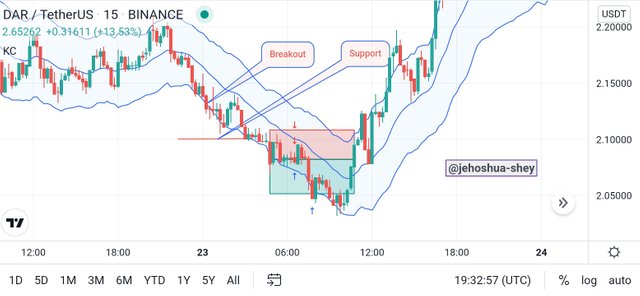
After some time, this trade hit my take profit.
Proof of demo trade
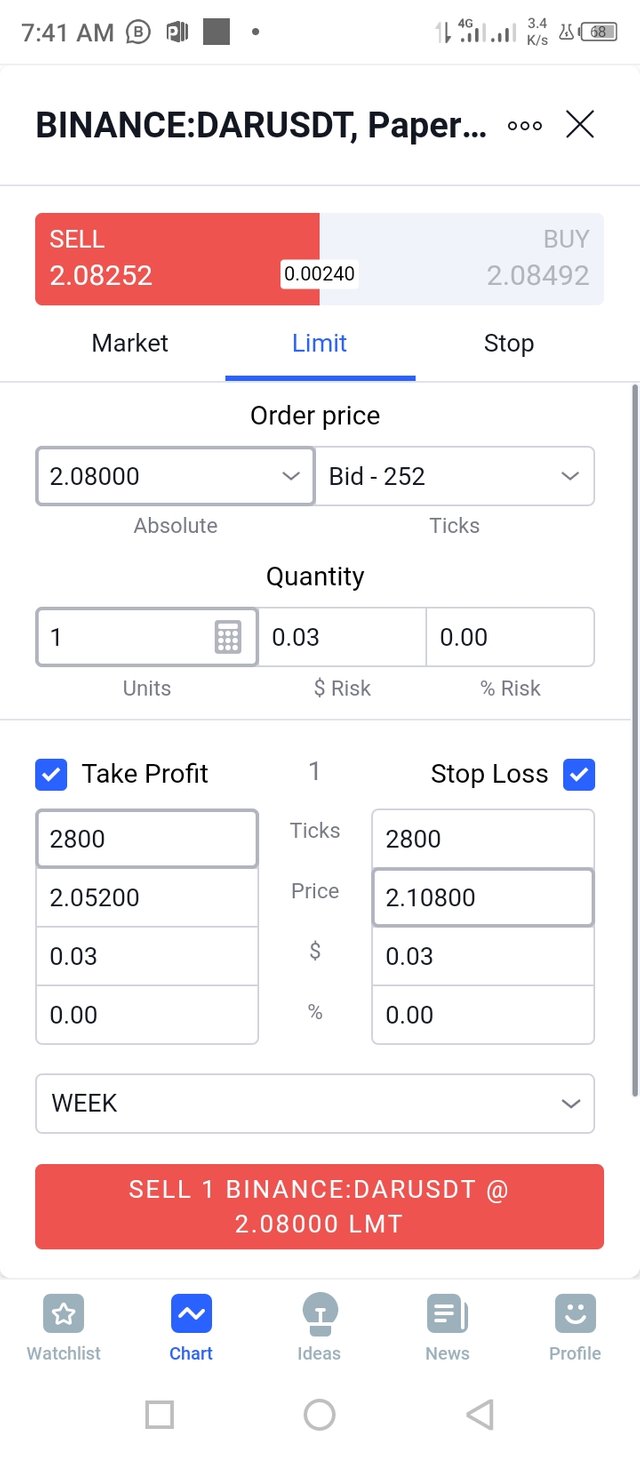
Trade 4
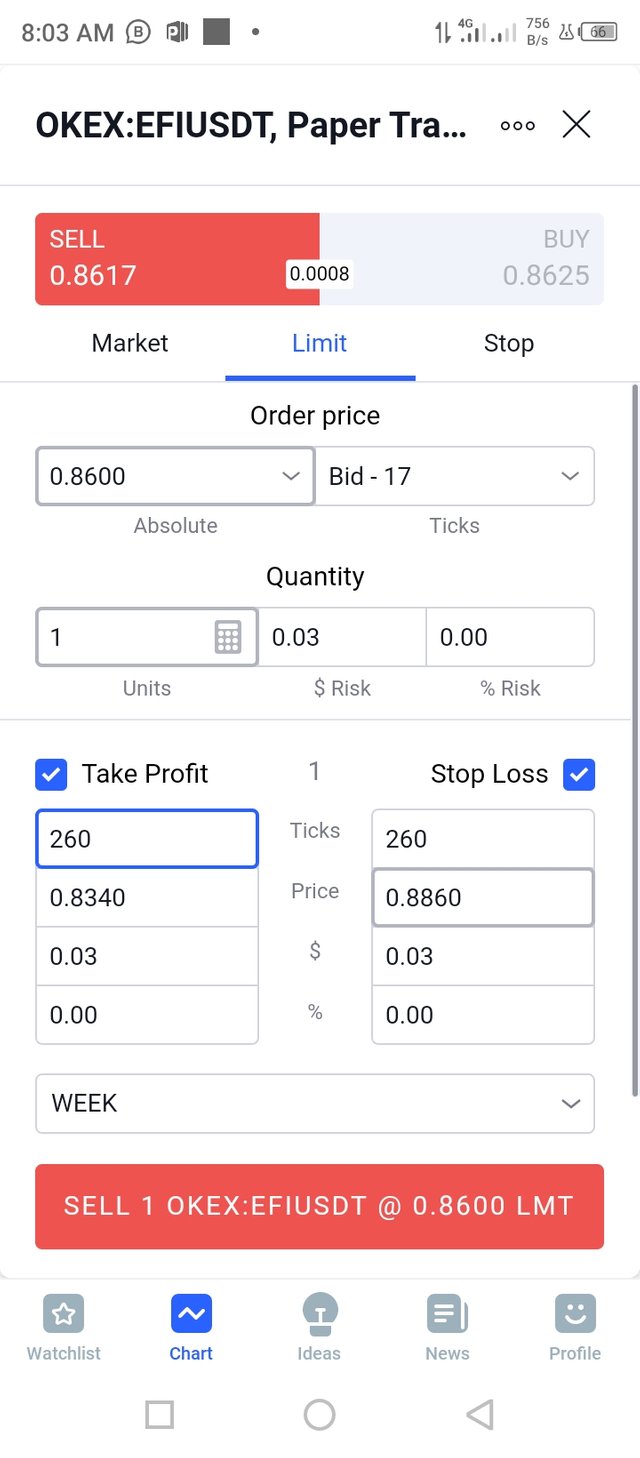
EFIUSDT 15 mins.
I placed a sell trade on the EFIUSDT pair after getting the necessary signals.
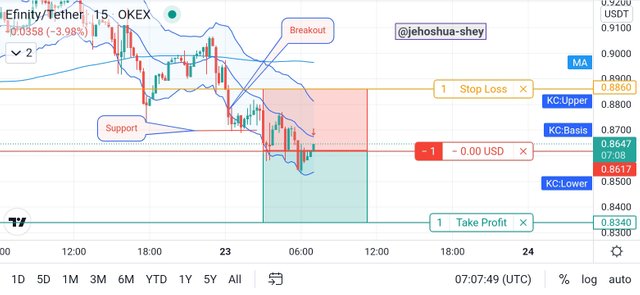
I waited for a close below the lower band and also for a formation of a support thereafter with the middle band seemingly respected as resistance. Some candles later, I entered the trade.
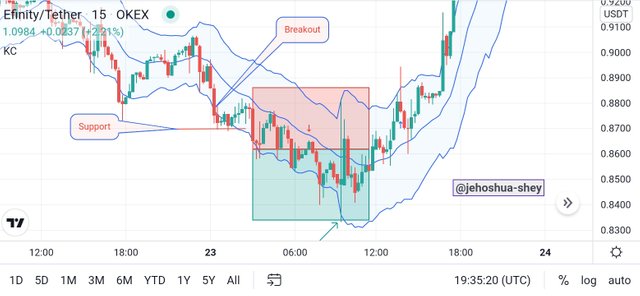
After some time, this trade hit my take profit.
Proof of demo trade

Q.10. What are the advantages and disadvantages of Keltner Channels?

The advantages of using the Keltner Channels are as follows:
Measuring volatility: With this indicator, a trader can have a clear overview of what the volatility of the market is like. This can enable the trader make correct calls.
Easy trading strategy: One advantage I see with the Keltner Channels indicator is the easy to use strategy involved with it. The signals can be clearly deduced and as was seen in my demo trades, have a good win rate.
Dynamic levels: Not many eyes can figure out a dynamic support or resistance. However, with the Keltner Channels, it becomes very obvious. With this dynamic support, the trader. An have an important perspective on the market.
The disadvantages of using the Keltner Channels are as follows:
Dependence on other indicators: This indicator is vest used in conjunction with other indicators to avoid stories. When used alone, there can be very serious setbacks ranging from wrong signals to late entry. It is better used together with another indicator.
Late signals: While the strategy is easy to use, this indicator gives a signal sometimes very late which might lead to a loss. This can however be averted or avoided of it's used together with other indicators.
Settings: One of the drawbacks of this indicator is in the settings. If it's not appropriately set, there can very serious flaws and the settings depends on the experience of the trader and their trading style. Beginners might find it difficult to apply working settings to optimize the benefits of this indicator.
Thanks for reading
Cc:
@fredquantum
