Crypto Academy / Season 3 / Week 5 - Homework Post for @imagen
It was a wonderful lecture by @imagen and I am glad to be participating in week 5 of season 3
I am @kelechisamuel and this is my homework post
Choose at least 1 of the following cryptocurrencies.
- Axie Infinity AXS
- Chilliz CHZ
- Cardano ADA
- VeChain VET
Make an investment of $ 12 or more. Show screenshots of the process. Why did you choose this cryptocurrency? What is it Market Capitalization? What is it position in the cryptoasset rankings? What is the objective of the project behind this coin? Who founded this coin? Show the roadmap. What is the specific purpose of the cryptocurrency?
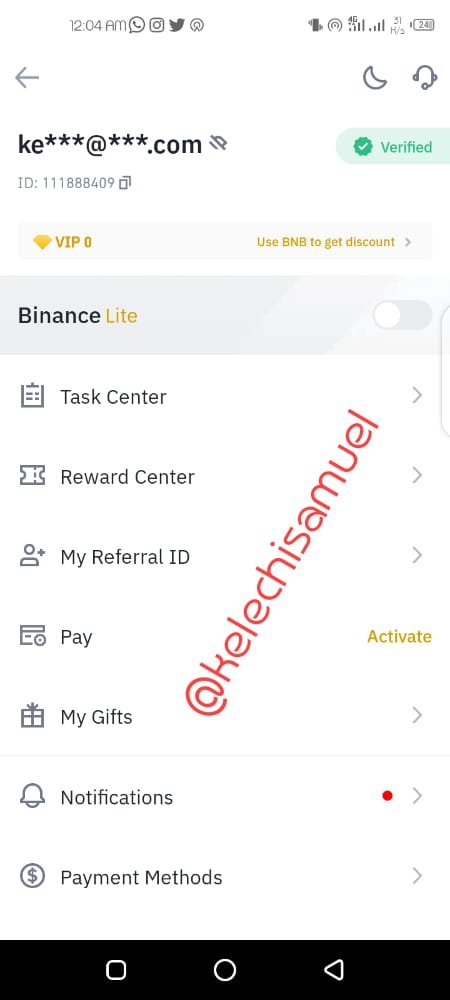
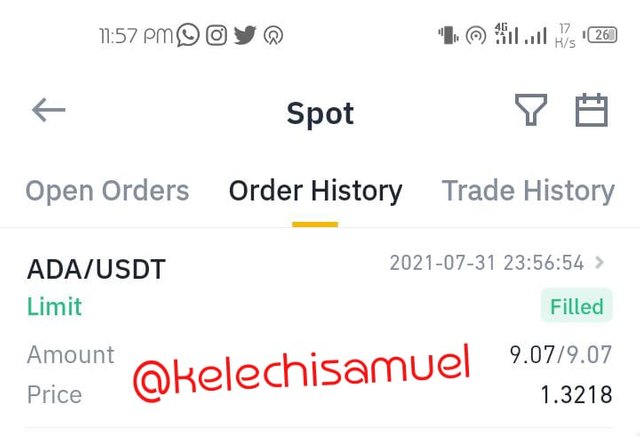
I start by purchasing $12 worth of ADA using binance
- Ensure you have a verified binance
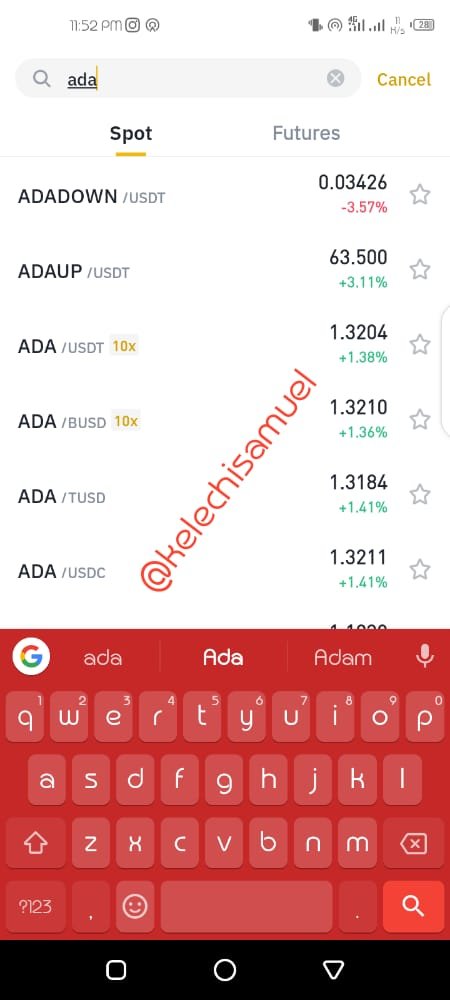
- Click on market and search for the ADA/USDT pair
- Click on buy
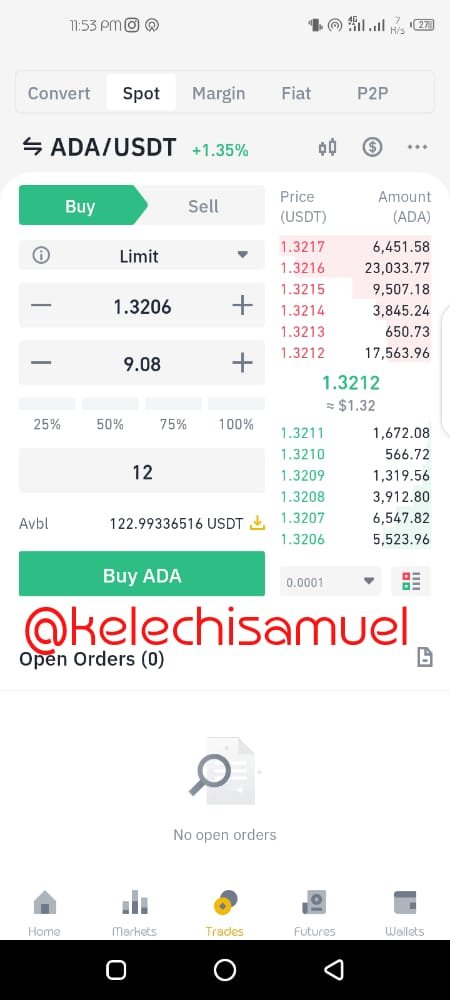
- Input the amount of usdt you are willing to exchange for ADA for me I am buy $12 worth of ads
- Click buy
And cross-check the order
See screenshots below
Why did you choose this cryptocurrency
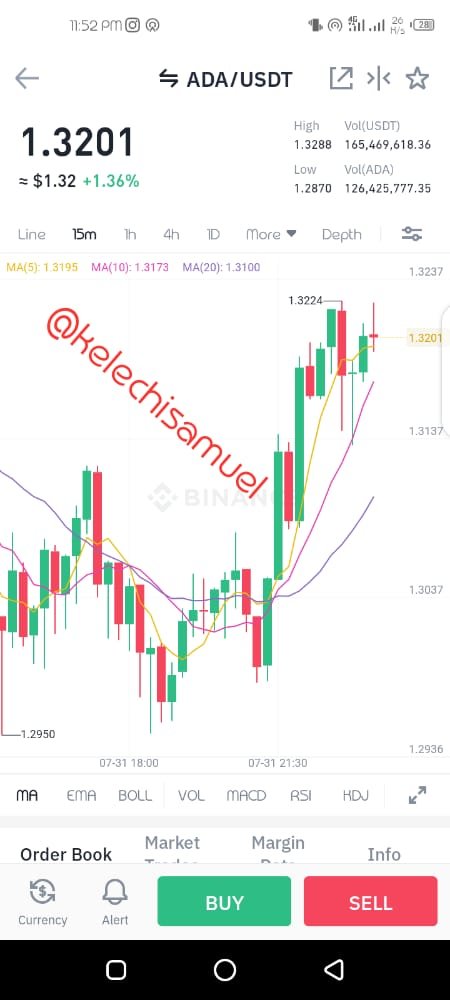
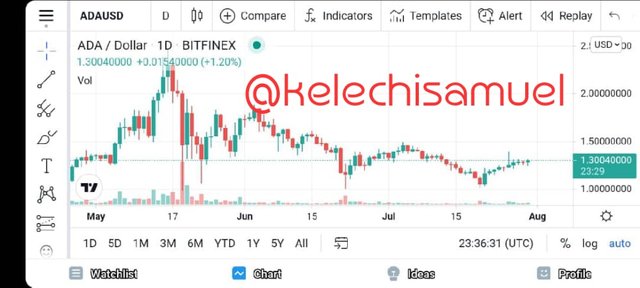
I choose ADA for my purchase, considering the prospective quality of this coin who was clinging the $2 mark before the bearish trend came up and since then it has staggered along the trends both Bullish and bearish but even more bearish now as we see in the ADA graph below
Deductively, we could foresee an increase in the value of this asset, so long as we can hold on.
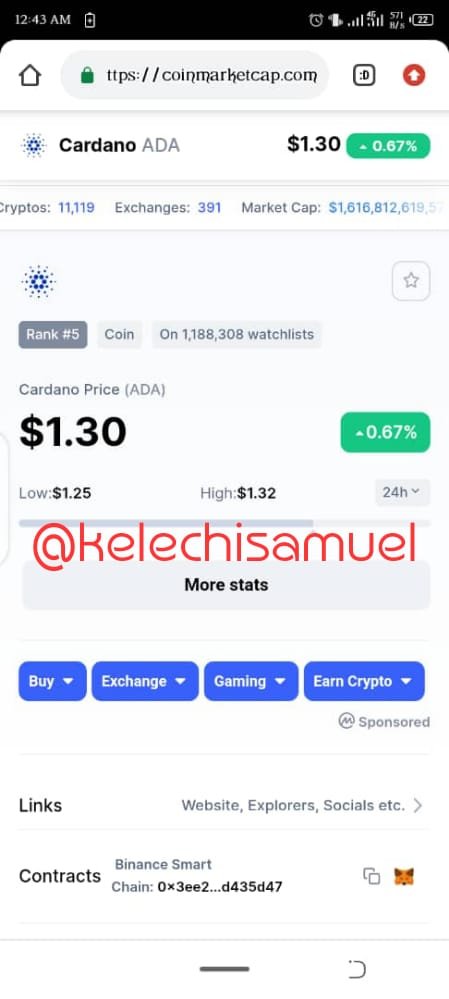
- The ADA too, has its market capitalization as a whooping, $41,731, 000,000 as of the Coin market statistics
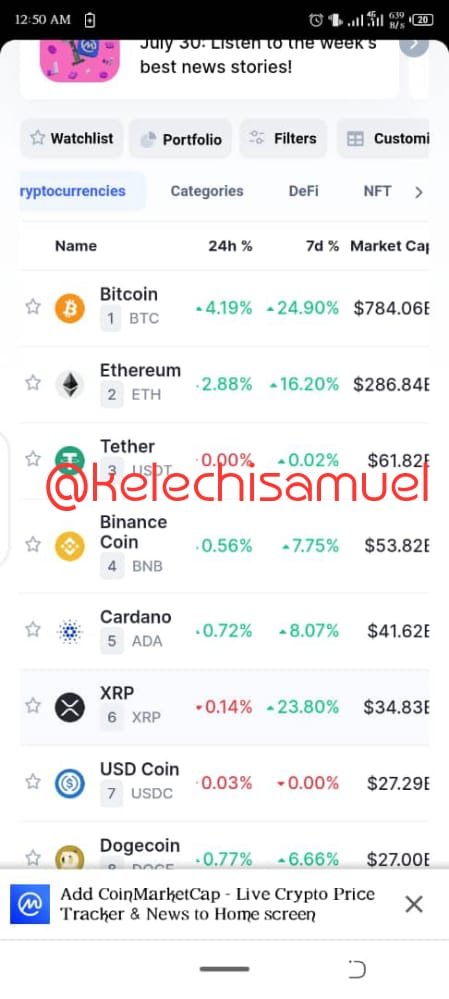
- The ADA (Cardano), hits fifth in the crypto assets rankings as it hits a high market cap surpassing that of Ripple, and the rest as we see in the picture
- The purpose of the project behind the Cardano could be seen as to ensure provision of more relaxed and sufficient ecosystem for crypto assets. The project also mean to solve scaling issues, reducing network charges unlike other expensive blockchains, and also increasing efficiency at the same time
- One of the Co founders of the Ethereum blockchain, named Charles Hoskins on could be seen as the inventor of the ADA cryptocurrency
- The road map of Cardano is doled out in five levels including the :
Bryon :This one signifies the first release of the ADA crypto network even naming it's symbol after one of the first computer programmers and the fact that users of this network, could store and send coins in their official wallet
Shelley :This was the second level of the road map introducing staking to the platform and making it simple
Guogen : this was the basis of the introduction of smart contracts, to the blockchain including the use of fungible and non fungible tokens
Basho :This level brought solutions to scalability issues and provision of sidechains in the network movement
Voltaire :
This is the last level of the road map and shows the governance feature of it, giving measures of how to even vote while using the tokens even
Finally, we see the specific purpose of the ADA to be the handling of Scaling problems, network high fees, and slow transactions of other blockchains. This blockchain is meant to make these features better and more efficient in the blockchain
Explain in your own words what the "Evening Star" pattern consists of. What is its hit rate?
Here we would be considering what the Evening Star pattern consists of
The Evening Star Pattern :
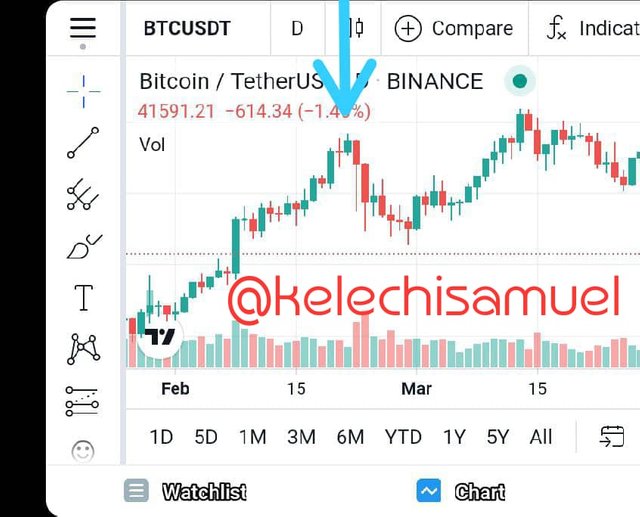
The Evening star Pattern, is a bearish candlestick Pattern, consisting of three candlesticks that is a green /Bullish candlestick, a Doji or small Candlestick then a a
red /bearish Candlestick.
The Evening star pattern, are related with Bullish trends in charts, and clearly stating the arrival of the bearish trend. This evening star could be seen as a relative opposite of the morning star as the former entails bearish trends and the latter does for Bullish trends
How does this pattern form?
The candle lengths would always differ, since market volume and movements would be different daily so the Evening star pattern has no definite length
We should also take note that this chart pattern gets its form after three periods (days)
The first day, brings up the bullish candle showing the holding of the market by the traders and buyers.
Prices are utmostly/persistently increased here too making assets, so enticing to buy, then the second candle shows a little more movement of prices ie they increased a bit further.
The final candle, the bearish one, shows the regain of the market by sellers and opens up at a price below the former day's own and closes at a price relatively low compared to the first day
Explain in your own words what the pattern "Abandoned Baby" consists of. What is the percentage correct?
The Abandoned Baby pattern consists of several features and we're going to be looking at this sub topic here :
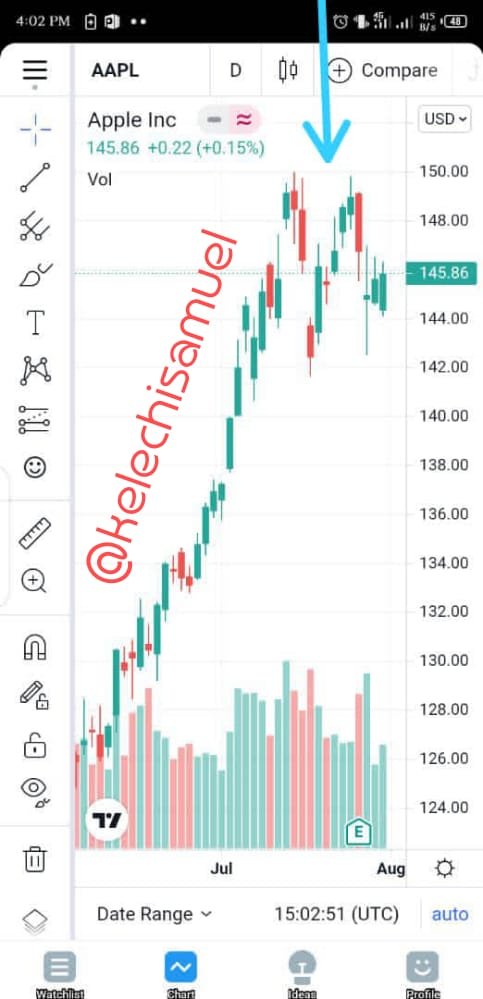
Ths abandoned baby pattern, shows a unique chart pattern based on showing market trend reversals and they are reputed to have strong market prediction records.
This pattern has two kinds which are the bearish and the Bullish abandoned baby pattern
This patterns are made of three candlesticks, which alternatively shows the different trend levels in the market example, in the bearish abandoned baby pattern there is a Bullish candle accompanied by a Doji before finally a bearish candle and in the Bullish abandoned baby pattern, there is a bearish candle, a Doji and a Bullish candle afterwards.
We could also deduce, the likeness of the Abandoned baby pattern, to that of Morning and Evening Star patterns since they adopt similar measures in their market trends
The Abandoned baby chart pattern could be about 65-70% correct in forecasting of market movements
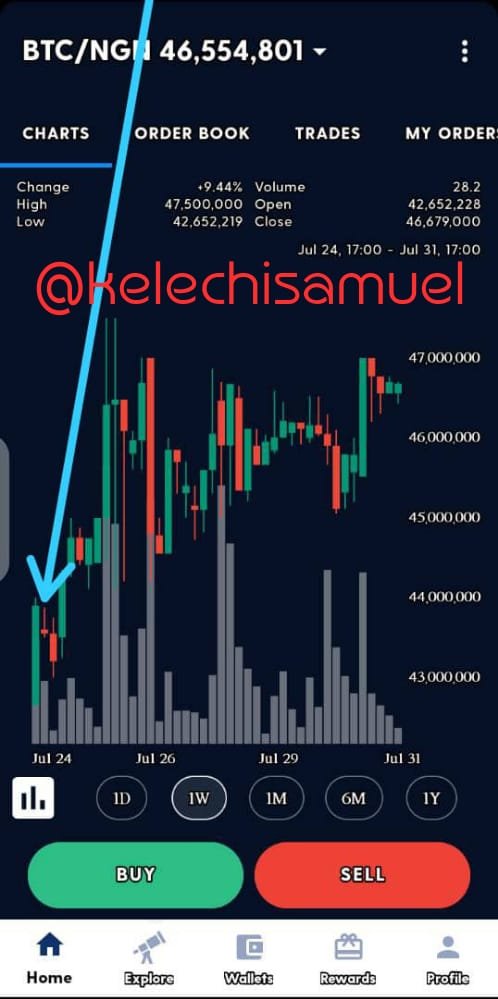
Perform analysis for 3 and 7 recent calendar days for Bitcoin Do you identify any patterns? Show screenshots
So, I placed for Bitcoin to get to #45,000,000 this week in the next three days after it was at #43,500,000 at the beginning of the week and we see the bearish candle at the beginning of the week making me expectant for a Bullish trend this week and we can see Bitcoin at #45, 000,000 just the next day after i did some analysis and my prediction was perfect
*We can also take cognaisance of the Bullish Engulfing Candlestick Pattern here as one of the patterns in this chart
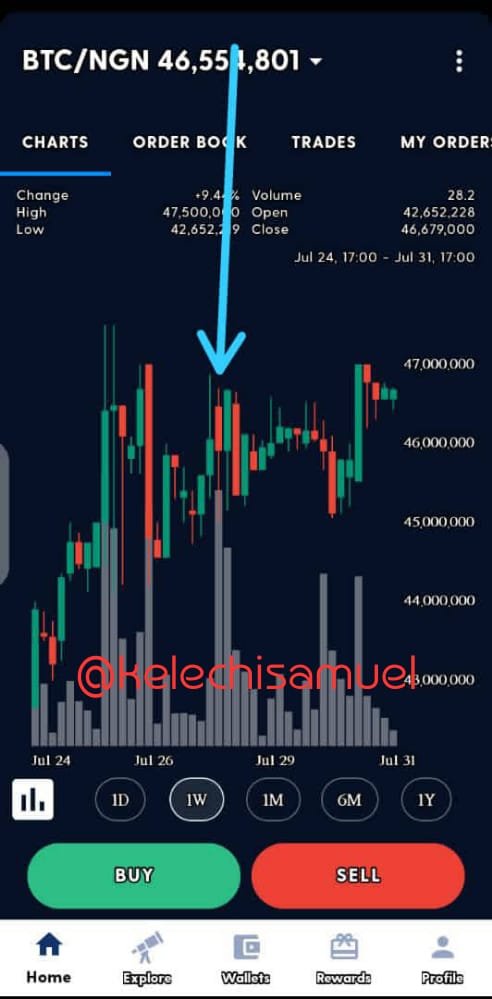
*More so, one of the determining factors that made me predict the rising was the Ethereum presence of the Hammer stick candlestick that came down showing that the market went really down and that there's a near Bullish trend
Here we see the effects of these charts in reasoning before trade decisions are made
CONCLUSION
It was an amazing experience and I am glad that I participated in this homework post added to the joy that I made a little gain on the ADA which I bought
Thank you for reading my post
Best regards
@imagen
Gracias por participar en la Tercera Temporada de la Steemit Crypto Academy.
Felicitaciones, realizastes un gran trabajo.
Continua esforzandote y espero seguir corrigiendo tus asignaciones.