Steemit Crypto Academy Season 3-Week 7 Trading Crypto With Average Directional Index (ADX) Indicator
It was an interesting lecture and I will be going straight to the homework post, I am @kelechisamuel and this is my entry
Discuss your understanding of the ADX indicator and how it is calculated? Give an example of a calculation. (Screenshot required)
We have talking about indicators that assist traders in their profit making scheme in the crypto market. Because that is the aim of trader. And if you are not making profit in the market than you are absolutely making loses, and maybe it be huge losses. Today we want to discuss about an indicator that can assist to your dream world. This Indicator is called Average directional movement index which when abbrevaited, it is called the ADX. ADX is an indicator invented by a man called jay weilder in the 1970s. the ADX was intended to provide a rating for any market by how much it is trending. you can simply say that the ADX is used to determine the strength of a trend. The ADX plots 3 lines on the chart , the first of which is the ADX, this ADX value oscilate between 0 and 100. In ADX, the higher the value of the ADX, the more the market is trending and the lower it is, the less the market the market is trending. this is a criteria in determining the strength of the trend the market or the behavior of the trend can can be determined by the figures below,
IF ADX is lesser than 25: in the situation, the value of the ADX can fall between 0 to 20 ,at this point, there is no trend, the market is consolidating.it is not adviseable to make any trade at this time
If ADX is lesser than 50 but greater than 25: in this situation, the value of the ADX rranges from 26 till 50. these values signifies a strong trend. at this point the market is forming a new trend either upward or downward.
If ADX is lesser than 75 but greater than 50: In this case, the value of the ADX ranges from 50 to 75, this is just like the peak of the trend. these values connotes a very strong. it can be a good region to enter an order but you should watch closely at the supportt or resistance, which can detect a possible reverse.
If ADX is lesser than 100 but greater than 75: in this case, the value of the ADX ranges from 75 to 100. it is usually called the extremely strong trend. it rarely happens in the martket and at this point there could be a possible reversal.
the chart below clearly define the ADX for an upward trend and also shows a ranging market at the same time. we can clearly see that \when the ADX is above the 25 value which is the most important value because this is the beginning of a trend.
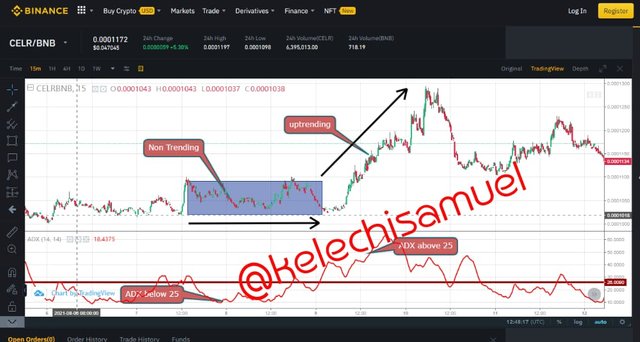
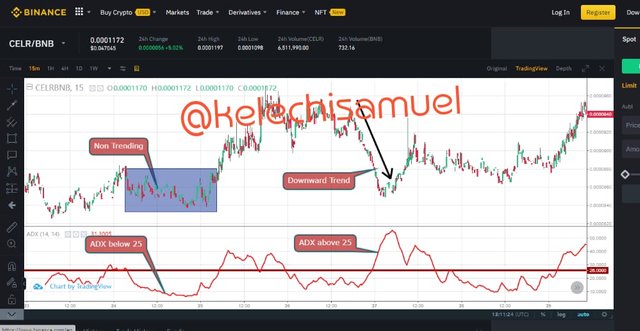
tthe chart below shows that ADX can be also used to determine the downtrend of the market,in a 15mins time frame using CELR/BNB, you can clearly see that the if ADX is below 25, it simply means that there is no trend and if it is above the 25 value the trend begin
Another important feature of the ADX is that it can be calculated which it has formulars. the ADX indicator is made up of different component, these are the ways to calculated them.
firstly, we should know the meaning of the following.
DMI+ = Positive Directional movement
DMI- = Negetive Directional Movement
DMI + = ( highest point of the day - Current highest point)
DMI-= (current low point - lowest point of the day)
TR = True Range
this is the large value btween the high and low of the day
TR= (|ab-nm|;|ab-cd|; |nm - cd|)
ab = Current High
nm = Current Low
cd = Previous Close
Calculation of the DI + and DI-
DI+ = DMI+ /TR
DI- DMI-/TR
Smooth Result = Dx
DX= 100 x ((DI+ ) - (DI-)) / ((DI +) + (DI-))
ADX = sum of n [((DI+ ) - (DI-)) / ((DI +) + (DI-))] / n
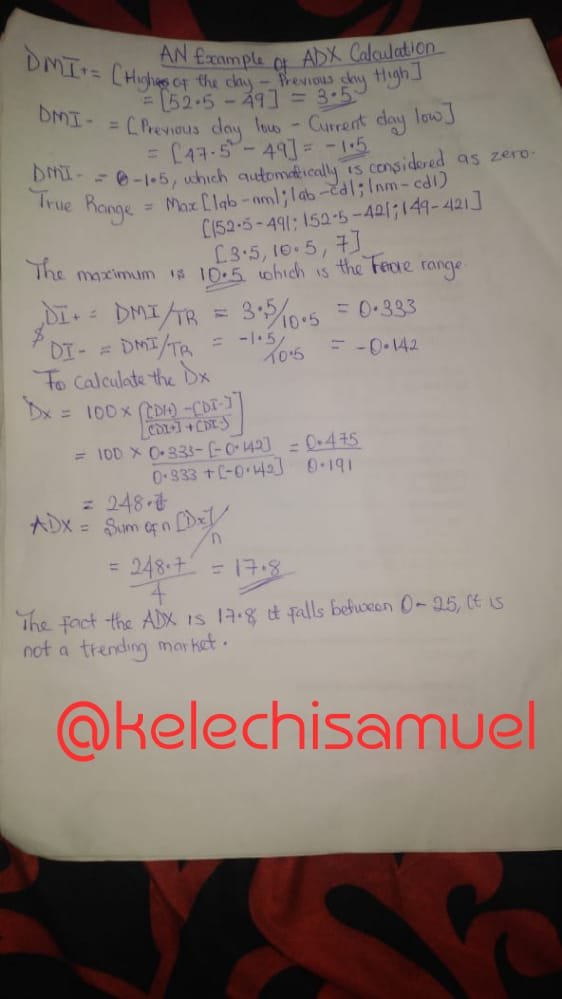
An example of an ADX Calculation
it is show in the picture below
but with following parrameter we can achieve this
Period = 14
Current High = 52.5
Current Low = 49
Previous High =45.5
Previous Low =47.5
Previous Close =42
How to add ADX, DI+ and DI- indicators to the chart, what are its best settings? And why? (Screenshot required)
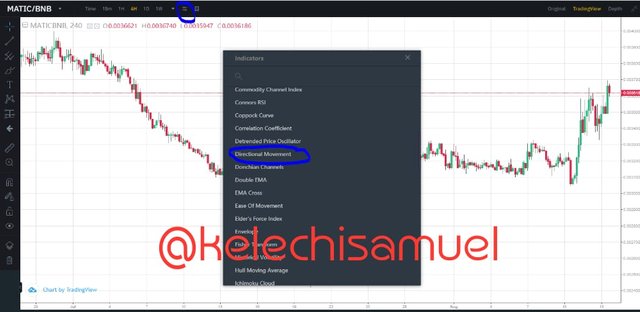
Let's begin the steps on how to add the ADX, DI+ and DI- indicators to the chart
- if you have tradingview app and you already have an account with them or else you create a free account with them and you can also use the any browser of your choice
- select the particular pair you want to trade
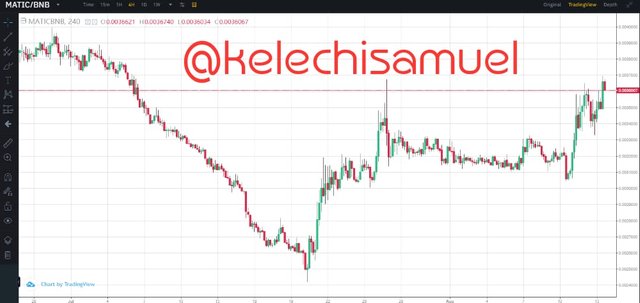
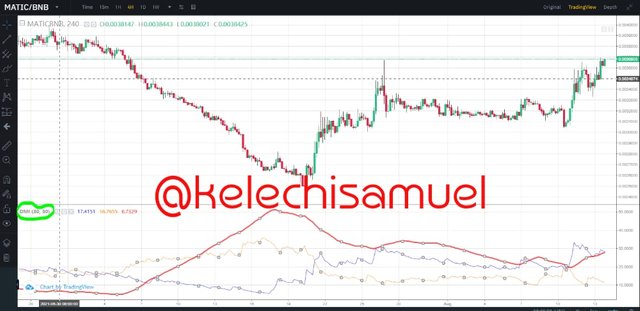
this is how the trade should look, MATIC/BNB in a 4 hours time frame chart
- Select the inicator icon at the top
- then select the Directional movement
after selecting the directional movemnt,
it will show like this below having the ADX, AI=,and the DI-
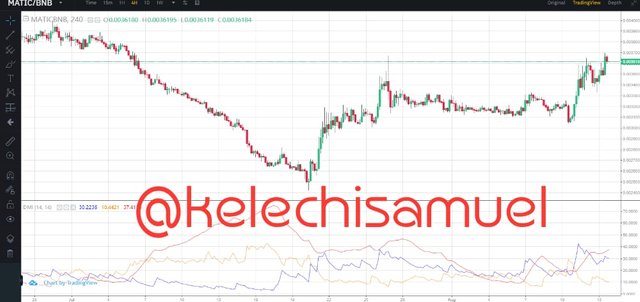
lets use configure the chart and edit the chart to siut our use.
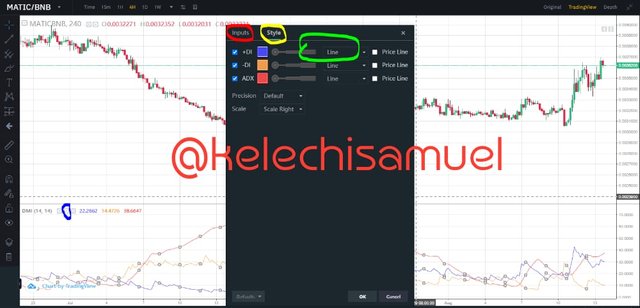
- you can see the small blue circle,that is where you should click first, because it is the format button, after clicking it
- this small windows will open
- the side that has Style, comprises of line ,colour, line sytle and line size
- if you select that side that has red colour, then this box down will appear,
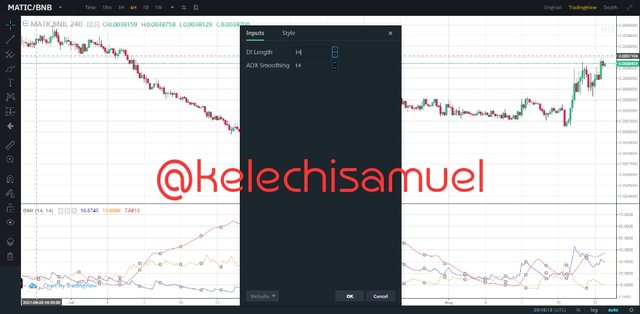
the window box will appear,in this place you can change the number of the DI+/DI-and the ADX to any suitable number of your. Adding the ADX and DI+/DI- was so siimple following this steps. You should note that the indicator reads form the last indicated number of candleson the chart, for instance if you want to set it to a period of 14, ADX will focus on the last candles on the charts. the default setting of ADX. the best settings should have a period of 30 periods,reason being that the average price movement is facilitated, most times they are relaible though that it can be a lagging indicators. This chart below
shows that the is original, you can that plce i green circle and
Do you need to add DI+ and DI- indicators to be able to trade with ADX? How can we take advantage of this indicator? (Screenshot required)
ADX alone is a wonderful indicator but it has a lot of limitations that can make you lose a lot of money. And also you know that ADX shows only the strength of a trend, which is not enough to be a profitable traders. This is just like eating only one food and expecting it to give us the 6 classes of food in large quantity, it will not work. This is where the introduction DMI which simply means Directional movement index, The DMI shows the direction of the market. Combining the Strength of a trend and the Direction of a trend is great for a successful trader. The DMI is made up of two lines, the Positive Directional Movement which is indicated as (DI+), and in the editing colunm, you can edit it, to suit you. The next line is the Negetive Directional movement which is also indicated as (DI-), the settings can be toggled to suit the person that wants to make use of it. The (DI+) shows the upward direction of trend while the (DI-) shows the downward direction of the trend.
Whenever the (D+) is above (D-), this means the there is much upward presure compared to the downward pressure, but when (D-) is above (D+), this means that the downward pressure is higher than the upper pressure, which simply means that the sellers are dominating the market. So the combination of the ADX, (D+), and (D-), is like eating the balance diet in one meal, You have an indicator that is telling you the strength of the trend and the other that is telling you the direction of the trend
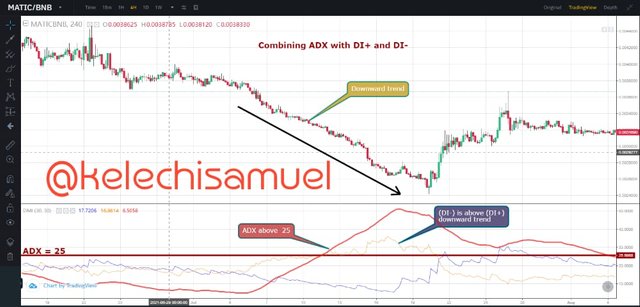
While using the ADX, you should not forget to check the type of Trend, if the trend falls 0-25, you should remember that the market is ranging and not trending, you should avoid such trade at all cost, but if it falls falls between 25-50, you enter the order because there is a trend present and don't forget to use the DMI to know if you to sell or buy.if the range of the ADX falls between 50 -75, the trend is very strong, you can still enter but if it reaches 75 and above, you should be expecting a reversal, but make sure to use it with the DMI ., The two combo are perfect with the following examples of mine. In this chart below, in the pair of MATIC/BNB in a 4 hour timeframee, we can see how to combine the ADX and the (DI-) and the (DI+) for a selling market, this combination is very good. The ADX is Above the the 25 mark which is an indication of a strong trend and the DI- is above the DI+ which is also an indication of a strong sell or a downward trend
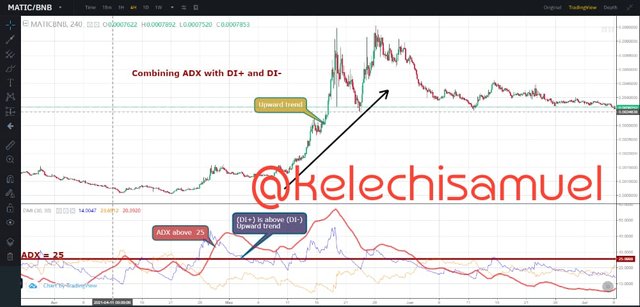
In the pair below, MATIC/BNB in the 4 hour time frame, we can also how the combination od ADX with DI- And DI+ can be used in the buying market to enable us gain our maximum profit, Firstly, we can see that the ADX is 25, which is an indication of a strong trend while the DI+ is above the DI-, which is also a good indication of an upward trend.
What are the different trends detected using the ADX? And how do you filter out the false signals? (Screenshot required)
ADX can also be used to detect the trends, the following are the types of trends that exist in the market.
Weak Trend: Weak trend occurs when the is between 0 - 25, in this case scenerio, there is no trrend, what happens at this region is a ranging or consolidating market.the market price tends to obey the support and resistance line, they usually form a rectangle, and at this point there is a struggle between the buyers and the seller for who to dominate the market, anyone that wins begins a new trend. the Chart below beyween MATIC/BNB in a 4 hour timeframe, will further explain the weak trend, the ADX is below the 25 value.
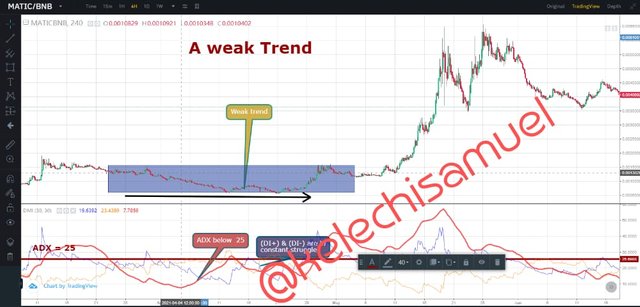
Most weak trend occur between 0 to 20, between 20 and 25 a new trend is mostly formed, but it is adviseable to wait.
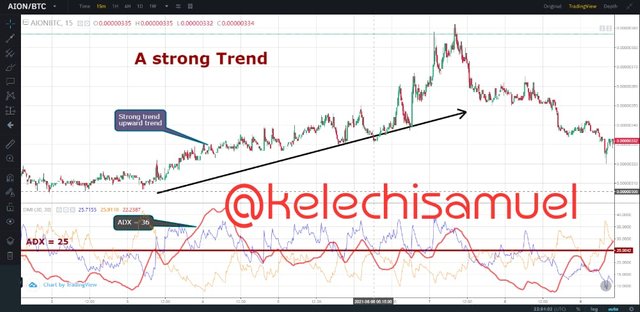
Strong Trend: Strong trend occurs between the 25 to 50 range, it is a strong trend, and we can follow the trend, after carefuuly looking out forr every criteria needed to ensure this a good point to trade. the trend is mostly regular, it is either heading upwards or downward. In the pair of AION/BTC, in the 15mins time frame, we can see how ADX was at 36 and the trend was upward and strong, this a good to enter your order.
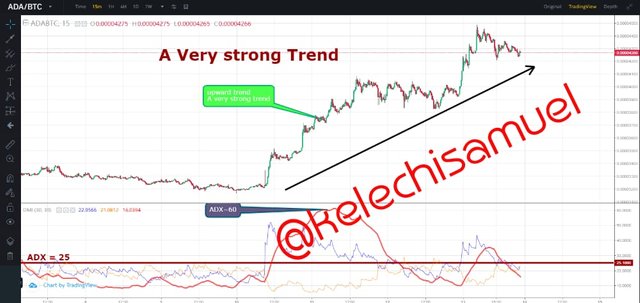
Very strong trend: this occurs when the ADX is at 50 -75 range, the trend is said to be very strong. At this area you should be expecting a trend reversal because the trend don't stay too long at this areas. From the ADA/BTC pair, in the 15mins time frame,you can a very strong trend, But also make sure to look at your DI- and DI+ too before executing any trade.
Extreme strong trend: this occurs between 75 to 100, once the price reaches this region you should be also expecting a reversal of the price . it show how volatile the market is.
And how do you filter out the false signals?
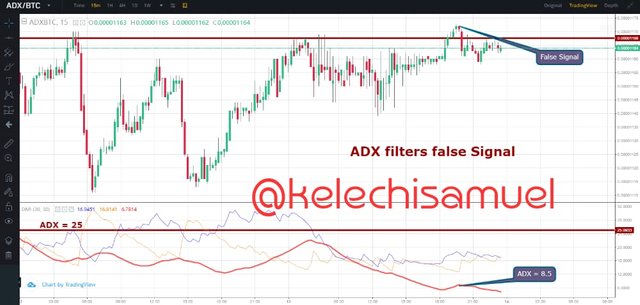
this is another feature that makes the ADX a very good indicator, it helps to filter false signals. i know by now, you will surprised to hear this, let me quickly explains how it does that. ADX filter false signals in this simple way. Having drawn the support, resistance or the trend the serves as a boundary, the is where the ADX comes into play, if the break out that wants to occur, happens between the area of 0-25 of ADX, you should know that it is a false signal, you should toatlly avoid it or you might lose a huge sum of money
From the chart below, the pair of ADX/BTC in a 15mins time frame, you can see a false signal that formed but with the help of the ADX which measures it value to be 8.5, makes it a false signal.
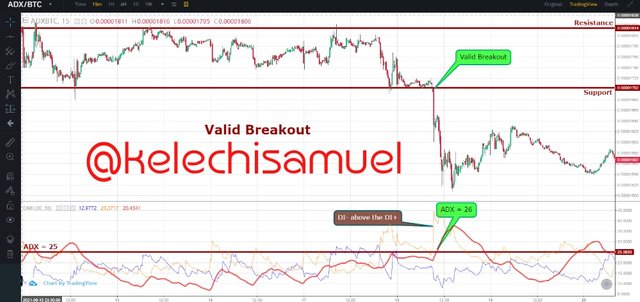
Explain what a breakout is. And How do you use the ADX filter to determine a valid breakout? (Screenshot required)
Breakout is simply what every traderr wants in the market, braekout ensures more profitts if caught at the right place, breakout is simply when the price of the market moves above or below a pre-defined area that a trader must have created with the help of a support, resistancce or even a trendline. A trader that makes to buy after the breakout goes above the resistance and wait for the price to break the resistance and once he comfirms the breakout he will execute the trade. but if it is seller that want to trade with the breakout, he goes to to the support line and wait for the price to break the support and after confirmation, he execute the order, Now with the help of the ADX, you can now validate if it is a breakout or fake out. ADX deos this by this method, If the breakout occurs at the when the ADX is above 25, then the breakout is said to be valid.
with the following examples, let check the validatibility
in the below of the pair ADX/BTC in a 15mins timeframe, after mapping our support and resistance, the breakout occurred at when ADX was at 26, it is a valid breakout, that is why the breakout was valid
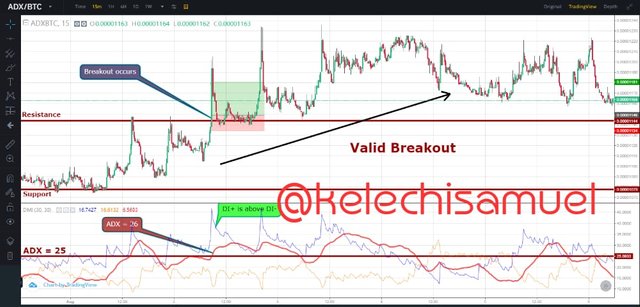
In the pair of ADX/BTC below with a time frrame of 15mins, the breakout at the support level occurred when the ADX was at 26 level, this shows that it is valid breakout. it is as simple as it is.
What is the difference between using the ADX indicator for scalping and for swing trading? What do you prefer between them? And why?
Different type of traders uses the ADX indicator, such as scalpers and swing traders.
Scalpers uses ADX indicator, by determining the trend on the small time frame like 30mins to 5 mins and you should know important support level and resistance levels.Scalpers uses the ADX indicators with other indicators such as Average True Range Indicator, you should also set the period to 100, to overlook the disturbance of the trend in the market. Using the DI+ and DI- know the direction , this method fits well in small time frame like 1 mins and 5mins timeframe.
Swing traders also uses ADX indicator, as a swing trader it is important to be disciplined provided you are a medium term trader, and you should not insert too many indicators. other indicators that can work with ADX as a swing traders are as follows, ichimoku indicator and pivot point, which helps you to determine the entry points . this strategy works well in a larger time frame like the 4 hours tiimeframe and the daily time frame.
I prefer being a scalper. because of it doesn't involves so much time,it is very fast to get your profit and walk away.
Conclusion:
ADX is an important indicator in the market, it is used to determine the strenght of the trend, with the combination of directional movement index, which include DI- and DI+ , that helps determine the direction of the trend. The both indicators if combined, can be used to make real profit and it is relaible. the trend varies and ADX can be used to check the strenght of the trend, such variation include, if ADX =0 -25, this is a weak trend. if ADX = 25 - 50, this is a strong trend. if ADX= 50 - 75, this is a very strong trend. if ADX = 75 -100, this is a extremely strong trend.
ADX can also be used to filter false signal and determine the breakout of a current trend. also Different traders uses the ADX indicator, such traders includes the scalpers and the tthe swiing traders. ADX can also be combined with other indicators to make it work effectively, such indicators includes Ichimoku, pivot point, average true range and so many more.
ADX is a very nice indicator, it is easy to understand and easy to use,for you to be profitable trader, you should try using ADX.
Best regards
@kouba01