Crypto Trading with Moving Average -Steemit Crypto Academy | S6W2 | Homework Post for @shemul21
Hi all, In Today lecture professor @shemul21 make another interesting and very useful lecture about Trading With Moving Average.
It's very interesting and very useful to us for taking correct trading decisions.
Thank you professor for this amazing lecture.

Explain Your Understanding of Moving Average.
For making our Tradings easy and simple we apply a lot of indicators before taking our entry.
From this Moving Average indicator play a key role to determine Market trend, Identifying Entry and Exit points. Along with identifying Present Trends and Trend reversal, most traders apply this indicator on the chart.
We can also apply this indicator with any other indicator combination too.
Moving Averages represent the average price of an asset over that specific period.
For Example, if we apply 21 days moving average on our chart, then it calculates past 21 days average prices, they represent a single line chart to us.
Using this data we can do our trading very easily. Because it does not get any fluctuations based on present price action, it always follows the average price over specific periods.
That's why not respond shorten pumps and dumps, so there is a high chance to avoid fall in whales manipulation.
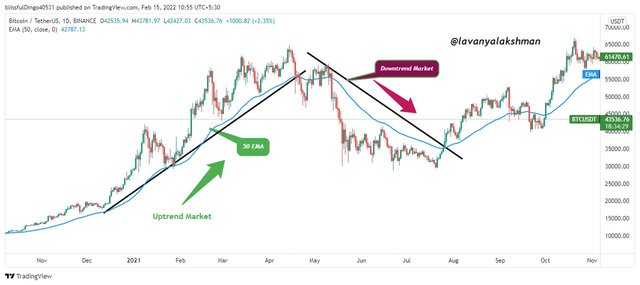
For example, here I choose BTC/USDT chart with 50 moving Averages.
Different types of Moving Average
At present in the crypto market, we have a lot of indicators for calculating our needed Moving Averages data. All work similarly but have a little difference in taking data and periods which they consider, along with their Mathematical Formula for greeting signals.
From this, these three Moving Average Indicators are famous and wildly used by a lot of traders.
Simple Moving Averages(SMA)
Exponential Moving Average(EMA)
Weighted Moving Average (WMA)
Now we try to understand the above three types in today post.
Simple Moving Averages(SMA):-
Simple Moving Averages generate a chart just calculating Average Price of an asset in that specific Period. Means just calculating the average price of our given periods, it generates a signal for us.
SMA respond very quickly for a lesser period, for longer periods it responds slowly.
Using this indicator we can analyse continuity of present trend , along with Market trend very easily.
Formula for SMA Is
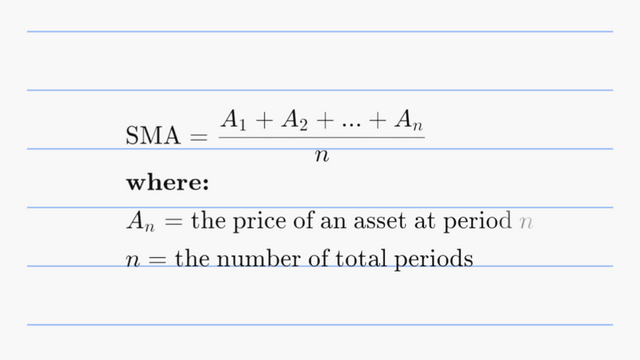
For example , if we apply 20 days Simple Moving Average on our needed chart then chart looking like as follow.
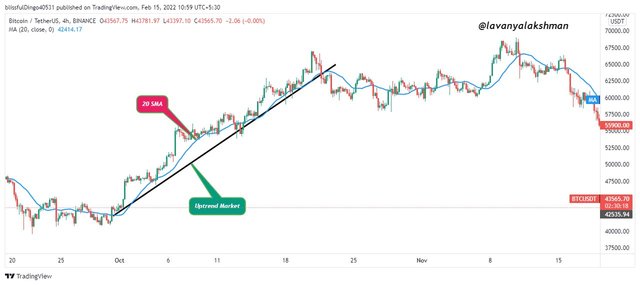
Just observing the above chart with SMA, we can identify Market trends and present Market situations very easily.
Simple Moving Average consider the closing price of an asset for generating a signal.
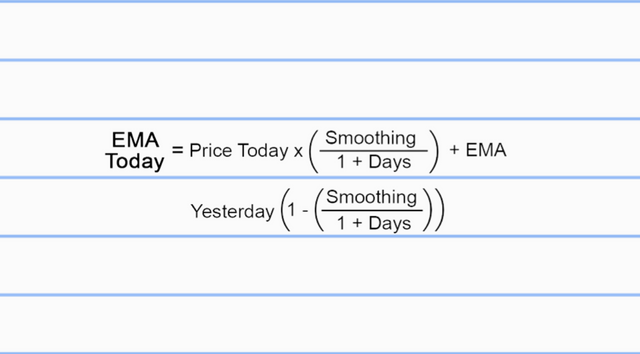
Exponential Moving Average(EMA)
Exponential Moving Averages are also one type of moving average. But it place More Weight and React faster to Present Price Action.
That's why it's also called an exponentially weighted moving average. It's similar to Simple Moving Averages but it places more weight on generating signal charts.
Most of the traders wish to use a combination of Simple Moving Averages and Exponential Moving Averages together to take their trading decision. This combination works well in Lower to higher time frames.
The formula for Calculating Exponential Moving Averages:-
For example , if we apply 20 days Exponential Moving Average on our needed chart then chart looking like as follow.
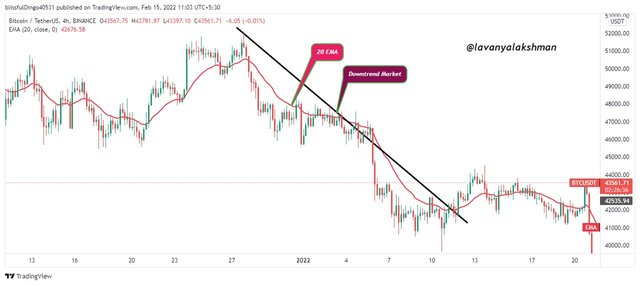
Just observing the above chart with EMA, we can identify Market trends and present Market situations very easily.
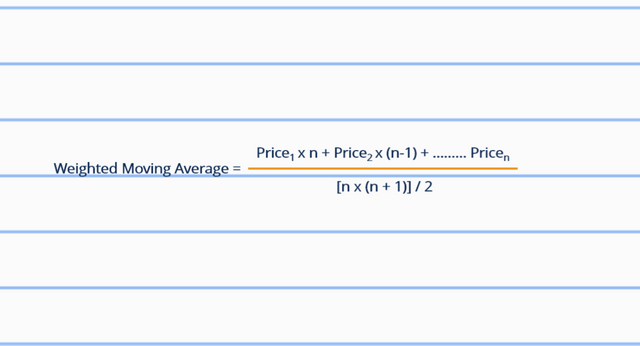
Weighted Moving Average (WMA)
Weighted Moving Average (WMA) is also one type of Moving average. Most Traders use this indicator for identifying Trad signal regarding when we give entry and when we exit.
It generates a signal based on placing more weight on present Price Action and less weight on past data.Using this indicator we can easily eliminate preset pumps and dumps I the market very easily.
The formula for Calculating Weighted Moving Averages:-
For example , if we apply 20 days Exponential Moving Average on our needed chart then chart looking like as follow.
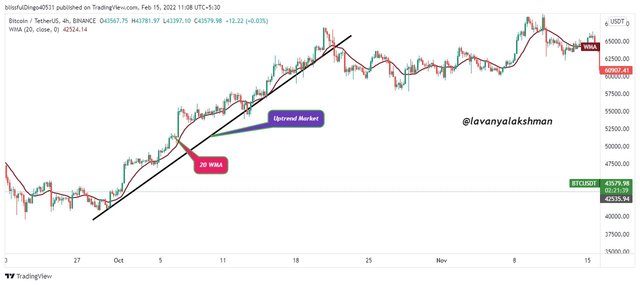
On observing the chart, we easily find out trade signals for our needs.
It also gives accurate signals in any time frame.
Difference Between EMA, SMA and WMA
Simple Moving Averages(SMA), Exponential Moving Average(EMA) and Weighted Moving Average (WMA) all look similar but they have a lot of differences while generating their signals. So before applying those on the chart we must know key differences between those.
| Simple Moving Averages | Exponential Moving Averages | Weighted Moving Averages |
|---|---|---|
| SMA Calculate Average Price of Over Period | EMA Calculate Current Price with Multiplier of smoothing | WMA place More weight on Present Price and less Attention On past Price |
| For Long Term Trading Needs SMA Is a good choice | For short term trading needs EMA Is the best one | It is very sensitive, so it acts as ideal for scalp and Short term trading needs |
| SMA generate an accurate signal with a higher time frame, so forecasting long-term price action, SMA Is a good Choice | EMA places more weight on Present Price action, so it generates an accurate signal for the Short term. So scalping and Short term trading needs EMA is Good Choice | WMA is generate accurate signal for higher and lower time frames. Because it place more weight on present price action and less weight on Past data. So we can apply this indicator for any time frame |
| SMA is lagging Indicator | It reach very faster according with Price action | EMA is More sensitive even for little Price Movement |
For better understanding those key differences between SMA, EMA and WMA , Here I add all those three indicators on chart.
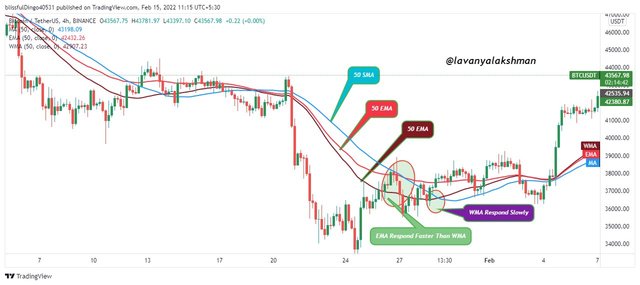
Just observe the chart, we can understand how those indicators follow Price Action.
Here Weighted Moving Averages react very faster than others even for small corrections in price action.SMA moving very lagging so it moving very slowly concerning price action. That's why it is a good choice for long term trading needs.
Coming Exponential Moving Averages it reacting close to price action. That's why it's a good choice for short-term trading needs.
But on applying all their moving averages together we can do profitable trades always. Because all those acts as Dynamic Support or Resistance based on market conditions. Along with easy to identify Market Trend and possibly to identify Our entry or exit points with the help of those.
Identifying Entry and Exit Points Using Moving Average.
For this illustration I used 2 Moving averages, on combining both I try to identify Entry and Exit points.
Here I apply Simple Moving Averages as 100 periods and Exponential Moving Averages as 20 periods.
With help of 100 SMA we can easily identify Present Market Direction,with help of 20 EMA we can easily identify Entry/Exit points very easily.
If Market in Uptrend, Price Action bust trade above 100 SMA, and it took 20 EMA as a support. In any market , Price action not go in straight forward,always taking small small correction it start moving upward direction.
In those dips are our buying opportunity, here 20 EMA act as Dynamic Support too.
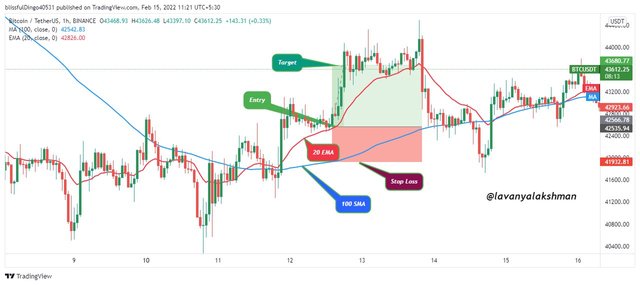
In the above example, after getting the bearish trend reserved, EMA starts moving SMA. On taking EMA support, the market starts moving upward direction.
Here stop loss would be just below 100 SMA. Because if price action break and move downward direction then it considers as Bearish Trend. We must exit our trade in that stage.
If Market in Downtrend, and moving below 100 SMA, then it's indication for Bearish Market, here EMA 20 act as a resistance. So here we can give our Sell Short entry when we get opportunity.
Here EMA and SMA act as Dynamic Resistance. Stop loss would be just a above 100 SMA. When price action again start moving above the 100 SMA, then we must close our short position. Because then after market may go other direction.
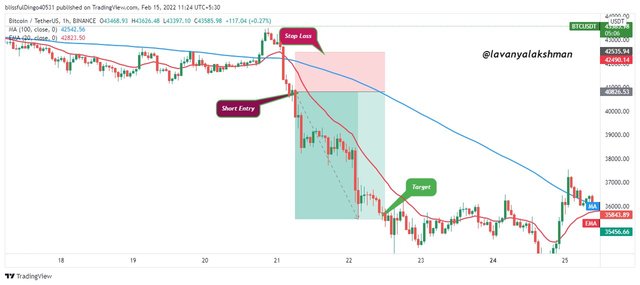
In the above example, we see when price action starts to move below 100 SMA, We get a bearish trend and 20 EMA act as Dynamic Resistance. When price action tries to break on that area, we can place our short positions there, but before taking potions must wait for one retest, then give entries only.
Don't hurry on taking a position, need patience for identifying the best entry /exit points.
Like that, we can identify Entry/Exit points, along with present trend and Trend reversals with help of Moving Averages very easily.
Understanding Moving Average Crossover.
Moving Averages Crossover strategy helps a lot for identifying Trend Reversals before it occurred on Market.
For this, we must use one faster Moving Averages with Slower Moving Averages. This combination gives a profitable signal always.
When faster Moving Averages crossover Slower Moving Averages then we get a Bearish reversal in the market. So soon we get Bullish Market so wait for giving Buy Long Entries. Here Stop loss would be just below Slow Moving Averages.
Similarly when Faster Moving Averages Moving Bellow Slower Moving Averages then we get Bullish Reversal in the market. So soon we get Bearish Market, so wait for getting the opportunity for placing Sell Short Entries. Here Stop loss would be just above Slow Moving Averages.
For understanding the Moving Averages Crossover strategy here, I apply 20 EMA with 50 SMA.
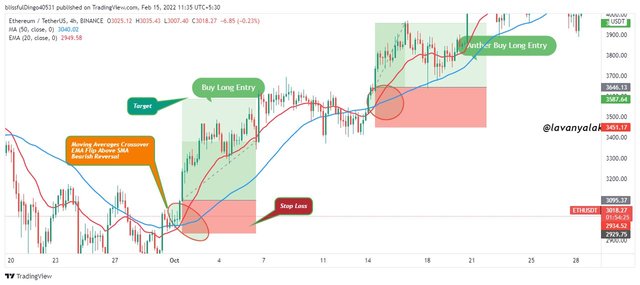
In above example when 20 EMA crossover above the 50 SMA, then it signal for bearish Trend reversal. So wait for confirmation before giving Buy Long Entry. And place stop loss just below 50 SMA.
In the same way we can also identify Bullish Trend Reversal.
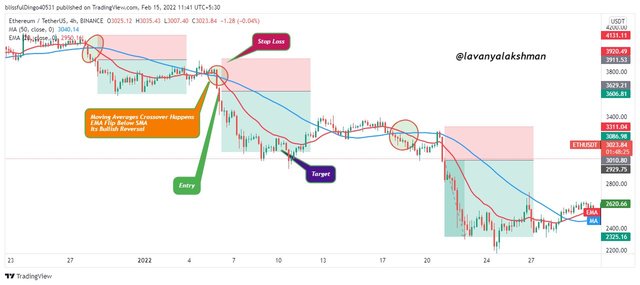
In the above example, when 20 EMA crossover below 50 SMA, then it signals for Bullish trend reversal. So wait for confirmation before giving Sell Short Entry. And place a stop loss just above 50 SMA.
Like that based on Moving Averages Crossover strategy we can identify Present market trends and trend reversals very easily. But those are valid in trending markets only, in the sideways market it generates false signals. So be cautious about doing trading with help of Moving Averages.
Limitations of Moving Average
Moving Averages are also one type of Indicator, so they generate signals based on past data only. So Indicator generates only assumes, not 100% guarantee signals. So trading based on those signals is not recommended, so be careful on taking your trading decisions based on it.
Moving Average Indicators are very useful for identifying Market Trend, Entry and Exit points. But it also has limitations. So before making decisions based on it, pls keep those limitations on your mind before giving entry.
Moving Averages generate signals based on selected periods. For example, if it gives Buy signal in a 1-hour time frame, it gives a sell signal in 4 hours time frame. So if traders do not select correct periods for their trading needs, then there is a high chance to get a false signal.
Moving Averages not respond based on present market conditions. So we can miss good opportunities if we trade based on indicators also.
Moving Averages are lagging Indicators so we miss some golden opportunities sometimes.
In the Trending Market, Moving Averages work well. But coming to a sideways, Moving Averages generate false signal sometimes.
Like that limitation, we have in Moving Averages Indicator. So consider those, before giving your entry based on Moving Averages.
Conclusion
Moving Averages are a very powerful and most used indicator fo r identifying present Trends and Entry/Exit points. Those indicators help a lot.
But Moving Averages generate signals based on past data, so there is a high chance to generate false signals sometimes.So always try to combine another indicator with help of Moving Averages for filtering false signals.
The Crypto market is highly volatile so before giving any entry must check all ways, then give entry.
Thank you professor @shemul21 for this amazing lesson to us.
Thanks for Stopping My post.
Upvoted! Thank you for supporting witness @jswit.