Trading Steem with the Ichimoku Cloud [EN/UA]

| EN translated by AI Claude 3 Haiku |
|---|
Question 1: Explain the five components of the Ichimoku Cloud
Describe the five main components of the Ichimoku Cloud: Tenkan-sen, Kijun-sen, Senkou Span A, Senkou Span B, and Chikou Span. How does each component contribute to understanding market trends and making trading decisions for the Steem token?
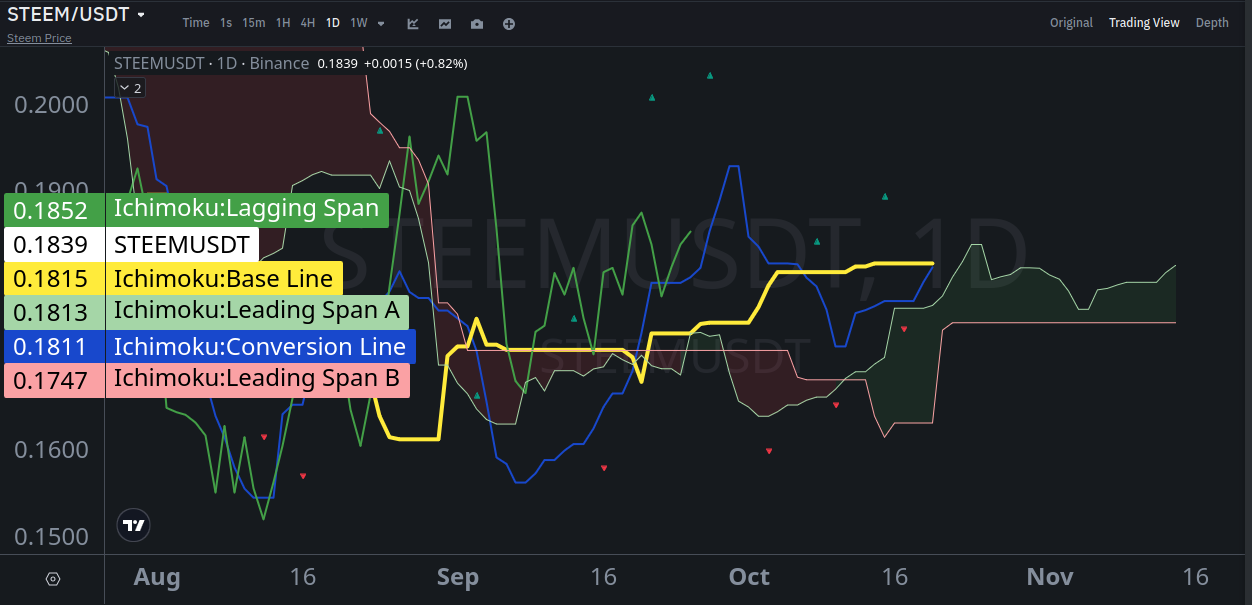
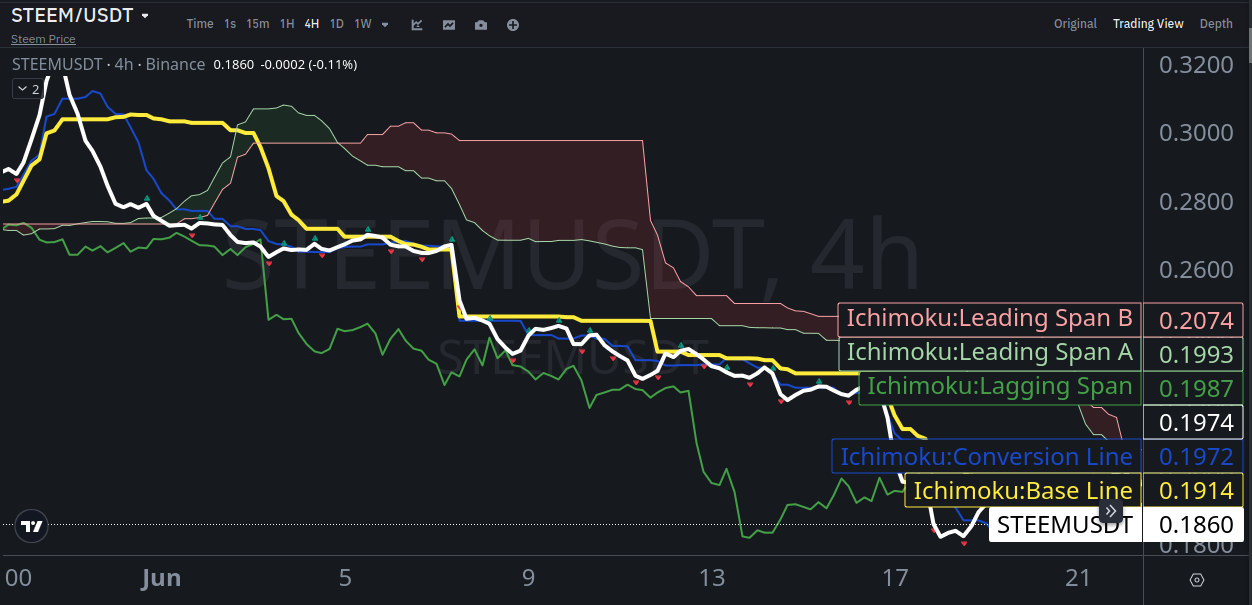
The Ichimoku indicator is aimed at improving the understanding of the market situation. It consists of five moving averages (MA) combined into one indicator structure, which, in addition to providing static data, also color certain areas, which are called clouds, as they resemble them. It may be a bit more difficult to understand how to interpret it, and the reason for this may be that the name of each line is not quite familiar words, as they are in Japanese.
However, when it is applied to the chart, everything becomes much simpler and a little easier. If, for example, the "Alligator" of Bill Williams has three lines and only the intersection and the opening of the mouth (when they diverge wider) is an important sign, then Ichimoku has a little more data. Let's get to know them better.
First of all, all five of them are MA. The parameters set were initiated by the developer himself, as in Japan at that time there were different working days in the week.
- Tenkan-sen (Conversion Line) - is the average price for the last 9 periods.
- Kijun-sen (Base Line) - is the average price for the last 26 periods.
- Senkou Span A - is the average of Tenkan-sen and Kijun-sen, shifted 26 periods forward.
- Senkou Span B - is the average of the highest price for the last 52 periods and the lowest price for the last 52 periods, shifted 26 periods forward.
- Chikou Span - is the closing price, shifted 26 periods back.
More detailed analysis
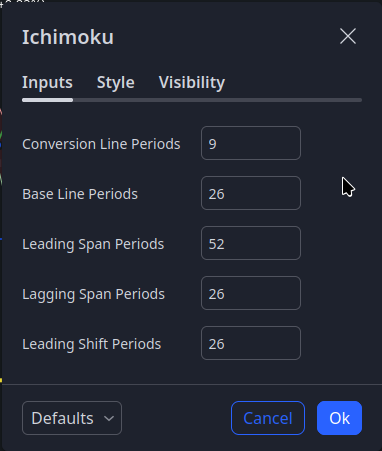
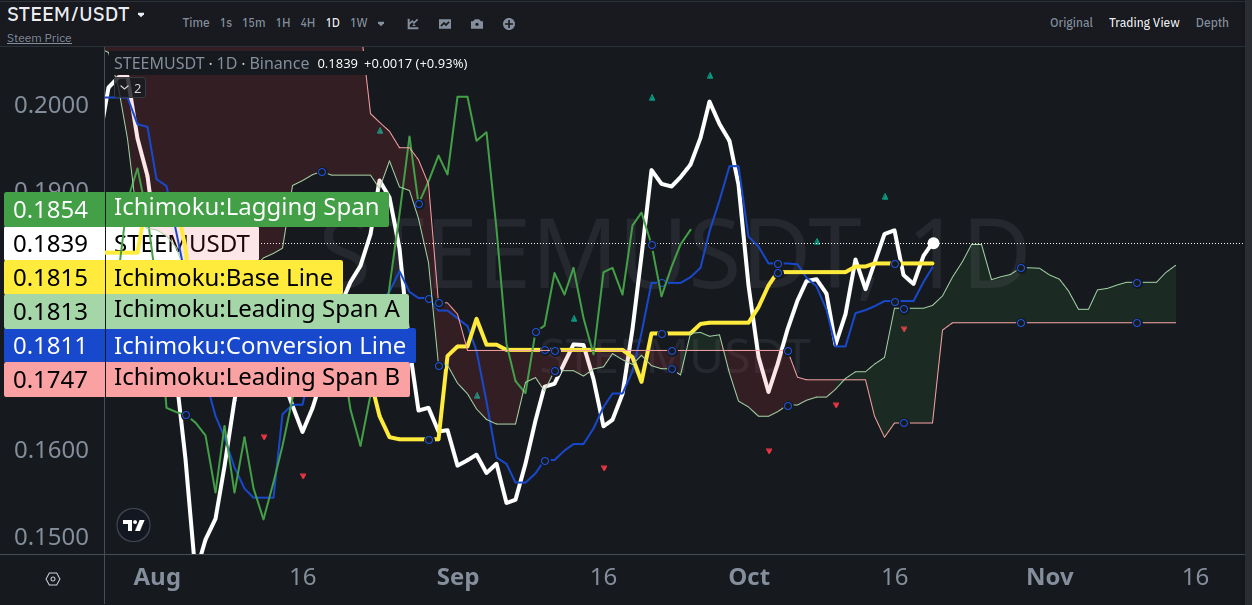
Tenkan-sen (blue) and Kinjun-sen (yellow) are the main lines that show the trend direction, i.e. the crossing from bottom to top or vice versa.
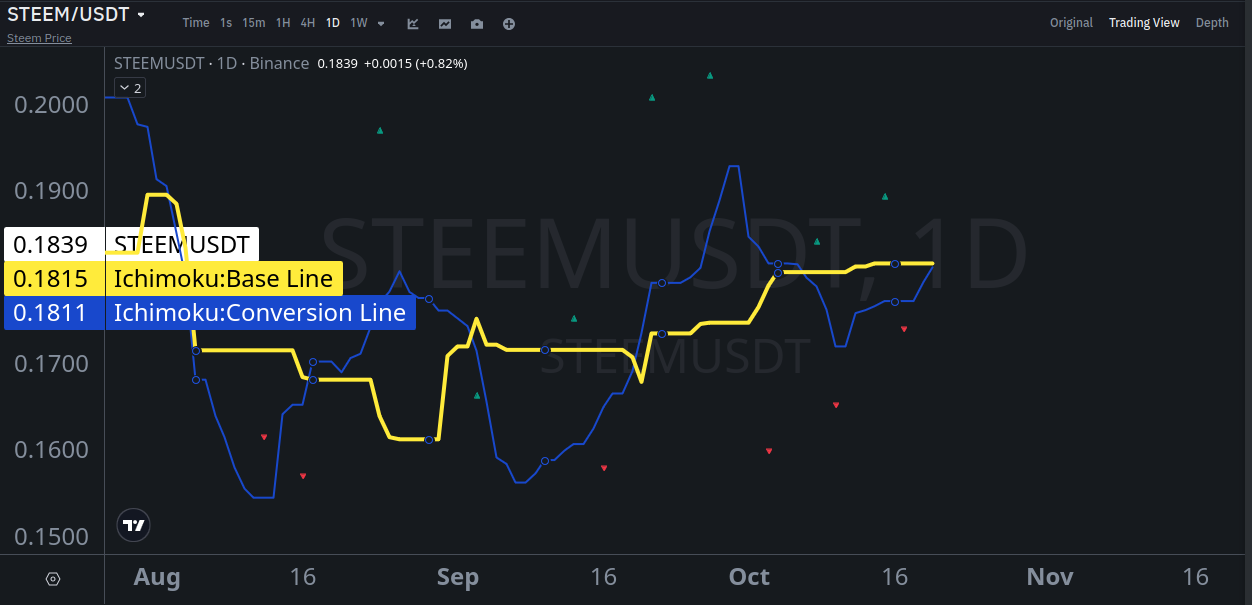
The other three Spans are designed for better forecasting. That is, Span A (younger greenish) is only the averaged indicators of the base and conversion lines, and Span B (older reddish). They are called leading, because they are shifted 26 periods forward, that is, just a visual representation on the chart (if I understand correctly), in order to better see and forecast. The space between them is colored in the corresponding color, depending on the direction. If A crosses B from bottom to top, it is a greenish cloud, that is, a bullish one, it will act as support. When the opposite is true, from top to bottom, it is a bearish and reddish one. The colors are just an explanation of the graphic images and can be different and customized to your own taste. That's why the indicator is called the Ichimoku Clouds.
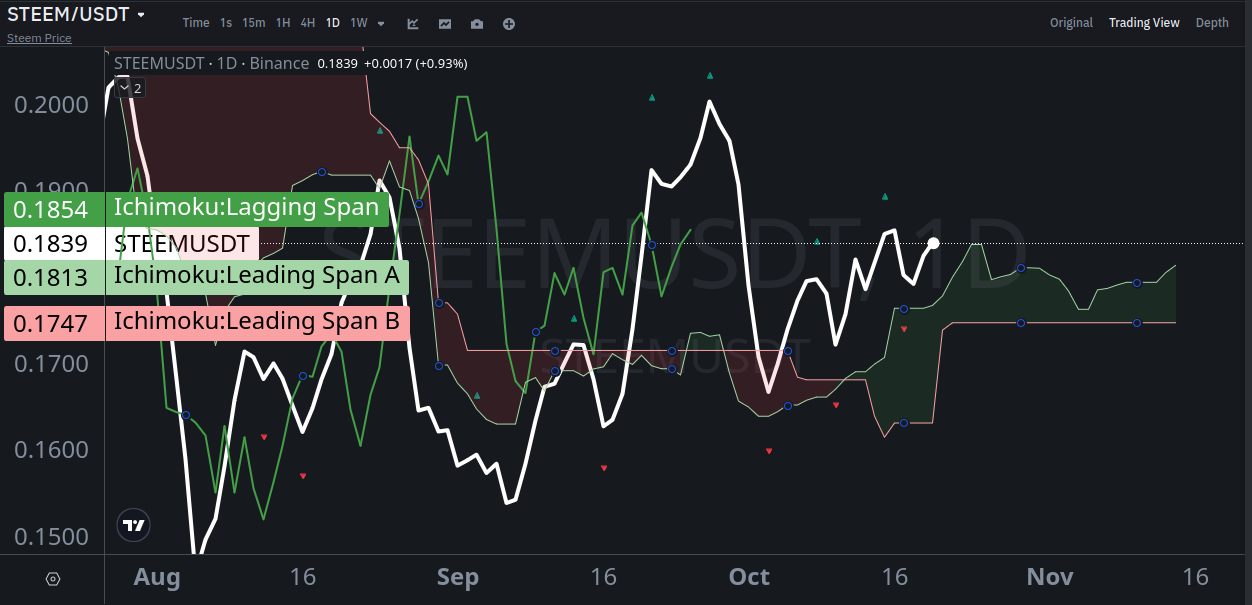
The fifth, Chikou Span, is focused only on the closing price and shifted back 26 periods, also called the lagging one. Although it just gives a slightly better look at the situation, because by looking closely, you can notice the similarity with the price line (white).
Question 2: Analyzing the trend direction using the Ichimoku Cloud
Using the historical Steem/USDT chart, analyze the trend direction based on the Ichimoku Cloud. Discuss whether the market is in an uptrend, downtrend, or consolidation. Provide specific examples of how the cloud signals potential buying or selling opportunities.
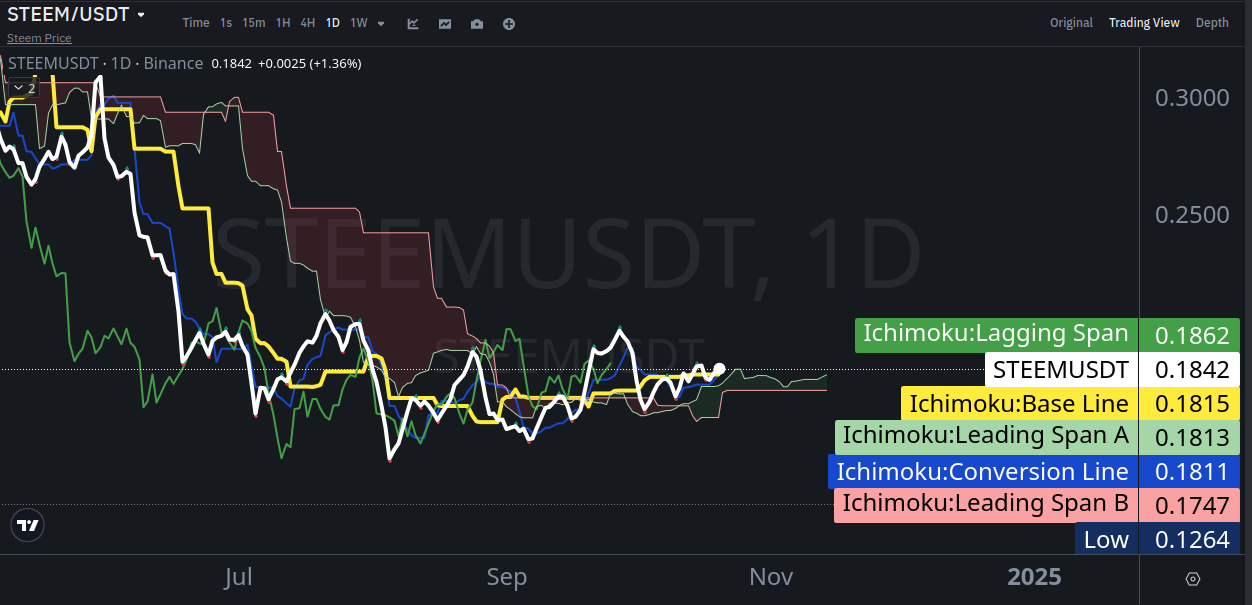
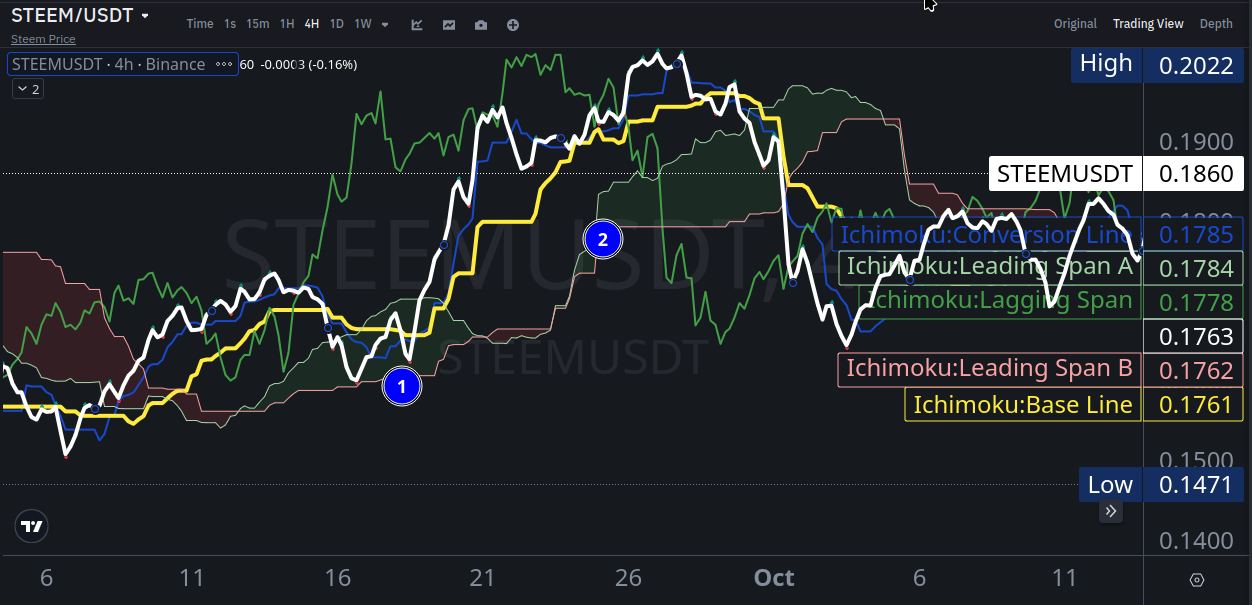
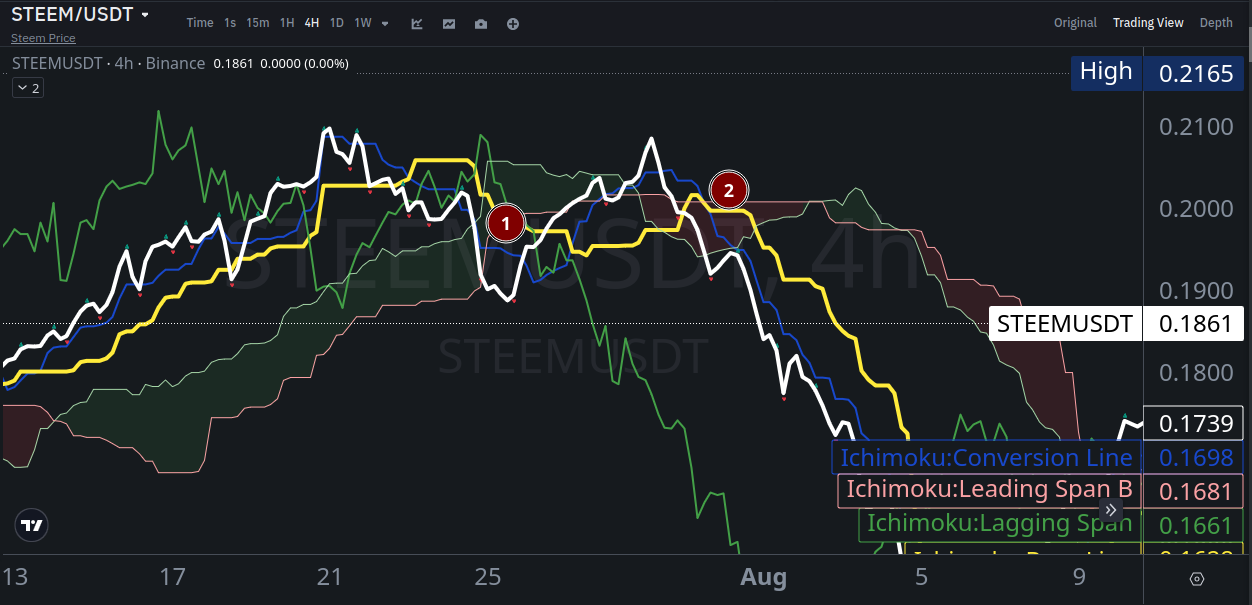
If we look at the D1 time period, we can see a large bearish cloud, when there was a downtrend and some small clouds, as well as frequent crossing of the base line by the conversion line from both sides, indicating a consolidation period.
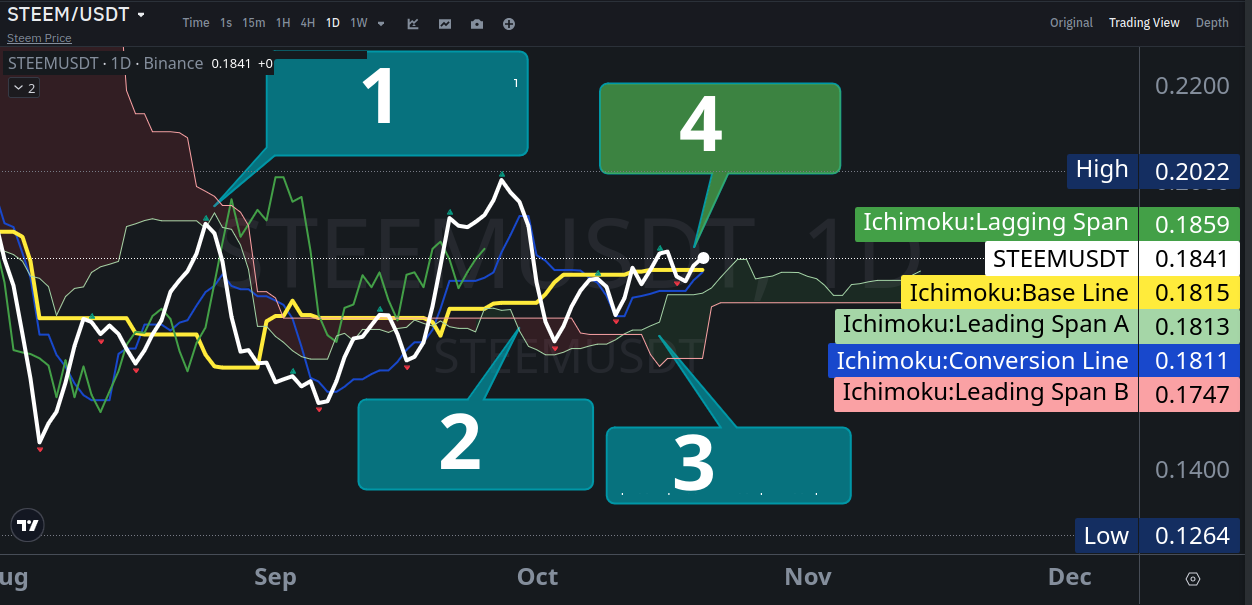
As for the likely buy and sell signals, this is well visible in the clouds, which are leading and initially show the likely direction, based on the crossing of Spans A and B (whether they were on the pipe). At point 1, there was still an echo of the downtrend, and a little later the conversion line crossed the base line from top to bottom in a small bearish cloud area. At point 2, we have a forecast of a bearish cloud, but a weak one, because the price did not go under it, but later this was confirmed by the bearish crossing of the yellow line by the blue one, but there is one nuance, these are historical data with shifted clouds, so it is not quite a thankful thing to give examples in a consolidation channel. So this means almost nothing for medium and long-term investment periods. So point 1 shows well the weakening of the bearish trend. And more can be shown at point 3, where a bullish cloud formed first, and then at point 4, the blue line headed for a crossing of the yellow one from bottom to top, and the cloud below, larger, which may signal a potential price increase.
The conclusion is that when the bearish cloud (and the larger it is) is above the price, it is good for sales, which should be confirmed by the base and conversion lines, i.e. their crossing in the appropriate direction, and when the bullish cloud is below the price, it is better for purchases, when it is confirmed by the base and conversion lines.
Question 3: Determining support and resistance levels using Ichimoku
Explain how the Ichimoku Cloud can be used to determine support and resistance levels. Provide a real example of Steem's price dynamics where the cloud acted as dynamic support or resistance, and how this helped predict a reversal or continuation of the trend.
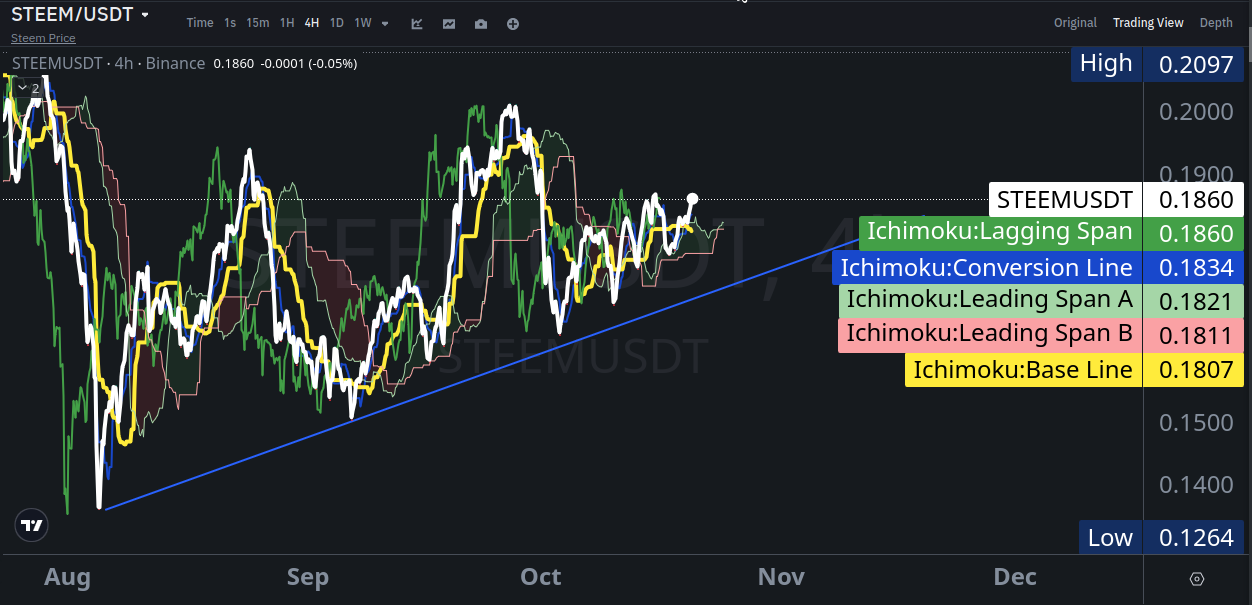
First of all, the cloud is also a dynamic forecast and is an approximate area of support or resistance, depending on its placement. Secondly, this will only be a greater probability, not a 100% guarantee.
Bullish Support
So, an example of bullish support during a small trend, when at point 1, the price even went into the cloud (but this is historical data), so at the beginning it was not so large, but gave a good hint, and the price was moving up. In the dip between 1 and 2, there is a thinning, a regain of weight starting from point 2 (even earlier), where the conversion line touched the base from above and went up again, where there was also a little support.
Bearish Resistance
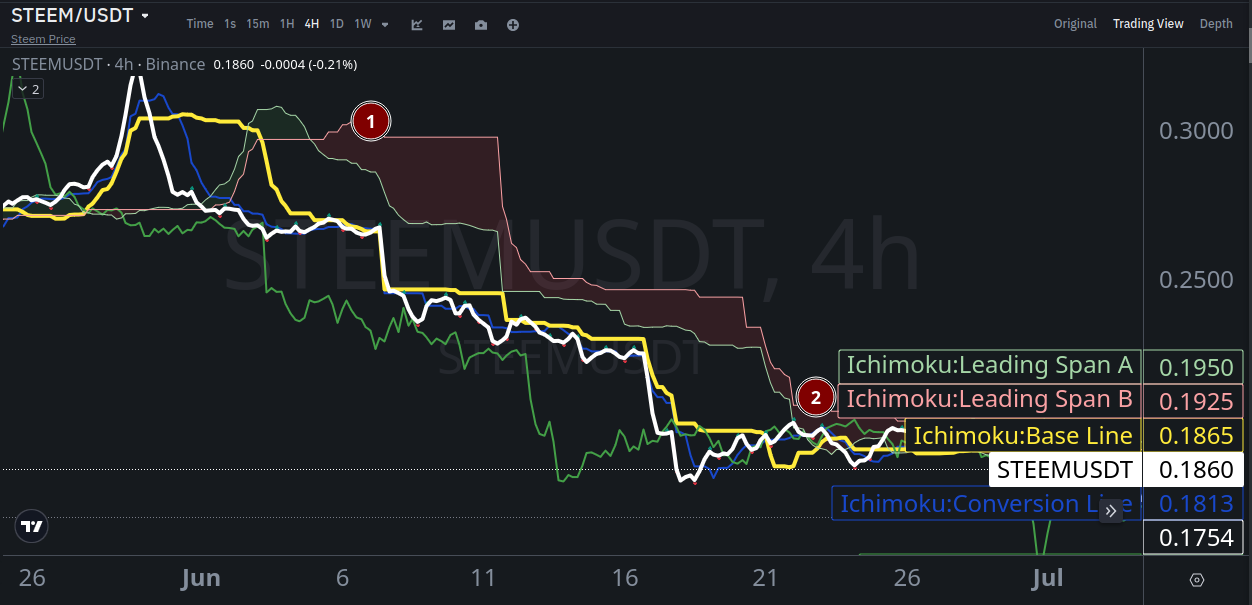
And this example shows a longer and more pronounced bearish trend, as the cloud was relatively evenly held throughout the period from point 1 to point 2, where there was a tighter contact with the price and there was also a decline from the resistance area, but not a big one.
Question 4: Trading using the Ichimoku Cloud
Develop a trading strategy using the Ichimoku Cloud for the Steem token. Outline your entry and exit points based on key signals such as the Tenkan-sen and Kijun-sen crossover, the position of the price relative to the cloud, and the behavior of the Chikou Span. Confirm your strategy with a real chart example.
There is not much to develop, that is, a lot of things have been known and open for a long time, but nowadays, it is better and more convenient to do this using technical tools and solutions. So this is more of a basic description of a simple principle.
Strategy
Analysis tools:
- Ichimoku Cloud indicator.
Buy Conditions
Option 1 Simple Crossing. The bullish cloud has formed below and acts as support, and Tenkan (conversion) crosses Kenjun (base) from bottom to top.
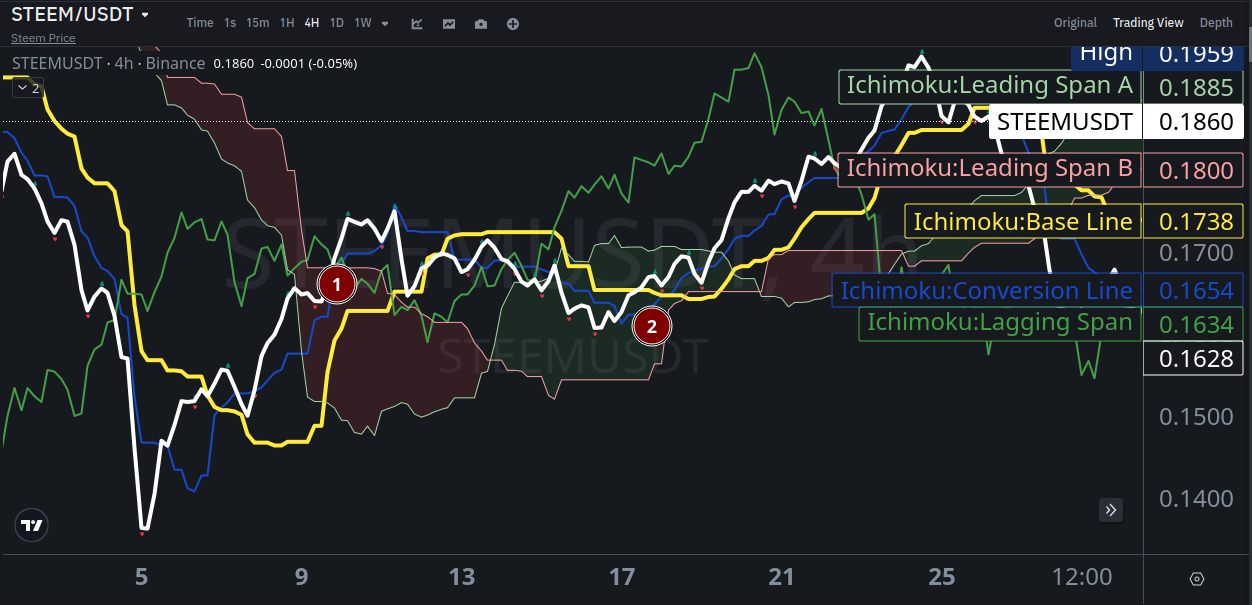
Option 2 Passing through the cloud. After a downtrend, the price passes through the bearish cloud at point 1, a bullish cloud forms for support, and the conversion line crosses the base line from bottom to top, as it does at point 2.
Sell Conditions
Option 1 Simple Crossing. The bearish cloud is above as resistance, and Tenkan crosses Kenjun from top to bottom.
Option 2 Passing through the cloud. The price passes through the bullish cloud as shown at point 1, then rises a little during the formation of the bearish cloud, where the conversion line crosses the base line from top to bottom, as at point 2.
Exit Conditions
Of course, it is worth focusing on the market situation, because historical data does not guarantee any profit. So the exit condition will be the formation of the opposite conditions. If this is a buy, then when a sell signal is formed, to get USDT for STEEM and wait until the price drops to buy cheaper for a new growth. And when sold (not for spot, but the classic option), then exit when a sell signal is formed. It is also worth focusing on the size of the clouds, the larger and more coherent they are over a long period of time, the more pronounced the
SL Risk Assessment
Regarding risks, the classic recommendations are to place SL under the bullish cloud for purchases, and above the bearish cloud for sales. However, this may have higher risk of losses, so you also need to consider the market situation and your personal capabilities and trading style. In general, you need to think about it, because many books write about how to conduct trade, but the statistics of successful traders are quite different, so the usual educational material distributed en masse will teach mostly the theoretical part.
Question 5: Forecasting Future Price Movements Using the Ichimoku Cloud
Apply the Ichimoku Cloud to forecast future price movements of Steem. Discuss the cloud's forecasting capabilities, especially Senkou Span A and Senkou Span B, and how they project potential support and resistance levels. What do these forecasts suggest about Steem's next steps?
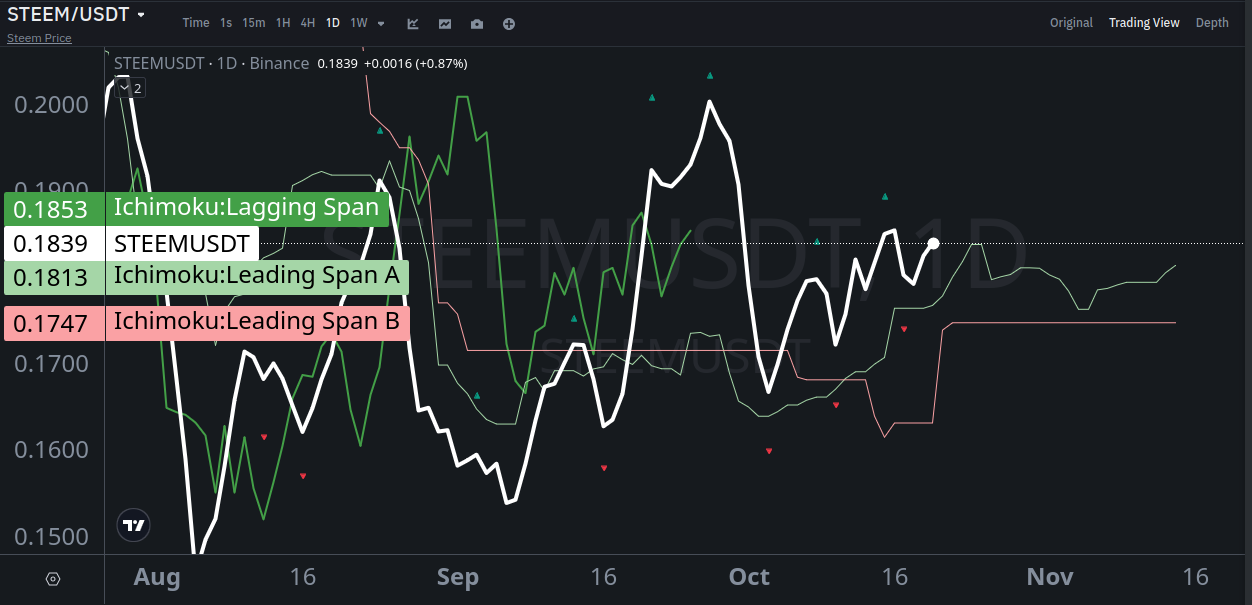
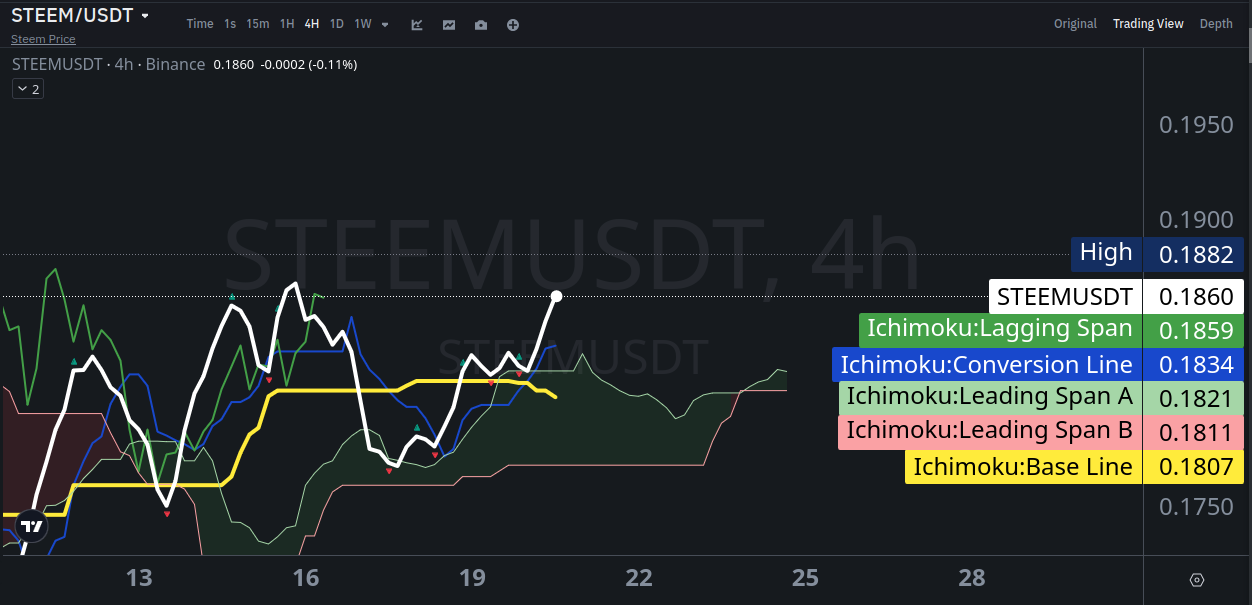
The H4 time frame shows us a somewhat upward trend.
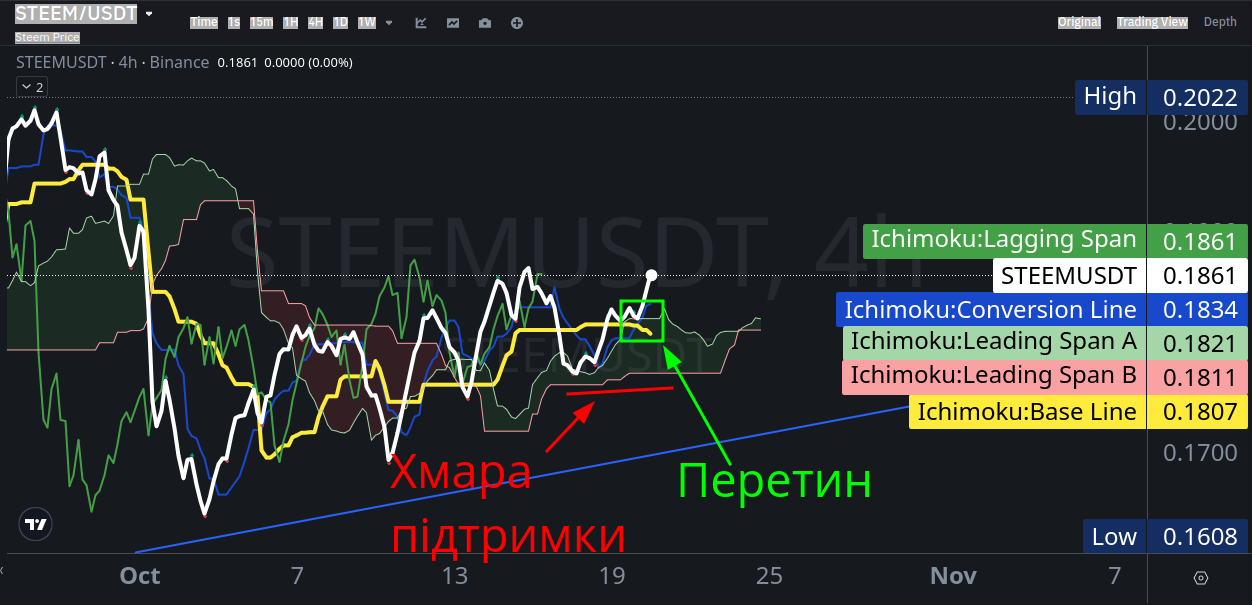
Applying the Ichimoku Cloud, we can see that, following the trend line, the price has passed through a small bearish cloud (likely during a correction), and gradually formed a bullish support cloud, i.e., its rising forecast, from where the conversion line crosses the base line from bottom to top. This indicates a continuation of growth, but not very pronounced.
So Senkou Span A and Senkou Span B (leading), help to form the forecasted support areas, and then, focusing on the Tenkan and Kijun crossover, strengthen the signal.
Next Steps for STEEM
Based on the indicator, we can say that the clouds are weak and the price may gradually increase, but it will not be fast, somewhere around 0.1900--0.1925 USDT per STEEM coin. And if it passes through the bullish cloud, the consolidation period may drag on with a corrective decline to 0.1815 with the risk of a downward trend change where 0.16 is fluttering, especially after overcoming the uptrend line (approximate), located slightly below.
Sources:
https://academy.binance.com/en/articles/ichimoku-clouds-explained
Consultations and assistance from the AI, such as the characteristics of the indicator lines framed in a quote.
The main image was generated by SDXL 1.0 and edited.
Screenshots with examples were made on https://www.binance.com/en/trade/STEEM_USDT?type=spot, but there everything is visible, including logos and ownership inscriptions.
| UA original |
|---|
Питання 1: Поясніть п'ять компонентів Хмари Ішимоку
Опишіть п'ять основних компонентів Хмари Ішимоку: Tenkan-sen, Kijun-sen, Senkou Span A, Senkou Span B та Chikou Span. Як кожен компонент сприяє розумінню ринкових тенденцій та прийняттю торгових рішень для токена Steem?
Індикатор Ішимоку спрямований на покращене розуміння ситуації на ринку. Складається із п'яти ковзних середніх (MA), котрі об'єднані в одну структуру індикатора й даючи статичні дані, також зафарбовують певні ділянки в колір, що називають хмарами, бо вони ніби на них схожі. Можливо його трохи важче зрозуміти, щоб трактувати, і причиною тому може бути назва кожної лінії не зовсім знайомими словами, адже вони японською.
Проте поглянувши коли він нанесений на графік, все стає значно простіше й трохи легше. Якщо, наприклад, "Алігатор" Біла Вільямса має три лінії й лише перетин та розкриття пащі (коли вони розходяться ширше) є важливою ознакою, то Ішимоку має трохи більше даних. З якими познайомимось ближче.
По перше всі із п'ятірки це MA. Встановлені параметри започатковані самим розробником, адже в Японії в той час були інші робочі дні в тижні.
- Тенкан-сен (Конверсійна лінія) - це середнє значення цін за останні 9 періодів.
- Кіджун-сен (Базова лінія) - це середнє значення цін за останні 26 періодів.
- Сенкоу Спан А - це середнє значення Тенкан-сен і Кіджун-сен, зміщене на 26 періодів вперед.
- Сенкоу Спан Б - це середнє значення найвищої ціни за останні 52 періоди і найнижчої ціни за останні 52 періоди, зміщене на 26 періодів вперед.
- Чіку Спан - це ціна закриття, зміщена на 26 періодів назад.
Детальніший розбір
Тенкан-сен (синя) та Кінжун-сен (жовта), це основні лінії котрі показують трендовий напрямок, тобто перетин знизу вгору чи навпаки.
Інші три Спани призначені для кращого прогнозування. Тобто Спан А (молодша зеленувата) лише усереднені показники базової та конверсійної ліній, а Спан Б (старша червонувата). Їх називають це лідируючими, бо вони зміщену на 26 періоді вперед, тобто просо візуальне відображення на графіку (якщо правильно розумію), щоб краще було видно й прогнозувати. Простір між ними зафарбовується у відповідний колір, залежно від напрямку. Якщо А перетинає Б знизу вгору, то це зеленава хмара, тобто бичача, буде як підтримка. Коли навпаки, згори до низу, це ведмежа й червонуватим. Кольори лише як пояснення до графічних зображень і можуть бути іншими й налаштовані на власний смак. Тому індикатор і названий Хмарами Ішимоку.
П'ята, Чіку Спан орієнтується лише на ціну закриття й зміщена назад на 26 періодів, ще називають відстаючою. Хоча вона просто дає поглянути на ситуацію трохи краще, адже придивившись, можна помітити схожість із ціновою лінією (біла).
Питання 2: Аналіз напрямку тренду за допомогою хмари Ішімоку
Використовуючи історичну діаграму Steem/USDT, проаналізуйте напрямок тренду на основі хмари Ішімоку. Обговоріть, чи ринок перебуває у висхідному, низхідному чи консолідаційному тренді. Наведіть конкретні приклади того, як хмара сигналізує про потенційні можливості для купівлі чи продажу.
Якщо поглянути на часовий період D1, то можна побачити велику ведмежу хмару, коли був низхідний тренд і поодинокі маленькі хмарки, а також частий перетин базової лінії конверсійною з обох сторін, що вказує на консолідаційний період.
А щодо ймовірних сигналів покупки та продажу, це добре помітно по хмарах, котрі є лідируючими й спочатку показують ймовірний напрямок, на основі перетину Спінів А та Б (чи були вони на трубі). В точці 1, ще був відгомін низхідного тренду, а трохи згодом конверсійна лінія перетнула базову зверху вниз в маленькому осередку ведмежої хмари. В точці 2, у нас прогноз ведмежої хмари, але слабенький, бо ціна не зайшла під неї, але згодом це підтвердив ведмежий перетин жовтої лінії синьою, але є один нюанс, це історичні дані зі зміщеними хмарами, тому це не зовсім вдячна справа наводити приклади в консолідаційному каналі. Тож це майже нічого не означає для середньо та довготривалого періодів інвестицій. Тож точка 1 добре показує ослаблення ведмежого тренду. І більше можна показати в точці 3, де спочатку утворилась бичача хмара, а згодом у точці 4, синя лінія направилась на перетин жовтої знизу вгору, а хмарка знизу, більша, що може сигналізувати про ймовірне зростання ціни.
Висновок такий, що коли ведмежа хмара (і чим більша) зверху ціни, то це добре для продажів, які мають підтверджуватись базовою та конверсійною лініями, тобто їх перетином у відповідному напрямку, а коли бичача хмара знизу ціни, то це краще для покупок, коли це підтверджується базовою та конверсійною лініями.
Питання 3: Визначення рівнів підтримки та опору за допомогою Ішімоку
Поясніть, як хмара Ішімоку може використовуватися для визначення рівнів підтримки та опору. Наведіть реальний приклад цінової динаміки Steem, де хмара виступала як динамічна підтримка або опір, і як це допомогло передбачити розворот або продовження тренду.
По-перше, хмара ще динамічний прогноз і є орієнтовною ділянкою підтримки або опору, залежно від її розміщення. По-друге, це буде лише більша ймовірність, а не 100% гарантія.
Бичача підтримка
Отже, приклад бичачої підтримки під час невеликого тренду, коли в точці 1, ціна навіть заходила в хмару (але це історичні дані), тож на початку вона була не такою великою, але давала хорошу підказку, а й ціна рухалась вгору. В западині між 1 та 2, є схуднення, повторний набір ваги починаючи із точки 2 (навіть раніше), де конверсійна лінія торкнулась базової зверху й знову пішла вгору, де теж було трохи підтримки.
Ведмежий опір
А цей приклад показує довший і вираженіший ведмежий тренд, адже хмара відносно рівномірно трималась весь період від точки 1 до точки 2, де був тісніший контакт із ціною й теж було зниження від області опору, але вже не велике.
Питання 4: Торгівля з використанням хмари Ішимоку
Розробіть торгову стратегію, використовуючи хмару Ішімоку для токена Steem. Окресліть свої точки входу та виходу на основі ключових сигналів, таких як перетин Tenkan-sen і Kijun-sen, положення ціни відносно хмари та поведінка Chikou Span. Підтвердіть свою стратегію реальним прикладом графіка.
Там особливо нема чого розробляти, тобто багато чого вже давно відомо й відкрито, але в наш час, це краще й зручніше робити за допомогою технічних засобів та рішень. Тож це більше базовий опис простого принципу.
Стратегія
Інструменти аналізу:
- Індикатор Хмара Ішимоку.
Умови на покупку
Варіант 1 Простий перетин. Бичача хмара сформувалась знизу й виступає підтримкою, а Тенкан (конверсійна) перетинає Кенжун (базова) знизу вгору.
Варіант 2 Прохід крізь хмару. Після низхідного тренду, ціна проходить крізь ведмежу хмару в точці 1, формується бичача хмара для підтримки, а конверсійна лінія перетинає базову знизу вгору, як це в точці 2.
Умови на продажу
Варіант 1 Простий перетин. Ведмежа хмара зверху, як опір, а Тенкан перетинає Кенжун зверху до низу.
Варіант 2 Прохід крізь хмару. Ціна проходить крізь бичачу хмару як це показано в точці 1, потім трішки підіймається під час формування ведмежої хмаринки, де відбувається перетин базової лінії конверсійною зверху вниз, як в точці 2.
Умови виходу
Звичайно варто орієнтуватись на ринкову ситуацію, бо історичні дані не дають ніякої гарантії того, що буде прибуток. Отже, умовою виходу буде формування протилежних умов. Якщо це покупка, то при формуванні сигналу на продаж, щоб отримати за STEEM USDT й почекати доки ціна знизиться, щоб купити дешевше для нового зростання. А коли продано (не для споту, а класичний варіант), то вихід при формуванні сигналу на продаж. Також варто орієнтуватись на розмір хмар, чим більші й цілісніші протягом тривалого часу, тим вираженіший тренд, а худі, котрі змінюються одна на одну, менш сприятливі, більше для короткотривалих періодів або торгівлі всередині дня.
Оцінка ризиків SL
Щодо ризиків, то класичні рекомендації, це розміщення SL під бичачою хмарою для покупок, а при продажах над ведмежою хмарою. Тільки це може мати більші ризик втрат, тому також треба зважати на ринкову ситуацію й особисті можливості й стиль торгівлі. А взагалі, треба там думати, бо багато чого пишуть книги як треба вести торгівлю, а статистика успішних трейдерів зовсім інша, тож звичайний навчальний матеріал, розповсюджений в масах навчить переважно теоретично частини.
Питання 5: Прогнозування майбутніх цінових рухів за допомогою хмари Ішимоку
Застосуйте хмару Ішімоку для прогнозування майбутніх цінових рухів Steem. Обговоріть можливості хмари щодо прогнозування, особливо Senkou Span A та Senkou Span B, і як вони проектують потенційні рівні підтримки та опору. Що ці прогнози свідчать про наступні кроки Steem?
Часовий період H4 показує нам деякий висхідний тренд.
Застосовуючи Хмару Ішимоку, видно, що дотримуватися трендової лінії, ціна пройшла крізь невелику ведмежу хмаринку (ймовірно під час корекції), та поступово сформувала хмарку підтримки бичачу, тобто її наростаючий прогноз, звідкіля відбувається перетин базової лінії конверсійною, знизу вгору. Що вказує на продовження зростання, але не дуже вираженого.
Тож Senkou Span A та Senkou Span B (лідируючі), допомагають сформувати прогнозовані ділянки підтримки, а потім орієнтуючись на перетин Танка та Кенжун, посилювати сигнал.
Наступні кроки STEEM
Орієнтуючись на індикатор, можна сказати, що хмарки слабенькі й ціна поки що, може поступово зростати, але це буде не швидко десь до 0.1900--0.1925 USDT за одну монету STEEM. А якщо вона пройде крізь бичачу хмару, то консолідаційний період може затягнутись з корекційним зниження до 0.1815 із ризиком зміни тенденції на низхідну де майорить 0.16, особливо після подолання лінії висхідного тренду (орієнтовна), розташованої дещо нижче.
Джерела:
https://academy.binance.com/uk/articles/ichimoku-clouds-explained
Консультації та допомога ШІ, як-то характеристика ліній індикатора обрамлена цитатою.
Головне зображення згенеровано SDXL 1.0 та відредаговано.
Зображення знімків екрана із прикладами зроблено на https://www.binance.com/en/trade/STEEM_USDT?type=spot, але там на них все видно, і логотипи й написи приналежності.
#ukraine #s20w6 #cryptoacademy-s20w6 #club5050 #ichimoku #crypto #steem