Steemit Crypto Academy Contest | S20W6 : Trading Steem with the
Assalamu Alaikum friends hope you are all well I am here to participate in the week six engagement challenge of my creation twenty last week. This time, the contest about the indicator from the crypto Academy community is Ichimoku Cloud Trading Strategy. I took the help of TradingView to screenshot and analyze all my strategies. Let's write the points of the detailed post now.

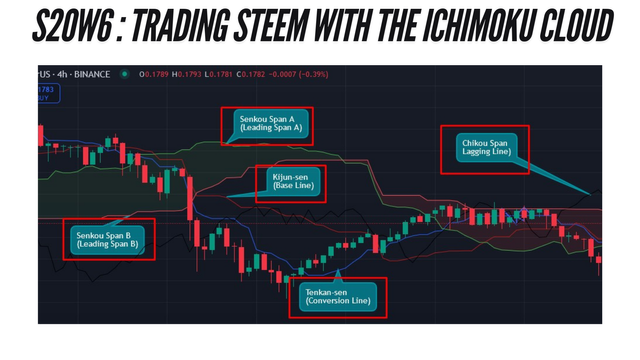
Ichimoku Cloud is a technical analysis indicator of broad application, focusing on price directions, speed, and price interactive support/level. They are as follows: Five factors commonly used in market condition analysis, each of which serves a specific function. Below is a detailed explanation of each component:
Tenkan-sen (Conversion Line): The Tenkan-sen indicator is defined as the average of the highest high and the lowest low of the last nine periods. Specifically, it is computed using the formula:
Tenkan-sen=Highest value of a nine bar period+Second highest value of a nine bar period
It is used as a bar chart which is good for the short term and if the pattern of lines turns up, it will show a tendency or reversal or continuation of a pattern. If prices go above this line, you may look for bullish signs, while going below the line, perhaps signifies bearish signs are at play.
Kijun-sen (Base Line): Essentially, the Kijun-sen is derived very much like the Tenkan-sen but over a larger period of periods, to be precise, 26 of them. Its formula is:
Kijun-sen = 26-period High + 26-period Low 2
This line is drawn to show at least a longer-term direction and helps one to predict where the support and resistance points shall be. An intersection of the Tenkan-sen, with the Kijun-sen could be seen as a trading signal for example the Tenkan-sen stemming the Kijun-sen is a buy signal.
Senkou Span A (Leading Span A): Senkou Span A is one of the two lines that give Ichimoku analysis its name because “Ichimoku” means cloud in Japanese. It is derived from averaging the Tenkan-sen and Kijun-sen and then plotting this value 26 periods ahead into the future:
Senkou Span A = (Tenkan-sen + Kijun-sen2
This line assist in defining possible areas of support or resistance once put to a check against the current price levels.
Senkou Span B (Leading Span B): Senkou Span B is worked out using the longer span – 52 periods – and is also plotted 26 periods forward:
Senkou Span B=cell value based on highest value of the 52 periods + cell value based on the second lowest value of the 52 periods
Also, a part of setting the cloud’s limits, it operates on analysis of longer-term movement of the price. Traders usually call the area between Senkou Span A and Senkou Span B as ‘the cloud’ and this will convey bullish or bearish signal depending on its position compared to current price.
Chikou Span (Lagging Line): The Chikou Span shows the current closing price located 26 periods behind the current price level:
Current Close Price = 9 plotted 26 days back from current dates = Chikou Span
This component is an affirmation mechanism for trends; if this component is above past prices, it is a bullish signal; if below, it is a bearish signal.
In brief, the five components allow the traders to get the knowledge about the trends and possible turns, as well as levels of support and resistance by working in pairs.
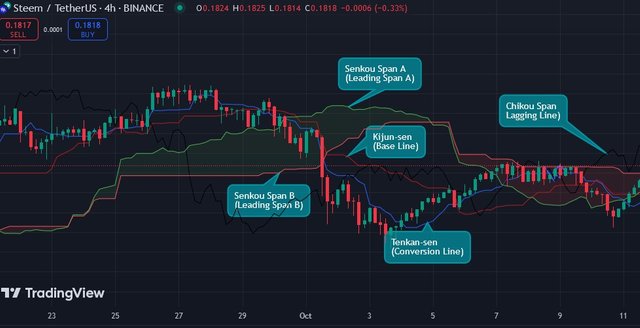
Ichimoku Cloud is a complete technical system that can give signals on trends, support and resistance levels and buying or selling opportunities. As such when you look at the Ichimoku Cloud chart of Steem/USDT then you will be in a position to determine the current phase of the market either being in an upward trend, downward trend or a period of consolidation.
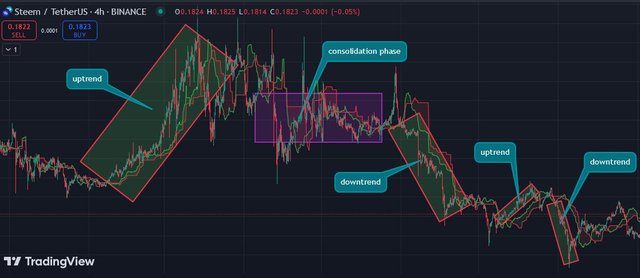
When in an uptrend the price typically runs above the cloud level. Senkou Span A is above Senkou Span B, that is why the momentum is bullish. For example, if price of Steem/USDT tends to operate above the cloud and both spans go up, then it indicates the existence of strong bullish signal. On the other hand, if the price is located under the cloud and leading span A is below its B, then downward trend is expected.
This happens during consolidation when prices move much inside the cloud without any defined direction. They speculate at entrances indicating a probability of a breakout through the cloud in an upward or downward manner. For instance, if the Steem/USDT price is near the upper part of the cloud and it appears that it has power to break through the cloud, it means that buyers should enter the market. On the other hand, if it comes close to the lower boundary with bearish signals such an instance bearish candlesticks then it could suggest that it is time to sell.
Altogether, using the Ichimoku Cloud index, together with the index of conversions line ‘Tenkan-sen” ‘and the base line ‘Kijun-sen” the traders are capable of intercepting the trade volume of Steem/USDT and assessing intended direction to entice entry or exit points.
Ichimoku Clouds are diagonal moving averages that cover the entire spectrum of trading – direction of trends, areas of support or resistance, buying and selling indicators. If we use the Ichimoku Cloud to analyze the historical chart of the Steem/USDT, we can determine what phase the market is in: bullish, bearish or ranging.
Of them, when the market enters into the uptrend, the price is usually found well above the cloud. Senkou Span A is above Senkou Span B, the blue line is above the red line within the Kumo cloud, which is a bullish signal. For instance, if price of Steem/USDT constantly fluctuates above the cloud level while both spans are directed upwards, this means that there is strong upward movement. On the other hand if the price falls below the cloud and the leading span A penetrates below the leading span B, it forms a bearish signal.
During consolidation, prices fluctuate sideways in a range, more or less bounded by the cloud. This phase often offers favorable trading points because prices will break either up or down the cloud. For instance, looking at the cloud indicator, if Steem/USDT is operating nearby the upper boundary and demonstrates the extensive bullish sentiments (indicated by bullish candlestick patterns), the area acts as a buy signal. On the other hand, if it bumps close to the boundary with bearish signals, such as with bearish candlestick patterns, then the signal is if it is time to sell.
Continually, this paper posits that relative to the ichimoku cloud, in conjunction with its constituents including the Tenkan-sen and the Kijun-sen, Steem/USDT traders can successfully predict when to enter or exit the market.
Ichimoku Cloud is a versatile indicator that both identifies areas of support and resistance levels and also shows the direction of a trend and even a signal to buy or sell. It consists of five main components: Conversion Line or Tenkan-sen, Base Line or Kijun-sen, Leading Span A and B also referred to as Senkou Span , and Lagging Span or Chikou Span. Below is a breakdown of entry and exit signals based on the indicators of these components.
Identification of Entry and Exit Signals
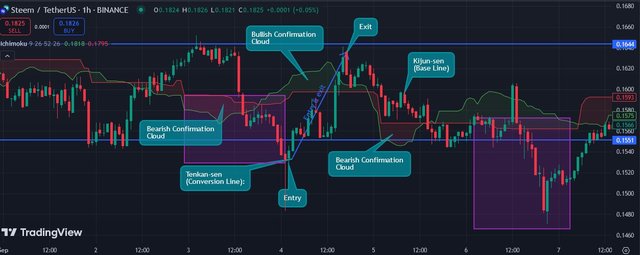
Buy Signal: In case the Tenkan-sen line goes above the Kijun-sen line, this is a bullish signal. This crossover indicates that short-term going is getting more powerful than near-term trend.
Sell Signal: On the other hand, if the Tenkan-sen goes beneath the Kijun-sen it becomes a bearish trend alert. It also point towards a view that short term moving average is in the process of decelerating as compared to the long term moving average.
Price Position Relative to the Cloud:
Bullish Confirmation: When the price is over the cloud, it prophetically indicates that the market is bullish. If the Tenkan-sen/Kijun-sen crossover occurs in this situation, traders may go long.
Bearish Confirmation: When the price is below the cloud it signifies a bearish market. The bearish crossover is one of those trading indicators that may be used by traders to open short positions.
Chikou Span Behavior:
Most of the time, a Chikou Span should remain above the price in case of bullish signals or below in case of bearish signals.
Bullish Signal: The bullish pressure is confirmed when Chikou Span rises above both, its price line as well as cloud.
Bearish Signal: When Chikou Span goes below the price line as well as the cloud, bears are generated.
Cloud Thickness and Color:
Thickness can be used to define how strong support or resistance levels are because they are displayed with thick clouds. Mary Carson has asserted that if the cloud is thicker, thrice the support resistance level is implied. The color of corresponding cloud (green for bullish and red for bearish) can offer more confirmation of a current market situation.
Exit Points:
For long positions, consider exiting when:
The Tenkan-sen is once again breached from the bottom by the price action and stays below the Kijun-sen. Price closes below the cloud. Chikou Span crosses back below the price and should serve to make for an easy read.
For short positions, consider exiting when:
- This is because the Tenkan-sen has crossed above the Kijun-sen once again.
- Price closes above the cloud. Price crosses back above Chikou Span.
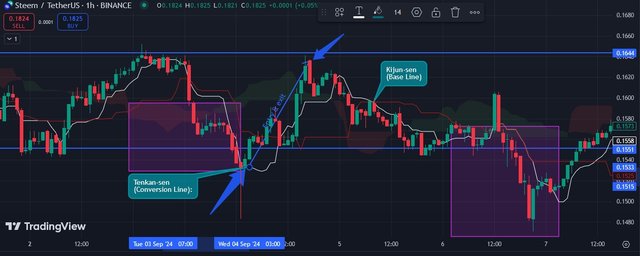
When explaining these concepts, a subject would rather define these using an example chart that employs actual data highlighted with basic line crossovers of the two main indicators here being Tenkan-sen and Kijun-sen; Their position relative to the Ichimoku Cloud; and the action of Chikou Span.
Senkou Span A is obtained from averaging the Tenkan-sen (conversion line) and the Kijun-sen (base line) and extending the average 26 periods forward. On the other hand, Senkou Span B is calculated as the average of the highest high and the lowest low price patterns over 52 trading periods with the value being further projected 26 trading periods ahead. The space between these two spans is called the ”cloud” and it acts as an interactive support /resistance level.
The IC can also be employed to analyze the price movement of Steem as follows, if the current price is located above the cloud it is regarded as bullish, conversely if below it is regarded as bearish. Recent Senkou Span A with respect to Senkou Span B can also define potential volatility; while the bigger cloud signifies strong support or strong resistance level. Sometimes, traders look for reversals or breakouts when the price level tends to reach either of the spans in relation to Steem.
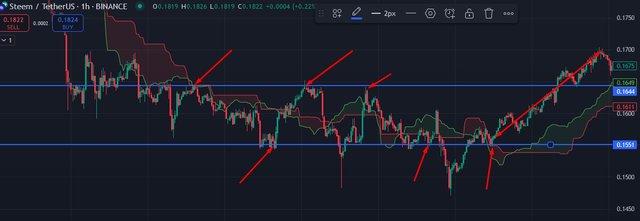
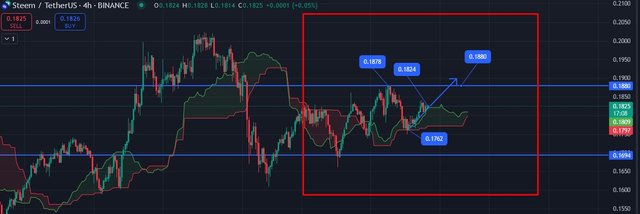
As you can see here I have drawn a train line and the current price consul on the A and B lines. That means we are currently at Bolis Market. Now at the moment STEAM price is 0.1827. Support and resistance is drawn. We are moving towards our first target 0.1880 resistance and it may come down again from there but if the market condition is good and volume is high then we cross our resistance and price more. It will go up but if for some reason we see the red cloud on the down side then the market will come back to the bearish level and we may see it at 0.1700 / 0.1685 as our support area.
Ichimoku Cloud represents a complete trading system that offers information about support and resistance levels and trends as well as the strength of the trends. It consists of five main components: These indicators are: Tenkan-sen or conversion line, Kijun-sen or base line, Senkou Span A and B or leading spans, Chikou Span or lagging line. From the above highlighted elements, traders will be in a good position to assess the market well. The cloud itself is the indicator of potential future support and resistance level, which is a critical point in trading decisions. In a nutshell, it can endow with a comprehensive prospect of price movement and is capable to refine trading strategies in the Ichimoku Cloud.
Here, I have tried to share the information in front of you very accurately through the screenshots, I hope you can understand and apply them all correctly. But of course you should start trading with the opinion of an experienced trader. Avoid large profit or loss at any time and take market entry in consultation with an experienced person.

Thanks to everyone here is an invitation @stream4u @simonnwigwe & @josepha
X promotion link
https://x.com/mostofajaman55/status/1847727448777249067
Upvoted. Thank You for sending some of your rewards to @null. It will make Steem stronger.