Crypto Trading Strategy with Triangular Moving Average (TRIMA) Indicator - Crypto Academy / S6W4 - Homework Post for @fredquantum.
Cover Page Created by me, @msquaretk | Made on imarkup app
In this new week of lecture, I'm going to be answering the questions posted as assignments by Prof. @fredquantum after going through his lecture. His lecture was on "Trading Strategy with Triangular Moving Average (TRIMA) Indicator". He explained the indicator very well and how to use it to trade effectively. I will be responding to his questions one after the other. Follow me closely.

1. What is your understanding of the TRIMA indicator?
In this first task, I'm going to be explaining TRIMA indicator based on my own understanding. One of the popular indicators in the world of technical analysis is moving average. Moving average has been a very useful indicators which is mostly used for trend identification. Traders don't need to go through so much stress before they can identify the trend which an asset is; all they need is to add the moving average on their chart. However, as good as this moving average is, sometimes they lag behind the price and before a trend is identified, price would have moved a long way. It's this reason why many types or kind of this indicator are being developed to overcome the limitations.
Triangular moving average (TRIMA) is a variance of moving average. Triangular moving average was actually developed as a result of limitations of the simple moving average (SMA). Some of us know how simple moving average works. SMA gives its value as the average of price over a particular period of time and it's on this that its line is drawn on the price chart. TRIMA, however, is designed to smooth this by averaging the price twice so as to overcome the shortcoming of simple moving average.
Being smoothed twice or double, it doesn't react as quick as the simple moving average reacts to price. TRIMA is an indicator which doesn't react quick to volatility in the market and hence it's very suitable to trade any type of market even the volatile crypto assets. It's a trend-based indicator which is used to identify the trend which a particular asset is in the market. In addition, it's a good indicator which can also be used for trend change in the market. It consists of a single line which oscillates with the price of an asset on the price chart.
In summary, TRIMA is:
- a variance of moving average which is smoothed by averaging the price double.
- an indicator that doesn't react quick to the price and volatility in the market. Hence, it's suitable for both volatile and non volatile crypto assets.
- a trend-based indicator which can be used to identify the trend in the market.
- an indicator which can be combined with other indicators to increase its success rate.
2. Setup a crypto chart with TRIMA. How is the calculation of TRIMA done? Give an illustration. (Screenshots required).
Here, I'm going to be adding TRIMA indicator to the chart. The platform I will be using is trading view. To add any indicator to the chart, click on the chart at the homepage of the trading view. Then on clicking it, the chart will be loaded. At the top of the page, love for indicator fx, then click on it. See the screenshot below.
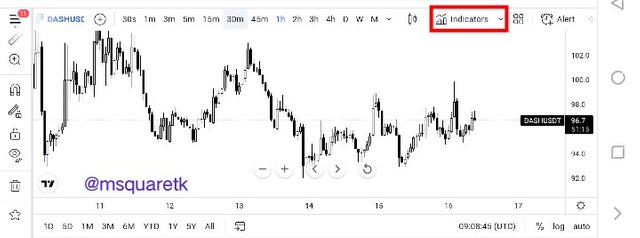
Screenshot from trading view | SOURCE
Then once you click on it, a page will appear where you can search the indicator you want to add. In my case, I searched triangular moving average, then I clicked on it once.
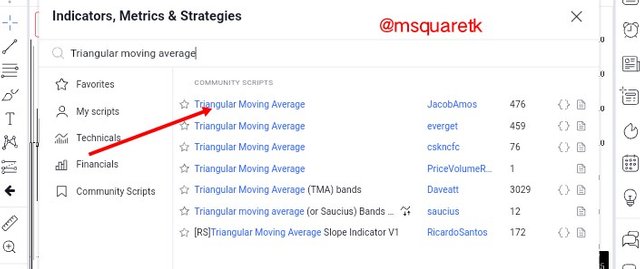
Screenshot from trading view | SOURCE
Thanks, upon clicking on it, the indicator will be added to the chart. See the screenshot below. You will see I have added TRIMA indicator to the chart.
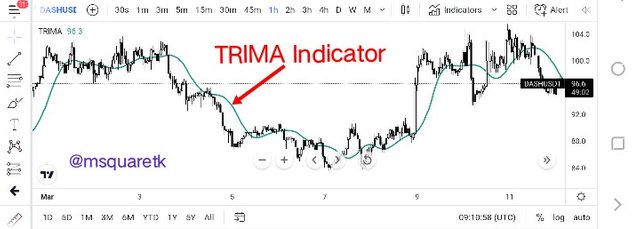
Screenshot from trading view | SOURCE
You can configure this Indicator to suit your liking. To configure it, click on "gear like icon" which my arrow is pointing at in the screenshot below.
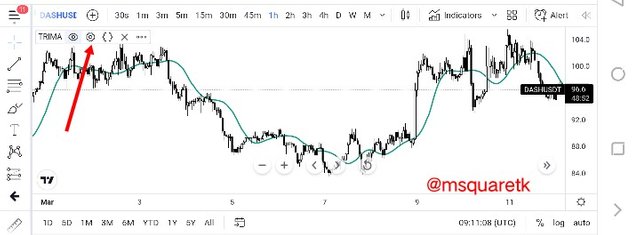
Screenshot from trading view | SOURCE
Then, you will see what you can edit. There are three sections, style, input, and visibility. You can change the period by clicking on the input and change the number in the length. The default period is 19, but I'm changing it to 20. See the screenshot below.
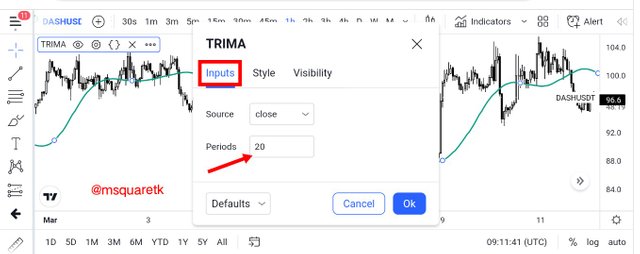
Screenshot from trading view | SOURCE
You can also change the color and thickness of the indicator. To do this, click on style.
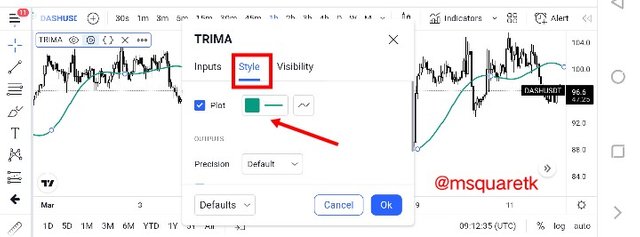
Screenshot from trading view | SOURCE
Calculation of TRIMA Indicator
Now, let's see how TRIMA is calculated. If you recollect, I mentioned earlier that TRIMA includes simple moving average (SMA) in its calculation. It's a variance of SMA. Firstly, let's see the formula of SMA.
SMA = [Pa1 + Pa2 + Pa3 + Pa4 + Pa5 + Pa6 + Pa7 + PaL ] / tnp
Pa1 - a7 = Price of an asset at seven period
PaL = Price of an asset at the last period
tnp = Total number of period
For example, let's consider the price of an asset for five periods. The screenshot below shows the price marked with a straight blue lines.
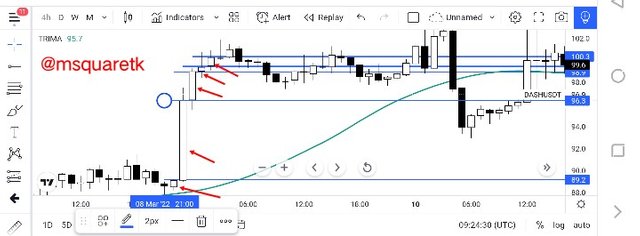
Screenshot from trading view | SOURCE
Pa1 =$89.2
Pa2 = $96.3
Pa3 = $98.9
Pa4 = $99.6
Pa5 = $100.3
SMA = [89.2 + 96.3 + 98.9 + 99.6 + 100.3 ] / 5
SMA = [484.3] / 5
SMA = $96.8
Then, the formula for TRIMA is
TRIMA = [SMA1 + SMA2 + SMA3 + SMA4 + SMA5 + SMA6 + SMA7 + SMAL ] / tnp
We have already gotten SMA1 = $96.8
Let:
SMA2 = $98.5
SMA3 = $94.6
SMA4 = $100.2
SMA5 = 104.4
Hence,
TRIMA = (96.8 + 98.5 + 94.6 + 100.2 + 104.4) / 5
TRIMA = (494.5) / 5
TRIMA = $98.9
3. Identify uptrend and downtrend market conditions using TRIMA on separate charts.
Here, I'm going to be explaining how to identify uptrend and downtrend with the TRIMA Indicator. Remember I said the indicator is a trend-based indicator. Hence, it's a good indicator which shows the trend I the market. The short period may not give a clear trend in the market since it's always close to the price, long period is advisable so as to clearly see the trend an asset is.
When the price is above the TRIMA indicator, then the trend is said to be bullish or uptrend. The price must be seen above the TRIMA indicator line to be able to consider a trend an Uptrend. For a downtrend market, we will see the price of an asset below the TRIMA indicator line. If the price is seen clearly below TRIMA line, then it's considered as bearish or downtrend. Let's see an example in the screenshot below.
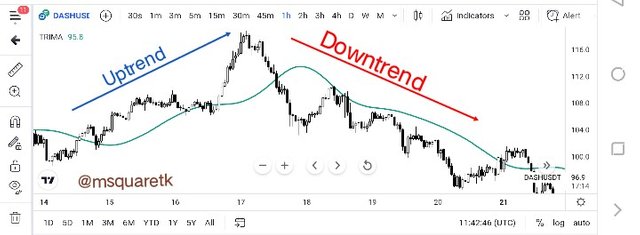
Screenshot from trading view | SOURCE
In the screenshot above, you can see that during an uptrend market, the price was above the TRIMA indicator and during a down trees market, the price was below the indicator. We can see how this indicator help us identify the trend. Traders look for long opportunity in an uptrend and short opportunities in a downtrend.
4. With your knowledge of dynamic support and resistance, show TRIMA acting like one. And show TRIMA movement in a consolidating market. (Screenshots required).
In this part of the task, I'm going to be explaining my understanding of the dynamic resistance and support and the consolidating market with the TRIMA Indicator. It's pertinent to know that dynamic support and resistance are seen in a trending market. That's you can't have dynamic support or resistance in a sideway market, it's only in a trending market.
TRIMA indicator acts as dynamic support and resistance and traders use the indicator to capitalize on the trend. TRIMA indicator acts as a dynamic support in an uptrend market. It supports the price whenever price touches the line. An example of TRIMA acting as a dynamic support is attached below.
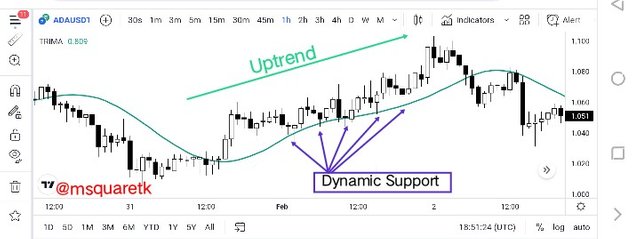
Screenshot from trading view | SOURCE
You can see in the screenshot above how the TRIMA indicator was supporting the price whenever price touches it. This will persist until the trend changes to downside.
Also, TRIMA indicator is useful in a downtrend market. It acts as a dynamic resistance. Whenever price touches the TRIMA line, it will resist the price. Traders can look for opportunity to go short when the price approaches the TRIMA line knowing that it will resist price.
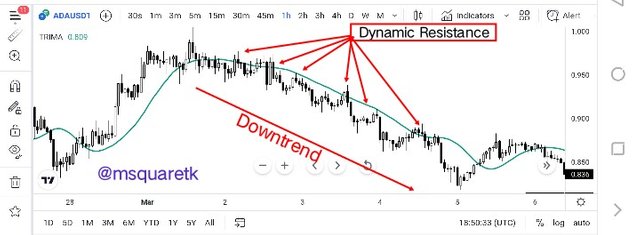
Screenshot from trading view | SOURCE
In the screenshot above, we can see how the indicator resisted the price whenever it touches the line.
In a sideway or consolidating market, TRIMA is seen intertwine the price. Meaning the indicator will be going up and down the price without a clear direction. When this is seen, then you should know that the market is consolidating and it's better not to trade at this moment. Let's see the screenshot below as an example.
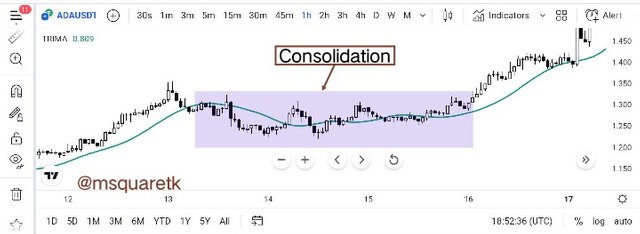
Screenshot from trading view | SOURCE
Looking at the screenshot above, we can see that the market has no direction, meaning it's consolidating and we see the behavior of TRIMA at that time. It's was just flipping below and above price.
5. Combine two TRIMAs and indicate how to identify buy/sell positions through crossovers. Note: Use another period combination other than the one used in the lecture, explain your choice of the period. (Screenshots required).
In this part of the task, I'm going to be combining two TRIMA together and indicate buy and sell signal through the crossover. For this task, i will be combining two TRIMA together, one short period and the other long period. For the short period TRIMA, I will be adding 8 period and the long one is 15 period.
Now, to identify the buy signal, we will look at the two TRIMA indicator at which they cross. If the short period TRIMA (in my case red line) crosses above the long period TRIMA (green line), then that crossover is a buy signal. Let's take a look at the crossover that led to an Uptrend below.
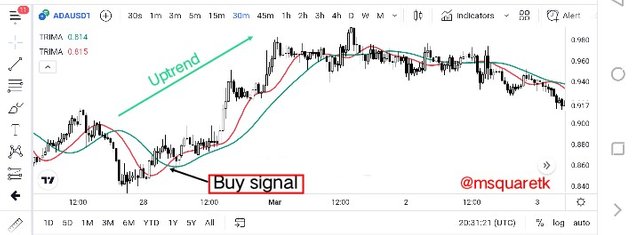
Screenshot from trading view | SOURCE
In the screenshot above, we can see the crossover that occurred on the chart of ADAUSDT. Prior to the crossover, the market was on a bearish trend but when the sellers got weakened, the buyers took over the market. We can see that the red line(8 period TRIMA) crossed above the green line (15 period TRIMA)
A crossover that leads to a bearish market occurs at the peak of an uptrend. A sell signal occurs when the short period TRIMA(I my case red line) crosses below the long period TRIMA (in my case green line). The crossover signifies a change in trend as buyers are overpowered by the sellers. Let's see an example of a crossover that happened.
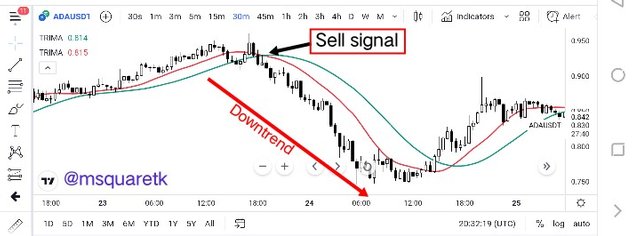
Screenshot from trading view | SOURCE
In the screenshot above, we can see a sell signal that occurred on the chart of ADAUSDT. The short period TRIMA crossed below the long period TRIMA. We can see how that led to a considerable fall.
6. What are the conditions that must be satisfied to trade reversals using TRIMA combining RSI? Show the chart analysis. What other momentum indicators can be used to confirm TRIMA crossovers? Show examples on the chart. (Screenshots required).
Here, I'm going to be explaining how to trade reversal with TRIMA and RSI being combined. It's not advisable to use an indicator as a stand alone tool, and TRIMA is not an exception. Hence, combination of RSI indicator will increase the success rate. RSI is a momentum-based indicator which shows when the price is overbought and oversold in the market. The scale of 70 and above is known as overbought region while the 30 and below is known as oversold region. So combination these Indicators gives is a good chance to trade both bullish and bearish reversal.
Criteria to Trade Bullish Reversal
- To trade bullish reversal, we first of all add the TRIMA and RSI indicator to the chart.
- The market must be in a downtrend since we want to trade bullish reversal.
- Wait for RSI to enter oversold region which is a bullish trend signal.
- Then, confirm this bullish signal received from RSI by waiting for crossover to occur on TRIMA. When the shorter period TRIMA crosses above the longer TRIMA, then that's a buy signal. Enter a buy entry after two or three candles form after the cross over.
- Stop loss should be placed at the or below support. Then take profit should be set to have a risk reward of 1:1.
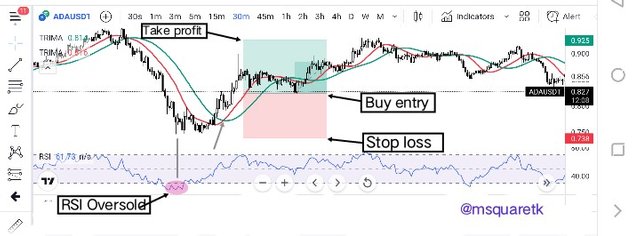
Screenshot from trading view | SOURCE
In the screenshot above, we saw the price in a downtrend before RSI entered oversold, then shortly after that crossover occurred on TRIMA. See how the price rallied to the upside.
Criteria to Trade Bearish Reversal
- To trade bearish reversal, we first of all add the TRIMA and RSI indicator to the chart.
- The market must be in an uptrend since we want to trade bearish reversal.
- Wait for RSI to enter overbought region which is a bearishh trend signal.
- Then, confirm this bearish signal received from RSI by waiting for crossover to occur on TRIMA. When the shorter period TRIMA crosses below the longer TRIMA, then that's a sell signal. Enter a sell entry after two or three candles form after the cross over.
- Stop loss should be placed at the or above resistance. Then take profit should be set to have a risk reward of 1:1.
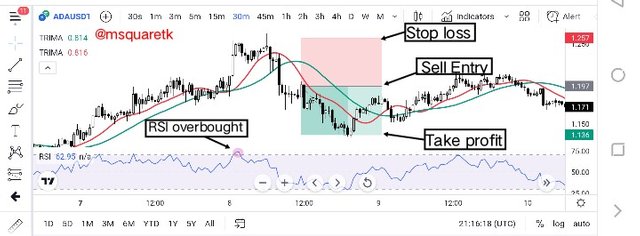
Screenshot from trading view | SOURCE
The screenshot above shows that the market was in an up trend and then the price was overbought as confirmed by the RSI. Then shortly, the TRIMA indicator lines crossed. This confirms the sell signal received from RSI and see how the price rallied to the downside.
Other Momentum Indicator that can be combined with TRIMA (Stochastic oscillator)
One of the other best momentum-based indicators that works well with TRIMA is stochastic oscillator. This Indicator also shows when the price of an asset is oversold and overbought. It consists of two lines which oscillates up and down its indicator window. The oversold region of stochastic is 20 and below while the overbought region is 80 and above. When the lines of stochastic oscillator cross at the oversold region, it is a buy signal and when they cross at the overbought region, it's a buy signal.
So, trade a buy entry using TRIMA and stochastic, stochastic lines must cross at the oversold which is a bullish signal, then the bullish crossover must occur on TRIMA which should confirm the signal of the stochastic oscillator. Let's see an example below.
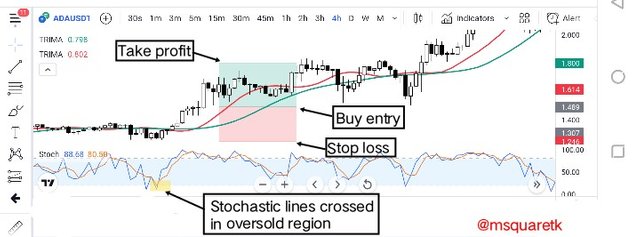
Screenshot from trading view | SOURCE
If you look at the screenshot above very well, you will see that Stochastic lines crossed at the oversold and shortly we saw a bullish crossover on TRIMA and the price rallied to the upside.
In the same way, to trade a sell entry using TRIMA and stochastic, stochastic lines must cross at the overbought which is a bearish signal, then the bearish crossover must occur on TRIMA which should confirm the signal of the stochastic oscillator. See the screenshot below.
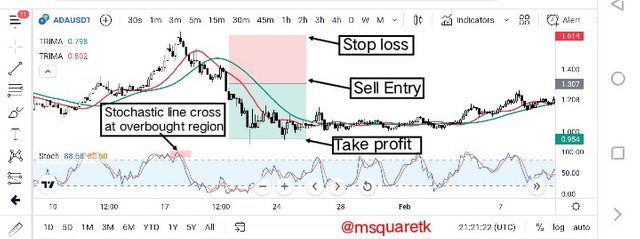
Screenshot from trading view | SOURCE
Looking at the screenshot above, you will see that Stochastic lines crossed at the overbought and shortly we saw a bearish crossover on TRIMA and the price rallied to the downside.
7. Place a Demo and Real trade using the TRIMA reversal trading strategy (combine RSI). Ideally, bullish and bearish reversals. Utilize lower time frames with proper risk management. (Screenshots required).
In this part of the task, I'm going to be taking two trades, bullish and bearish with a demo and real account using TRIMA strategy. Let's start with a bearish trade.
Sell Real Trade (ZECUSDT)
For this sell trade, I'm going to be using trading view platform for the analysis and binance exchange app to place the real trade. Thanks pair i will trade is ZECUSDT. Upon opening the chart of ZECUSDT to 15 minutes timeframe, the price was seen in an uptrend and looking at the RSI indicator window, it shows overbought which is a signal for reversal.
Then, having seen that, the next thing to take note and look for is the crossover of the TRIMA lines. Look at the TRIMA indicators, I saw cross over occur. The shorter time period TRIMA (red line) has crossed below the longer period TRIMA (green line). This also confirms the signal received from RSI. Then, after this crossover, we wait for at least two or three candles to form before taking the entry. See the screenshot below.
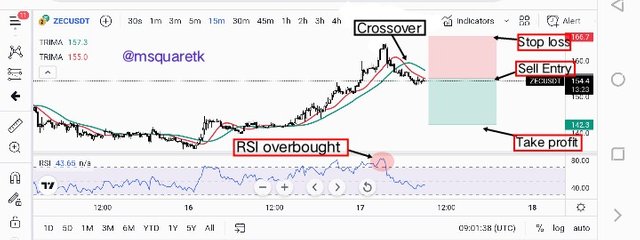
Screenshot from trading view | SOURCE
Seeing this, I placed a sell entry at $154.43 and stop loss was placed above the high created at $166.7 and take profit was set to have a risk reward of 1:1. It's placed at $142.3. Having these orice entry and exit levels from trading view, I opened the real trade on my binance exchange app using margin trading option and set everything accordingly. See the screenshot below.
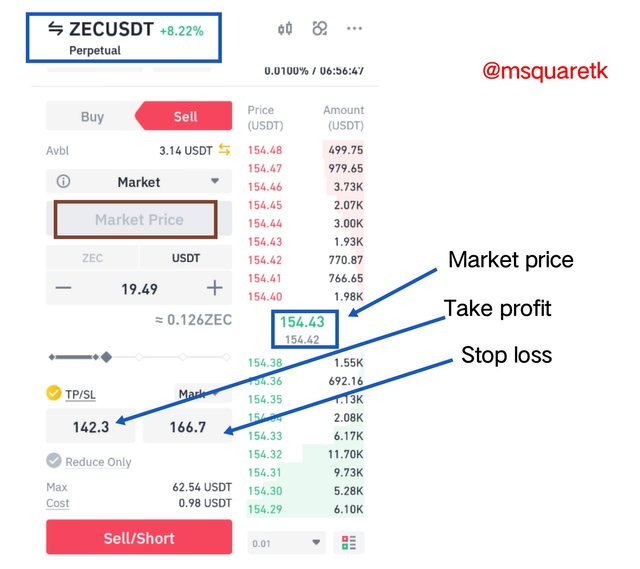
Screenshot from Mt4 App
Then, the screenshot below shows the trade, ZECUSDT running. I will monitor this trade and see how it ends.
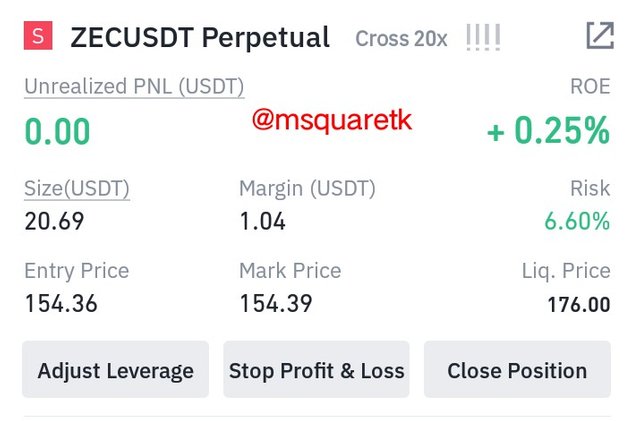
Screenshot from my Binance App
Now having seen the real sell trade, let's quickly see the buy demo trade.
Buy Demo Trade (BTCUSD)
For the buy demo trade, I'm going to be doing the analysis on trading view platform and the demo trade on my mt4 app. Upon opening the chart BTCUSDT, i saw that the market was in a a bearish trend, the sellers took over the market for sometime. But at that time, RSI indicator has entered the oversold region. This is a signal for bullish run.
The next thing to look for after seeing that the RSI has entered oversold when trading the bullish reversal is the TRIMA crossover. So, I checked the lines of TRIMA and I saw that the shorter period TRIMA (red) has crossed above the longer period TRIMA (green). Then we will wait for two or three candles to form after the cross over to take our buy trade. See the screenshot below.
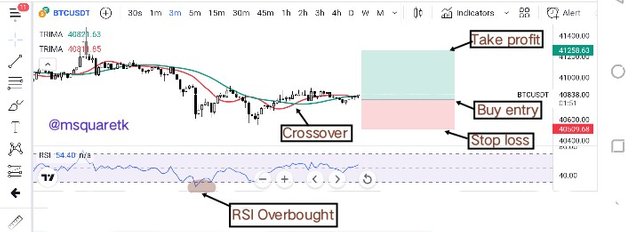
Screenshot from trading view | SOURCE
Then seeing that all criteria are met, I opened a buy position at $40955.05 and the stop loss was placed below the low created at $40539.69 and take profit was set to have a risk reward of 1:1 at $41258.63. Having these price levels entry and exit, I opened an instant buy execution on mt4 with everything set appropriately. See the screenshot below.
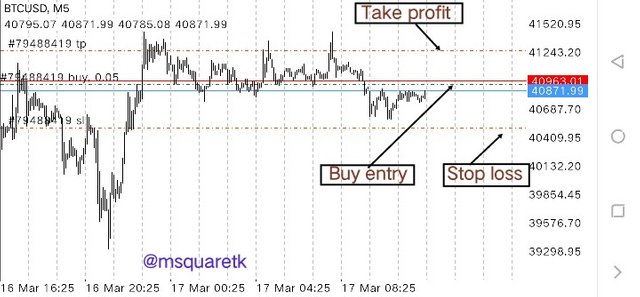
Screenshot from my Mt4 App
Then the screenshot below was taken after the execution of the buy trade. It shows the running trade of BTCUSD
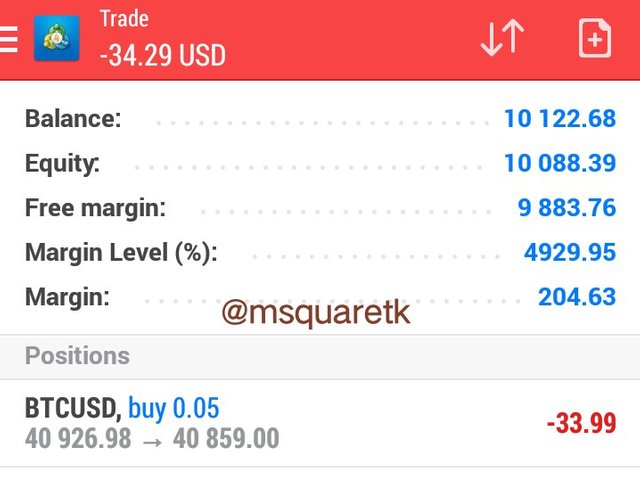
Screenshot from my Mt4 App
8. What are the advantages and disadvantages of TRIMA Indicator?
Here, I'm going to be stating that advantages and disadvantages of TRIMA indicator. Let's start with the advantages.
Advantages
- TRIMA indicator is a variance of simple moving average which was developed to overcome the limitation of SMA. It's smoothed by averaging the price double.
- Unlike SMA which reacts quick to price fluctuation and volatility, TRIMA doesn't react quick to price change. Hence, it is suitable for both volatile and non volatile pairs.
- TRIMA is a trend-based indicator which is used for trend identification in the market.
- The crossover of two TRIMA indicator combined together gives buy and sell signal in the market.
- Combining other technical indicator such as RSI increases its effectiveness and success rate.
- The indicator is very easy to read and its calculation is simple to understand.
Disadvantages
- Like all other moving averages, TRIMA also give false signals.
- It reacts very slow to the price. Hence, trend would have almost finished before it defects a change in trend.
- TRIMA can't be used as a standalone tool. Hence, traders combine other technical indicators to increase its efficiency.
Conclusion
TRIMA indicator is a variance of simple moving average which was developed to overcome the limitations of quick reaction to price of SMA. It does this by averaging the price twice. The indicator is a trend-based indicator which shows the trend which an asset is in the market. It can be used to trade reversal when it's combined with other technical indicators, especially momentum-based ones.
It's advisable not to use TRIMA as a standalone tool for predicting the direction of price because it's a lagging Indicator. Combining other technical tools or indicators will definitely increase its efficiency and success rate. Thanks to Prof. @fredquantum for this insightful and educative lecture on TRIMA indicator.
CC: @fredquantum
Written by @msquaretk