Strategy and use of Donchian Channels - Crypto Academy / S5W1 - Homework post for @ lenonmc21
Cover Page created by me, @msquaretk | created with imarkup app
The season 5 of the Steemit Crypto Academy has started already. This post is written in response to Professor @lenonmc21's assignment. He taught "Strategy and use of Donchian Channels". He explained Donchain channel indicator very well, the use and interpretation of it and the strategy used to trade with it. Then, after his lecture, he gave theory and practice questions. I will be taking these questions one after the other in he next paragraphs. So, follow me closely.

THEORY
1. Explain and define in your own words what the Donchian Channels are?
Donchain Channel is a technical indicator developed by a popular man called Richard Donchain. The man was born in the 1950 and is often regarded as the father of trend monitoring. He made many ground in the futures market and, looking for a way to determine the volatility in the market, he created the indicator.
Donchain Channel indicator is an indicator that is used to measure volatility of an asset as well as for determining the trend reversal. It is very similar to a popular indicator called Bollinger band. However, some differences exist between the two. Like Bollinger bands, Donchain channel indicator comprises of three lines. These lines are called lower , middle and upper bands.
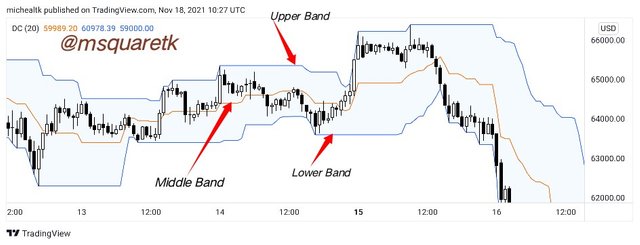
Donchain channels
Image Source
These bands help to determine the volatility in the market. When the volatility in the market is high, the bands would be seen expanded. And on the other hand, when they are contracted, it means the volatility at that particular is very low. In addition, when price is at or touches the upper band, there's probability that the price is overbought and when price touches the lower band, it may mean that price is oversold and trend may reverse.
The channel is formed from the highest high and lowest low of the last particular period. The period could be daily or weekly. And because the period is used, candlestick chart is most used for the indicator because of its effectiveness as there will a clear mapping and data are clearly shown.
I need to balance my writing. Remember, I said earlier, that when price touches a lower band, trend may reverse because it may mean that price is oversold, and when price touches upper band, trend may reverse to downtrend. But it is not always the case because during a very strong trend, that's when the market is trending with a great momentum, price may stay at these bands and the trend may just continue in the direction of price. So, it's pertinent to be careful of this.
2. Explain in detail how Donchian Channels are calculated (without copying and pasting from the internet)?
Here, I am going to be explaining how Donchain channels indicator are calculated. In the previous question, I have explained what the indicator is used for and how it came to be. Now, I'm going to quickly explain how it's calculated. Remember that I said the indicator comprises of three lines which are lower, middle and upper bands.
The first thing to know is that, these lines are calculation generated from moving averages. The middle line or band is the average of the upper and lower bands. The upper band is the highest of price over a particular period of time. While lower band is the Lowe's price of an asset of a certain period. This period could be weekly or daily. But, lower periods like H1, M15, etc. could be chosen depending on the traders choice.
The difference between the upper and lower band forms the area of the channel. Now, to know the upper band, the lower band which will form the lowest of the channel is calculated by choosing a particular and likewise the upper is calculated in the same way. When these two bands, lower and upper band are known, then the middle band is calculated dividing the summation of lower and upper band by 2.
Now, to calculate this, firstly, you need to select period. Let's say we are choosing period of 20days. This means, we are going to calculate the highest high and lowest low within this period which is going to be our upper channel and lower channel, respectively.
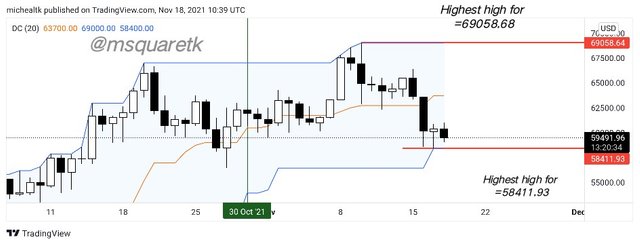
Calculating Donchain channels
Image Source
Now, I have chose 20days as my period.
Therefore, according to the screenshot and my assumption:
N =20days
UBC = $69058.64
LBC = $58412.94
Note: These parameters are chosen based on the period chosen and are highest and lowest points for the period
Where N = period
UBC = upper band channel
LBC = Lower band channel
Now, to calculate the lower band, we can sum the UBC and LBC and divide by two since it is the average of these.
Lower band = UBC + LBC / 2
= (69058.64 + 58412.94)/ 2
= 127471.58 / 2
= $63735.79
Therefore, lower band for that period is $63735.79
3. Explain the different types of uses and interpretations of Donchian Channels (With examples of bullish and bearish trades)
In this part of the task, I am going to be explaining the various uses and interpretation of Donchain channels. Now, let me begin by saying that, the use cases is very pertinent and traders need to know it's been used. There are about three ways which can use and interpret this indicator. It can be used to determine the volatility, overbought and oversold region and trend and zone breakout. Let's start with the volatility.
VOLATILITY
One of the significant uses of Donchain channels indicator is for determining the volatility of an asset. In fact, if a trader is using this indicator, one of the things to look out for is to know how volatile and asset is. When the bands of Donchain channels are very close to each other, that's when they contract, it means the volatility of that asset is low. While the volatility becomes high when the bands are seen expanded or widened. Traders who know how to read this will take advantage of the volatile market and catch pips out of the market. Because there's no money in the market that has low volatility, since there won't be much movement in the market.
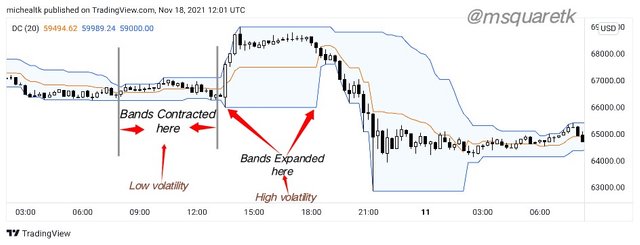
Donchain channels showing low and high volatility
Image Source
OVERBOUGHT AND OVERSOLD
Donchain channels indicator can also be used to determine when the price is overbought or oversold. And this is how to interpret it: when the price of an asset touches the upper band channel, it's often regarded as the overbought region. Traders believe that buyers have accumulated the asset for a long time and the price has now reached peak. At this time, sellers may come in to the market because price may reverse leading to a change in trend to the downside. On the other hand, when the price touches the lower band channel, it may mean oversold and the sellers may be forced out of market while the buyers take over, and trend change form bearish to bullish.
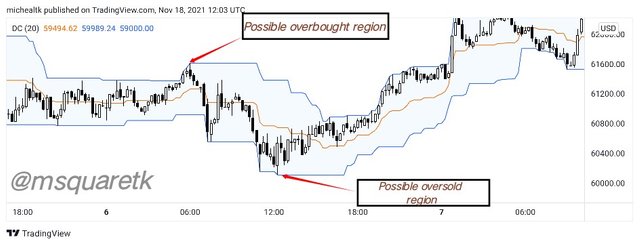
Graphical representation of possible overbought and oversold
Image Source
STRONG TREND AND ZONE BREAKOUT
In the previous paragraph, I said when the price touches the upper and lower band, it indicates overbought and oversold region, respectively and that trend may reverse. However, it is pertinent to know that during a strong trend, price may continue in the direction. For example when market is trending with a strong momentum to the upside, the price will be seen to break the upper band of the channel and price sticks to this band and continue to rally up. This means, the place where the price breaks may be a resistance and price still continue to rally up. In the same way, it may happen to a strong trending market for a bearish market. Price will break the lower band and still adheres or sticks to it while price keeps rally to the downside. See the screenshot below for a bullish market.
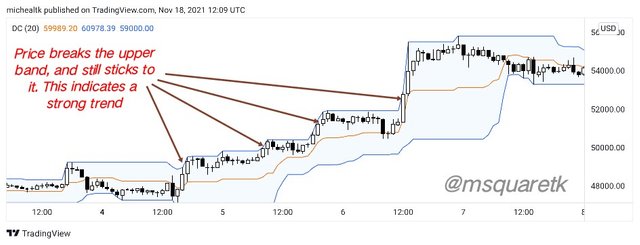
Graphical representation of Strong Trend in a bullish Market
Image Source
Also, let's see another screenshot below for a strong trend in a beautiful market.
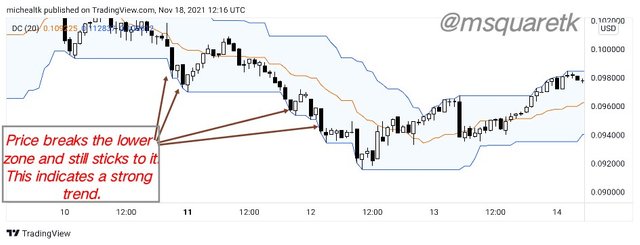
Graphical representation of Strong Trend in a bullish Market
Image Source
PRACTICE
Make 1 entry using the "Donchian Channel Breakout Strategy" and make 1 entry using the "Reversal and Retracement Strategy" . You must explain the step by step of how you analyzed to take your entry and make them into a demo account so I can evaluate how the operation was taken
In this part of the task, I am going to be making use of the knowledge of Donchain channels indicator to make at least two entries by using channel breakout strategy and reversal and retracement strategy. Let's start with the first one.
Entry using Donchain channels breakout strategy
This strategy is used during a very strong trend. When the price touches the lower or upper band and breaks it and still sticks to the price. To use this strategy to place a long entry, there must be a break in the upper channel which shows that the bearish momentum is over. In the same way, to place a short entry, the lower band must be broken, indicating that the bullish run is over.
I'm going to be placing a short entry on the chart of XPRUSD. My indicator channel is set to 20 length. Now, the price is seen going to the upside with a series of Higher highs and higher lows. But it came to a certain time that price reversed, touched the lower band and broke it. This time, we already know when the price does this, there's a strong trend as the price adheres or stick to the lower band. See the screenshot below.
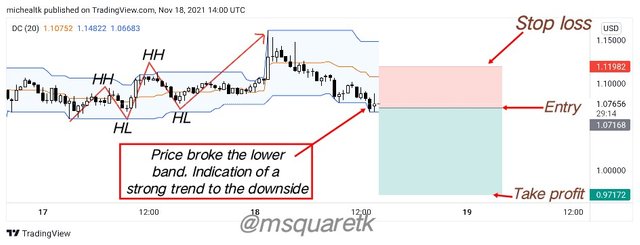
Short Entry using Channel breakout strategy on XPRUSD
Image Source
As all condition is met, I placed a sell entry using my MT4 app with stop loss above the candle that broke the lower band and take profit was placed to have a risk reward of 1:2. That's, if the trade goes in my direction, I will have double of what I am risking.
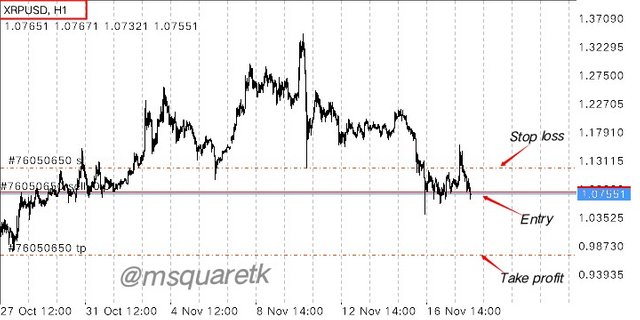
XPRUSD Chart showing TP, SL and entry | MT4 APP.
The screenshot below shows the XPRUSD when i first took the trade.
XPRUSD: The running trade | MT4 APP.
Entry using Reversal and Retracement strategy
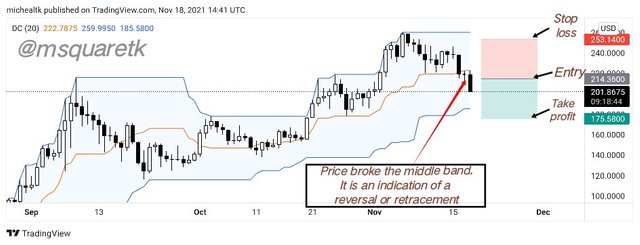
This strategy involves taking advantage of the price reversal or retracement during a trending market. We know that when price moves in certain direction, there will be a time when it will pull back or change totally in trend. Now, when the price breaks the middle band downward during a bullish trend, it usually signifies a retracement or reversal. And a short position will be taken after the close of the candle that breaks the middle band.
On the other hand, during a bearish trend, if the price breaks the middle band upward, a long position is taken after the close of the candle that breaks the middle band.
Here, I am going to be placing a sell entry on the chart of ETHBTC and SOLUSD. Let's see see entry on ETHBTC first.
ETHBTC Sell Entry
When I opened the chart of ETHBTC, the current trend is bullish. And of course we know that to use the strategy for a short position, the middle band must be broken downward. So, after some times, price broke the middle band. Which is a signal for retracement or reversal. See the screenshot below.
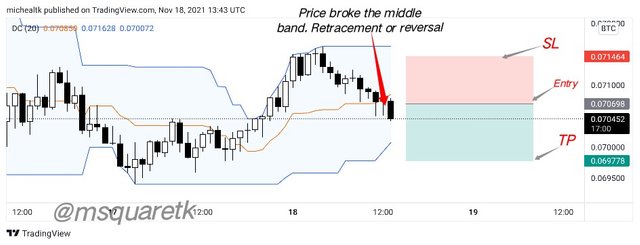
Short Entry using Reversal and Retracement on ETHBTC
Image Source
As it can be seen in the screenshot, the price broke the middle band. As soon as I saw this and the candle that broke I closed, I entered a sell entry with stop loss placed above the middle band and stop loss was placed to have risk reward of 1:1. This means, if the trade goes in my direction, I will make the same amount of my risk.
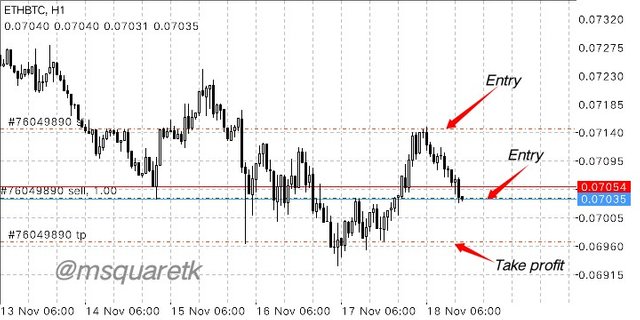
ETHBTC Chart showing TP, SL and entry | MT4 APP.
This is the ETHBTC when I first took it. This is immediately after I placed the trade. I am still going to be showing how I goes as time goes on.
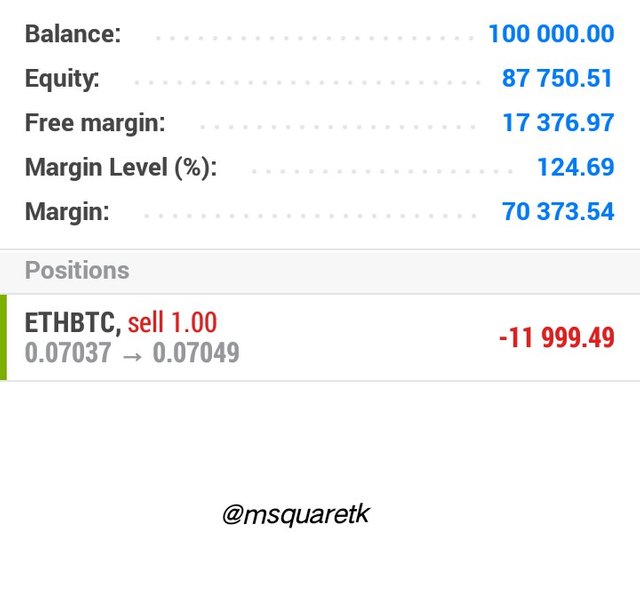
ETHBTC: The running trade immediately after I placed the trade. | MT4 APP.
Now, let's see one more sell entry using reversal and retracement strategy.
SOLUSD Sell Entry
Now, I am going to be explaining how I took the trade.
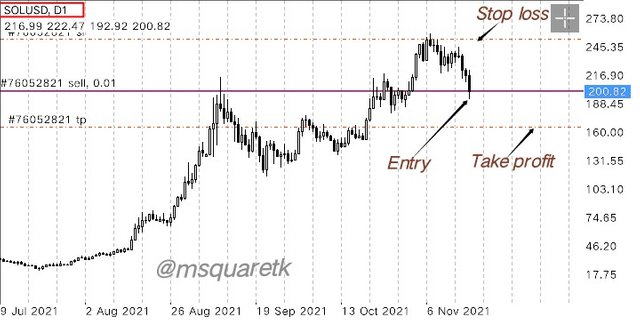
The price is seen making higher highs and higher lows. This means that the trend is bullish. But after some times, the price broke the the middle band signifying that reversal or retracement is about to happen. See the screenshot below.
Short Entry using Reversal and Retracement on SOLUSD
Image Source
As soon as the candle that broke the middle band closed, I placed a sell entry with stop loss above the band and take profit was set to have a risk reward of of 1:1.
SOLUSD Chart showing TP, SL and entry | MT4 APP.
Now, the SOLUSD trade when I placed it is shown below.
SOLUSD: The running trade immediately after I placed the trade. | MT4 APP.
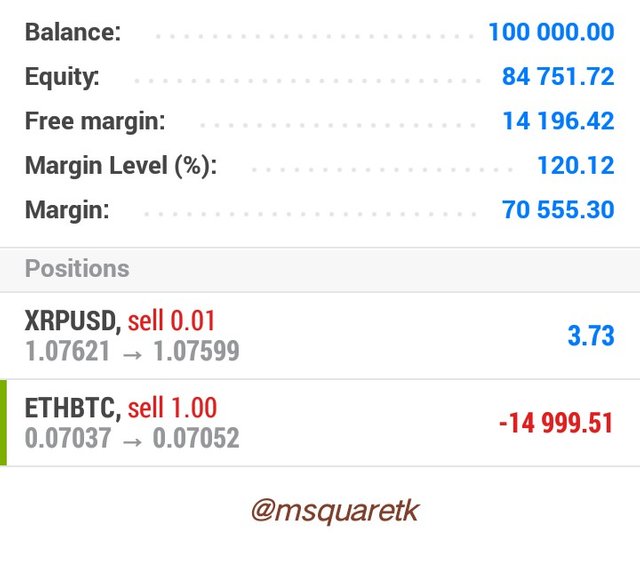
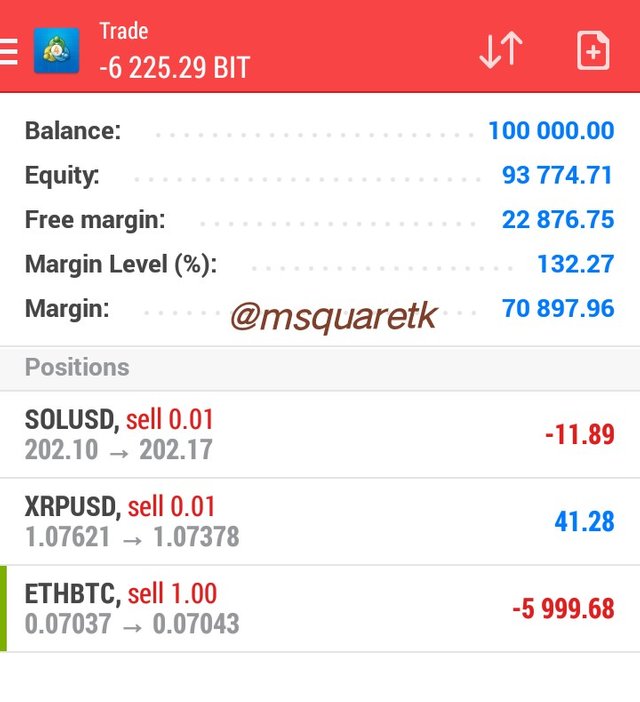
Now, few hours, about 1 hr after I placed the first trade, they are all have been doing very fine. That's XPRUSD, ETHBTC, and SOLUSD are going in the direction predicted. See the screenshot below.
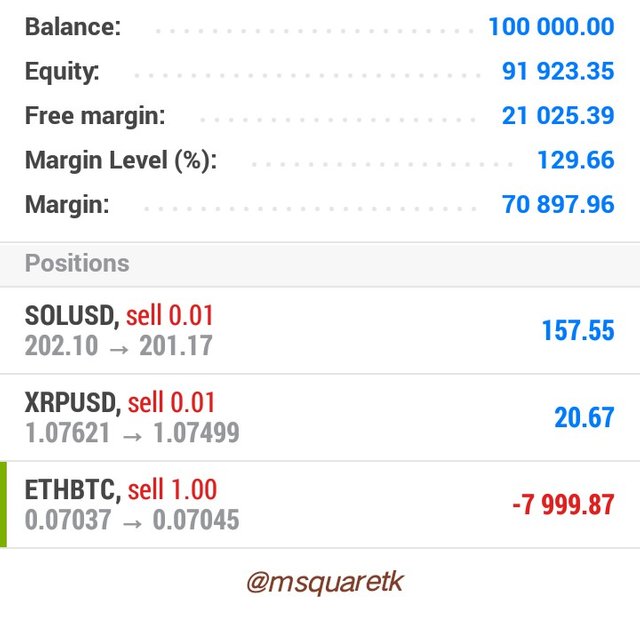
XPRUSD, ETHBTC and SOLUSD running trades after 1hr of execution of the first trade | MT4 APP.
Then, about 2hrs after the execution of the first trade, I checked. The trades have increased in profit. See the screenshot below.
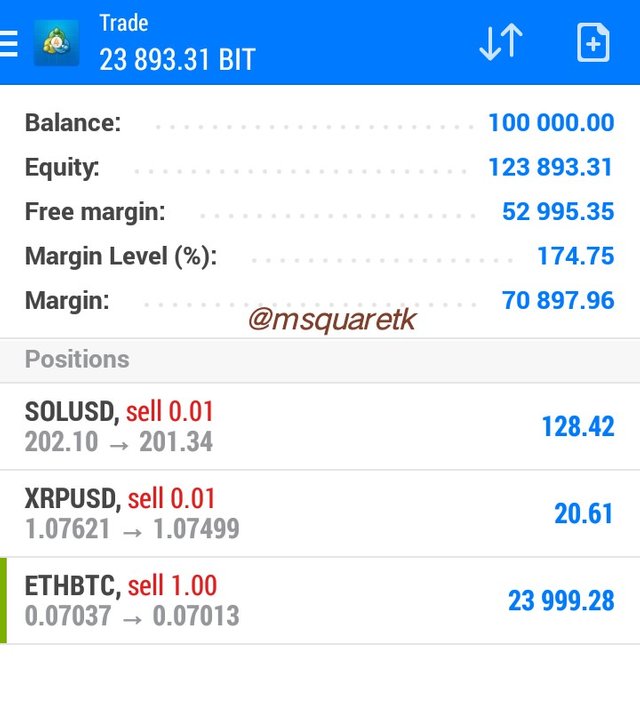
XPRUSD, ETHBTC and SOLUSD running trades after 2hrs of execution of the first trade | MT4 APP.
Also, the screenshot below shows the trades 4 hours later.
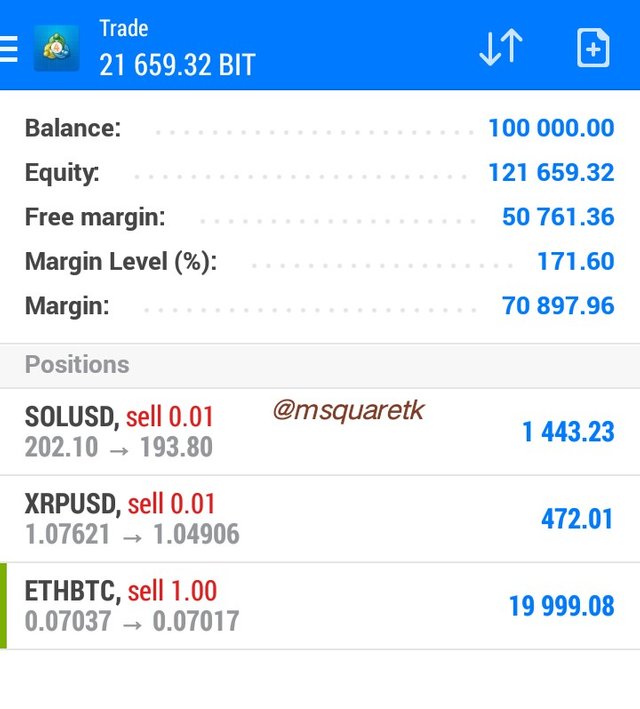
XPRUSD, ETHBTC and SOLUSD running trades after 4hrs of execution of the first trade | MT4 APP.
As it can be seen, the trades are doing well. ETHBTC has almost hit TP, XRPUSD is halfway the take Profit. SOLUSD still has long way to go, but it's doing well.
And some hours later, ETHBTC hit take profit. See the screenshot below. The remaining two trades, SOLUSD and XRPUSD are still running.
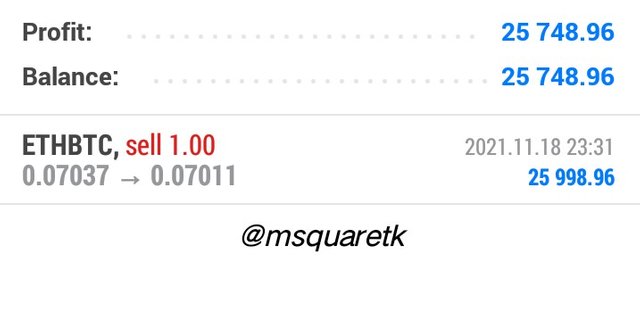
ETHBTC hit take profit | MT4 APP.
Conclusion
Technical indicators are one of the tools we can use to predict the price and take advantage in the market. Donchain channels indicator is an indicator which is very useful to determine or measure the volatility in the market. The indicator also shows when the price is overbought and oversold.
It is important to know that as technical indicators are good and can help us predict the market, they are not to be used as a stand alone when analysis the market. So, Donchain channels also should not be used alone. Combination with other price action strategies, lile chart pattern, candlestick pattern etc will increase the success rate.
Attending Professor @lenonmc21 has greatly helped me understand how they use this indicator, Donchain channels. And I have been able to explain the indicator, state uses cases and interpretation and even use the knowledge of its strategies to place demo trades. Thanks to our Prof., @leneonmc21.
NB: All unsourced images or screenshots are taken from my MT4 app.
CC : @lenonmc21
Written by @msquaretk