Crypto Academy Season 3 Week 2 - Homework Post for professor @cryptokraze by @nathan27
Crypto Academy Season 3 Week 2
Homework Post for professor @cryptokraze
This week we will talk about market structures and what strategies we must follow to operate in these markets, it is important to keep in mind that these strategies have been used for years so through their practice it is proven that it does work if you are new to the world. I recommend this reading, remembering that this is an assignment from the crypto academy of the class of professor @cryptokraze
What do you understand about Market Structure?
This structure is a pattern that occurs in the price charts that is continuously repeated and this is because, as we already know, people act on impulses and are easily predictable, then thanks to these emotional impulses and other times simply because they collect the Acting from other people creates these patterns or structures which helps us understand how the current market will act.
Thanks to these repetitive structures, small predictions can be made that will help us in the future when it comes to trading, to understand these structures we must understand that there are 3 possible easily identifiable patterns on the price chart and these are:
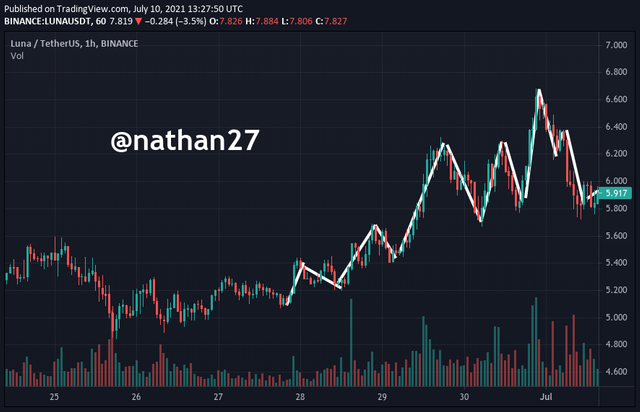
Bullish Trend : In this trend the price is constantly increasing, with small setbacks but these setbacks never exceed the previous price, what it does is that in the price chart as it increases, it creates a kind of zic-zac always ascending until reaching an easily identifiable maximum level since the last setback becomes somewhat exaggerated and that is when we recognize that a change in trend is possible.
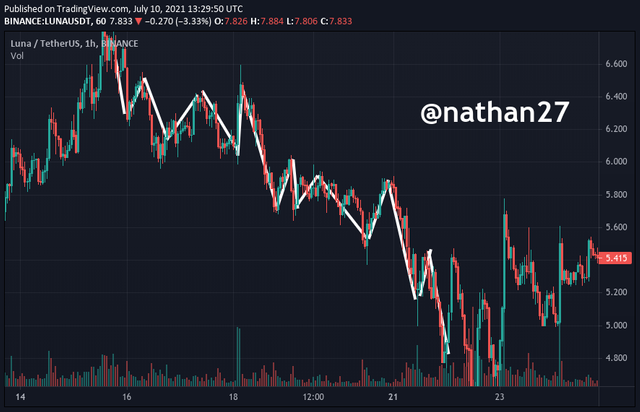
Downward Trend : In this particular trend, the price chart shows us a zic-zac downwards as if they were a ladder, the peculiarity of this is that it is always descending which indicates that the price of the asset in This question is being sold at lower prices each time, which makes it push its price to the ground each time, in order to know that it has reached its lowest maximum, it is observed if its recovery exceeds more than 100 percent of its previous price since If this is above, it is said that a change in trend is approaching, of course this measure is not always accurate but it is very common to see it in the price chart.
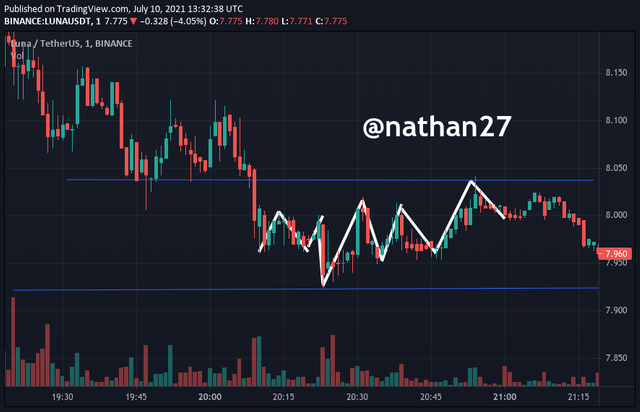
Laterality: In this movement that the price chart makes, it shows lateral movements where the price has small fluctuations on the side but without major changes, this happens when the large whales are in the process of accumulation or when the price of an asset in question is consolidating.
What do you understand about Lower High and Higher Low? Please provide examples of crypto asset charts.
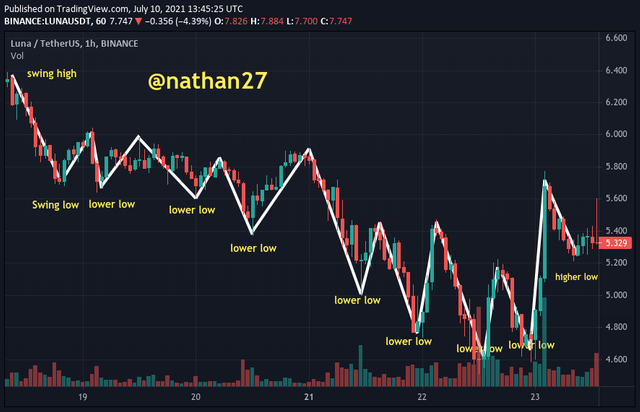
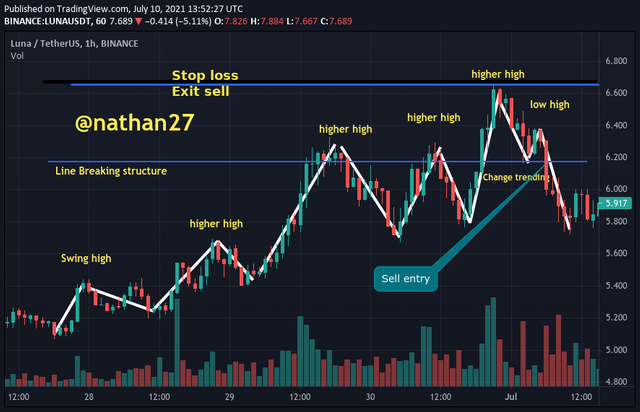
The lower high is a term used when in an uptrend to identify the price retracement zone just before a trend change. It is called this way because if a bullish structure is observed, this Lower High can be observed since a retracement occurs that sometimes there is a retracement of the price that exceeds more than 80% of the previous price and is clearly observed in the following graph .
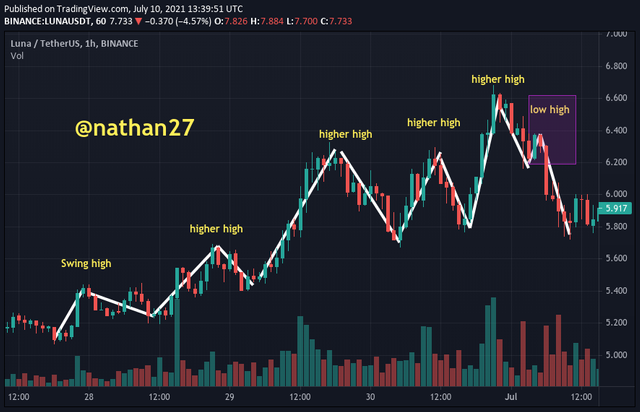
Higher Low It is a term used when it is in a downtrend to identify a recovery zone of the price just before a change from downtrend to bullish, It is given this name because in a bearish structure it is observed how the price has a recovery that sometimes exceeds 100% of the previous price and is a clear sign that a change in trend is approaching, and this is the point where you enter the market to operate.
How will you identify trend reversals early using Market Structure Break?
Each structure, whether bullish, bearish or lateral, has its basic characteristics that tell us which way to go if we are trading, all these structures follow a pattern that is easily predictable which gives us clues on how to operate in the market, and thanks to this we can observe messages that give us a clear signal of change in trends or price consolidations.
In uptrend:
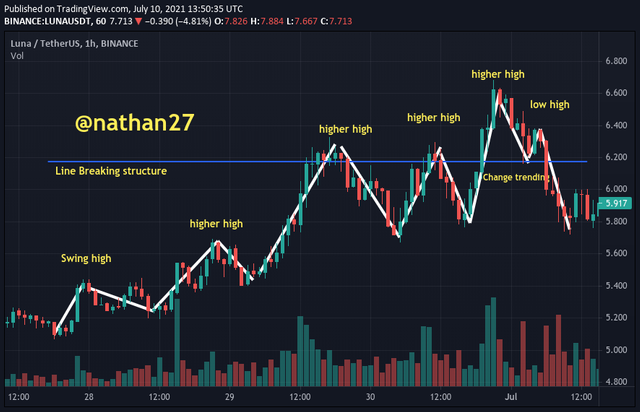
It is important to observe the zic-zac in price increase and wait for the asset to reach its maximum price.
Observe the retracement of the price if it exceeds more than 50% of the previous price in its retracement and then its recovery does not exceed the maximum point, we must be careful since a change in trends may be approaching, we can also rely on the RSI chart since if it marks an overbought this will be the clear signal of the trend that will now dictate the downward trend.
It is also important to observe the volume of transactions, although we are talking about market structures it is also important to support ourselves with other markers to confirm our hypotheses.
The confirmation is made if in the next retracement it exceeds the last lowest registered price.
In downtrend:
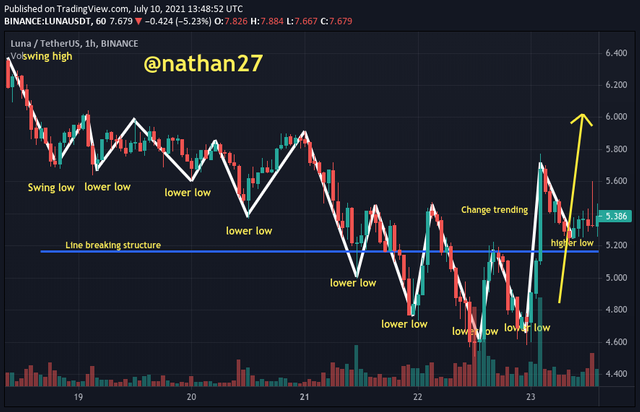
Observe the price chart and wait for it to reach its lowest point, when the asset has a price recovery higher than the penultimate point of the zic zac is indicative that a change in trend is approaching.
The confirmation is made if in the next recovery it exceeds the price of the last registered recovery.
Explain the entry and exit criteria for transactions on any crypto asset using any time frame of your choice (screenshots needed)
These criteria are a series of pre-designed rules in the form of a strategy that by following them to the letter you can get in or out at optimal levels and thanks to this you can increase profits or reduce losses.
MSB Strategy:
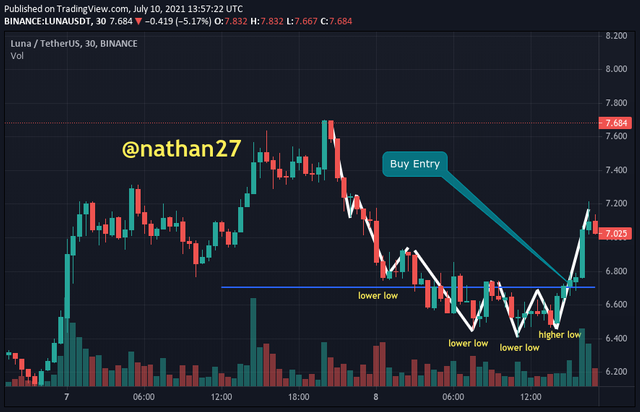
- First of all we check that the market is in a downtrend.
- We must observe that the structure of the price of the asset that we are observing registers a structure of the highest low price
- At this point we should mark a horizontal line on the structure at the highest low point
- Observe where the asset price is meeting resistance from several periods.
- Wait for the breakdown of the market structure.
Strategy to go short.
This strategy is done only if you want to trade short on any asset.
Observe if there is a tall lower structure.
Create a horizontal line at the corner level below the upper lower level.
Wait for the breakdown of the market structure and a confirmation with pronounced candles.
Sell at levels just below the level of the previous corner and place a stop loss above the lower levels.

Rules for MSB strategy
Opting for a ticket in the right place is essential when it comes to trading and that our operations are successful, as well as knowing when we should abandon and sell.
In this strategy there are two types of exits in an operation, the first is when everything is against us and we have losses and we must reduce these losses.
The other is when our goal is being achieved and everything is perfect but since prices do not rise or fall forever, we must know when to withdraw and collect our profits.
Exit strategy for losing trades.
We must be clear about what our Risk will be - Reward (RR) that must be at least 1: 2 although others use 1: 1 to be safer
Configure our stop loss to avoid major losses, since our objective is to obtain profits and the market is sometimes unpredictable, and at that moment that we are losing the stop loss will save us our money.
This stopp loss must be configured according to the type of operation we are performing.
If things do not go well and the losses begin as soon as the price touches the stop loss, we will exit the market.
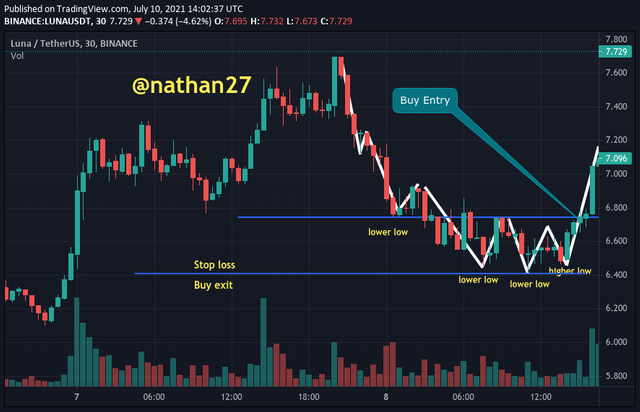
Selling
- The configurations and strategy to follow are the same but we set the stop loss for sale.
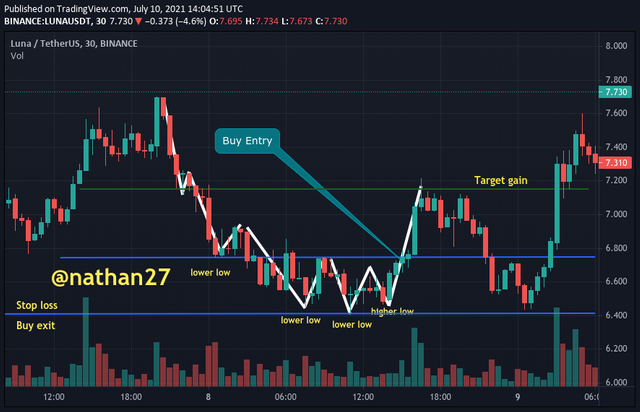
Strategy To carry out operations and obtain profits.
We must know how much will be the level of profit that we will have and know the risk-reward ratio I would recommend 1: 1
Obviously we must exit trading as soon as we achieve our goal.
Perform 2 demo trades on crypto assets using the market structure breakout strategy You can use a lower time frame for these demo trades (screenshots needed)
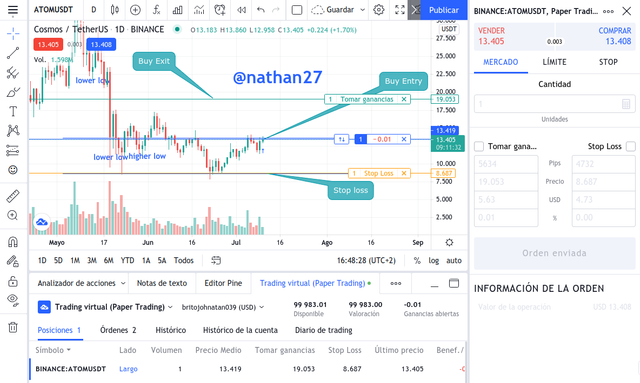
Cosmos / USDT
I am taking long periods of 1 DAY
Currently there is a laterality in the pair, so I will configure my entry to 13,419 usdt to enter to trade
I will set my exit from the market to 1: 1 because I think I can make a profit on this pair.
I will set the stop loss at 8,687
and the output I have set to 19.053
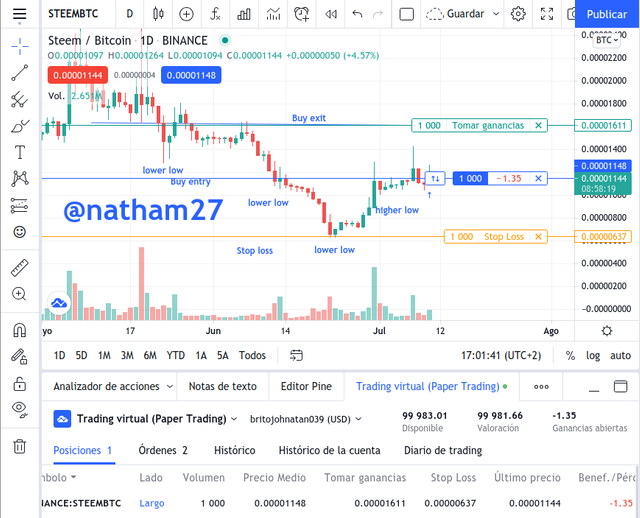
For this other example apply the same loggia on the Steem / BTC pair
I am taking long periods of 1 DAY
Currently there is a laterality in the pair, so I will configure my entry to 0.00001148 BTC to enter to trade
I will set my exit from the market to 1: 1 because I think I can make a profit on this pair.
I will set the stop loss at 0.00000637 BTC
and the output I have set to 0.00001611
Market structures are an excellent way to guide oneself when trading since as they follow behavior patterns for traders it is easy to observe these future changes and it gives us an idea of how to operate in the market thanks to the fact that with them we can anticipate to future events, observing the break points we can know when to enter and when to exit the operations as long as we have our forecasts, so it is always advisable to apply a stop loss to avoid these unexpected losses, and with this achieve the maximum possible profit.
CC: