Steemit Crypto Academy Contest / S20W6 : Trading Steem with the Ichimoku Cloud
Trading
Hello everyone, greetings to you all and welcome to this week's engagement challenge which marks the last contest of this season. I am so excited to be finishing it with one of the amazing contents so far which is trading steem with the ichimoku cloud. Without wasting much time, let's get started.
Question 1: Explain the Five Components of the Ichimoku Cloud
The Ichimoku Cloud is a trading tool that helps you understand market trends, support/resistance levels, and potential price moves. It consists of five main components, each playing a role in giving a clearer picture of the market. Here’s how these components can be used to make trading decisions for Steem:
1. Tenkan-sen (Conversion Line):
What it does: This is a short-term trend line based on the last 9 periods. It’s like a fast-moving average that shows the general direction Steem is heading in the short term.
How to use it: If Steem's price is above the Tenkan-sen, it means the short-term trend is up. If it’s below, the trend is down. When this line crosses the Kijun-sen (explained next), it signals a potential change in the trend.
2. Kijun-sen (Base Line):
What it does: This is a medium-term trend line based on the last 26 periods. It’s slower and steadier than the Tenkan-sen, showing the overall price direction for Steem.
How to use it: The Kijun-sen acts as a strong indicator of where Steem might settle after price fluctuations. If Steem stays above this line, the trend is considered stable and bullish. It can also be used to set stop-loss levels for managing risk.
3. Senkou Span A (Leading Span A):
What it does: This is one of the two lines that make up the “cloud” in the Ichimoku Cloud. It’s based on the average of the Tenkan-sen and Kijun-sen and is plotted 26 periods into the future.
How to use it: The cloud shows areas of support and resistance in the future. If Steem’s price is above the cloud, it signals an upward trend (bullish), and if it’s below, it signals a downward trend (bearish). The thicker the cloud, the more resistance there is to price movement.
4. Senkou Span B (Leading Span B):
What it does: This is the second boundary of the cloud and is slower because it looks at the last 52 periods. It gives a long-term view of support and resistance.
How to use it: A thicker cloud (the distance between Senkou Span A and B) suggests that Steem may face stronger resistance or support. When Steem’s price is above this line, it shows strong bullish momentum.
5. Chikou Span (Lagging Span):
What it does: This line shows the current price but shifted 26 periods into the past. It helps confirm the strength of the current trend by comparing today's price with past prices.
How to use it: If the Chikou Span is above the price 26 periods ago, it confirms a strong upward trend. If it’s below, it confirms a downward trend.
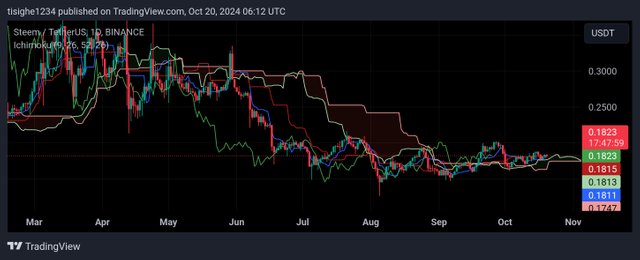
All the components of ichimoku cloud annotated
How This Helps with Trading Decisions for Steem:
Bullish signals: If Steem’s price is above the cloud, the Tenkan-sen crosses above the Kijun-sen, and the Chikou Span is above past prices, it’s a strong buy signal.
Bearish signals: If Steem’s price is below the cloud, the Tenkan-sen crosses below the Kijun-sen, and the Chikou Span is below past prices, it’s a sell signal.
Cloud thickness: A thick cloud means strong support or resistance, while a thin cloud suggests weaker levels of support or resistance.
By looking at these five components together, you get a clearer view of whether Steem is likely to go up, down, or stay steady, helping you make better trading decisions.
Question 2: Analyzing Trend Direction with the Ichimoku Cloud
Using the Ichimoku Cloud to analyze the historical Steem/USDT chart can give a detailed understanding of market trends, helping traders decide whether the market is in an uptrend, downtrend, or consolidation phase. Here’s an in-depth breakdown of how each component of the Ichimoku Cloud interacts with Steem price movements and what kind of trading signals they produce:
1. Uptrend and Downtrend Analysis
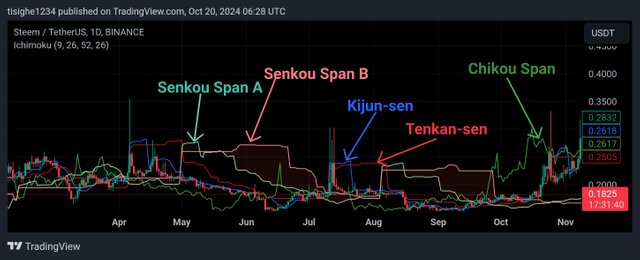
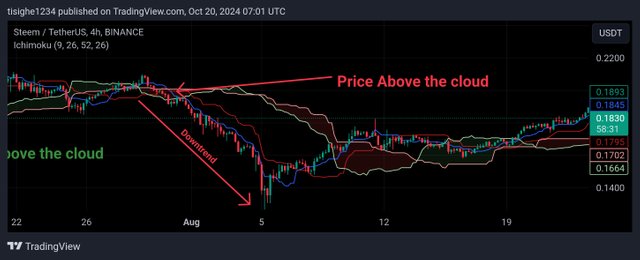
Price above the Cloud: When Steem’s price is above the Ichimoku Cloud, it indicates a strong uptrend. For example, if you look at historical data where Steem’s price was steadily rising above the cloud, it suggests that bullish sentiment dominates the market. Traders typically see this as a buying opportunity, especially if the cloud is thick, suggesting strong support for the price.
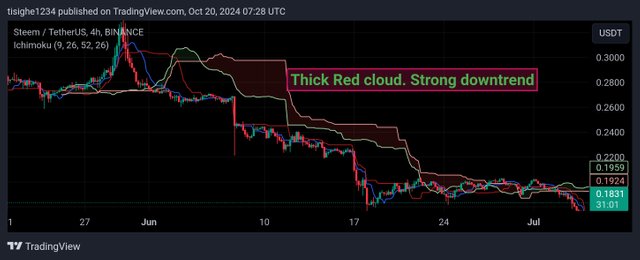
Price below the Cloud: Conversely, if Steem is below the cloud, it signals a downtrend. This suggests that the bears are in control, and the market is likely to continue moving lower. In such cases, traders often use this as a signal to sell or short the token, especially if the cloud below is thin, meaning there is little support to hold the price.
2. Consolidation or Range-Bound Market
Price inside the Cloud: When the price of Steem is within the cloud, it reflects a period of consolidation or indecision. In this phase, the market is not trending clearly in either direction. This is where many traders choose to wait rather than entering trades, because there’s no strong signal. The cloud here acts as a neutral zone. Until the price breaks out of the cloud—either upwards or downwards—the market is considered to be range-bound.
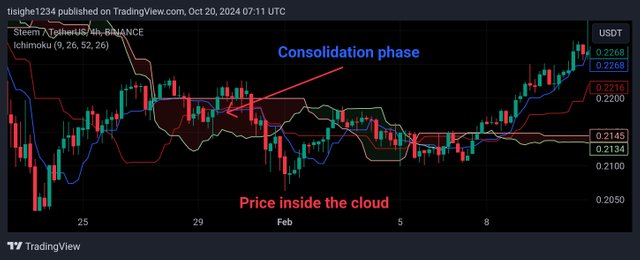
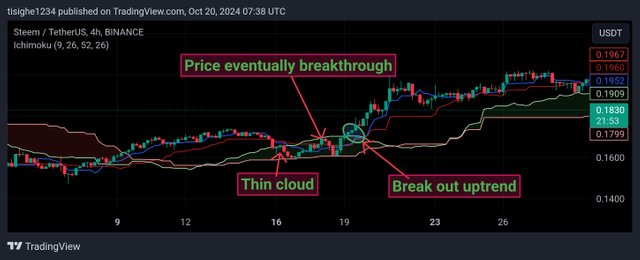
For instance, during historical periods of low volatility, the price might hover within the cloud, signaling a lack of strong momentum in either direction. Once Steem’s price breaks out of the cloud, this could signify the end of consolidation and the beginning of a new trend, providing a fresh opportunity to enter a position.
3. Key Trading Signals: Tenkan-sen and Kijun-sen Crosses
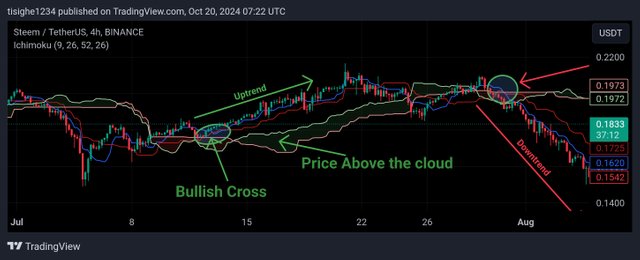
Bullish Cross (Buy Signal): The Tenkan-sen (Conversion Line) crossing above the Kijun-sen (Base Line) when the price is above the cloud creates a strong buy signal. This suggests that Steem is building momentum to continue in an upward direction. For example, in a previous bull run for Steem, traders might have used this crossover, along with the confirmation of the price staying above the cloud, as a sign that it was a good time to enter a long position.
Bearish Cross (Sell Signal): When the Tenkan-sen crosses below the Kijun-sen while the price is below the cloud, it generates a sell signal. This combination of factors indicates a potential downtrend continuation. Historically, when Steem's price experienced this crossover while the price was below the cloud, it could have signaled to traders that it was time to exit long positions or even consider shorting the market.
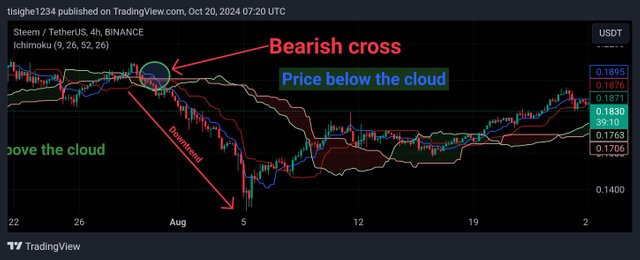
These crossovers, also known as TK Crosses, are central to making trading decisions based on Ichimoku analysis, as they provide strong signals for buying or selling.
4. Cloud Thickness and Trend Strength
Thick Cloud: A thicker cloud represents strong support or resistance, meaning it is less likely that the price will break through the cloud. For Steem, during periods where the cloud was thick and the price was approaching the cloud from above, it acted as a cushion that prevented price from falling lower, keeping the market in a bullish phase. A thick cloud can also indicate higher volatility, so even if the price enters the cloud, traders often wait for clear breaks before acting.
Thin Cloud: On the other hand, when the cloud is thin, it reflects weak support or resistance. In this scenario, if Steem’s price starts to break through the cloud, it’s much easier for the price to continue moving in that direction, which might result in quicker trend reversals. Traders look at these thin clouds as areas of vulnerability in the market structure.
5. Chikou Span (Lagging Span) and Trend Confirmation
The Chikou Span helps in confirming the strength of the trend. This line plots the current closing price shifted back by 26 periods. If the Chikou Span is above the price of 26 periods ago, it confirms that the current trend is bullish. If it’s below the price from 26 periods ago, it confirms a bearish trend.
For example, when Steem experienced a price rally and the Chikou Span was well above past prices, this would have strengthened the conviction in a long position. Conversely, if Steem’s price was falling and the Chikou Span was also trending below past prices, it would confirm the downtrend.
6. Cloud as Dynamic Support/Resistance Levels
Future Support and Resistance: The area between Senkou Span A and Senkou Span B (the cloud itself) acts as dynamic support and resistance levels. When Steem’s price approaches the cloud from above, it often finds support there. If it approaches from below, the cloud can act as resistance.
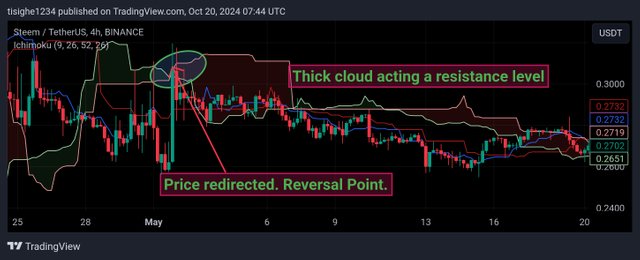
For instance, when the price of Steem fell toward a thick cloud in the past but didn't break through, this cloud acted as a strong support zone. On the flip side, if Steem’s price rose toward a thick cloud and failed to break above it, the cloud acted as resistance, leading to a reversal back down.
In summary, the Ichimoku Cloud offers a complete framework for analyzing the Steem/USDT market trends, identifying buying and selling opportunities, and understanding the broader price dynamics. By looking at the Tenkan-sen and Kijun-sen crosses, the position of the price relative to the cloud, and the thickness of the cloud, traders can make well-informed decisions. Additionally, the Chikou Span helps confirm the overall trend strength, making it a versatile indicator in Steem trading.
Understanding these signals can lead to more profitable trading strategies, whether Steem is trending upward, downward, or stuck in consolidation.
Question 3: Identifying Support and Resistance Levels with Ichimoku
The Ichimoku Cloud is highly effective at identifying support and resistance levels, especially through its dynamic nature, as it adjusts to price action over time. These levels are primarily determined by the Senkou Span A and Senkou Span B, which form the upper and lower boundaries of the cloud. Here’s how the cloud provides support and resistance, and an example using Steem’s price action:
Support and Resistance in the Ichimoku Cloud
1. Cloud as Support:
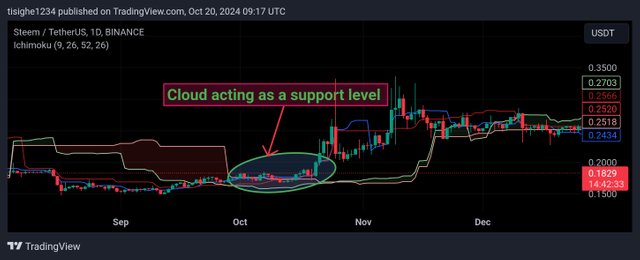
When Steem’s price is above the cloud, the area between Senkou Span A and Senkou Span B (the cloud itself) acts as a dynamic support zone. The price is more likely to bounce off the top of the cloud, or off the lower edge, when it retraces from a bullish move. This is because the cloud represents historical price movements averaged over specific periods, which traders view as a collective buffer for price dips.
2. Cloud as Resistance:
When the price is below the cloud, the same area acts as resistance. The cloud provides a ceiling, which prevents the price from breaking through. This is especially true if the cloud is thick, which shows strong resistance. If the price approaches the cloud from below but does not break through, it usually signals that the trend will continue downward.
3. Cloud Thickness:
The thickness of the cloud is crucial. A thick cloud indicates stronger support/resistance, making it more difficult for the price to break through, while a thin cloud suggests weakness and is easier for price to breach.
Example of Steem Price Action with Support and Resistance
Let’s look at a real example of how the Ichimoku Cloud acted as dynamic support and resistance in Steem’s price action:
In an uptrend (historically in Oct 2023), Steem’s price was moving above the cloud, and when it pulled back, it tested the upper boundary of the cloud (Senkou Span A) multiple times but did not break below. This acted as support. The cloud acted like a trampoline, pushing the price higher each time it touched the cloud, signaling that the bullish trend would continue.
Interpretation:
When traders saw that the price was bouncing off the cloud and staying above it, they would have been confident that the trend was intact. This would have presented a good buying opportunity during the retracement phase.
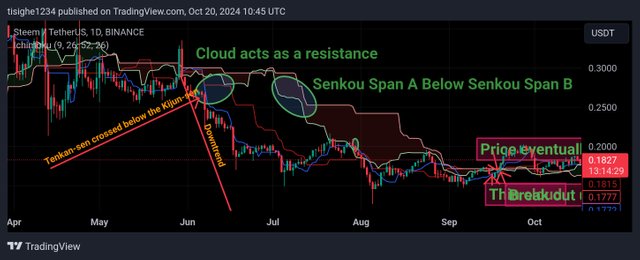
In a downtrend (later in June 2034), as the market shifted bearish, Steem’s price moved below the cloud. The cloud acted as resistance during attempted recoveries. For instance, as the price climbed back toward the cloud, it got rejected at the lower boundary (Senkou Span B) and failed to break through. This indicated that the bearish trend would continue.
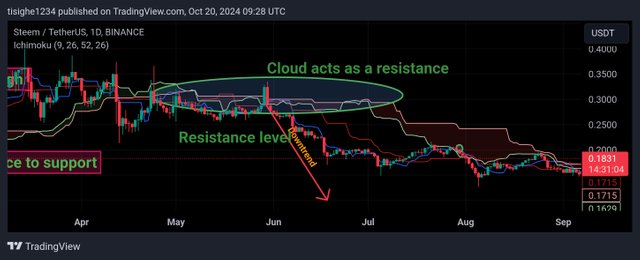
Interpretation:
Traders recognizing this rejection at the cloud could interpret this as a sell signal or continue holding short positions, anticipating a continuation of the downtrend.
Predicting Reversals or Continuations
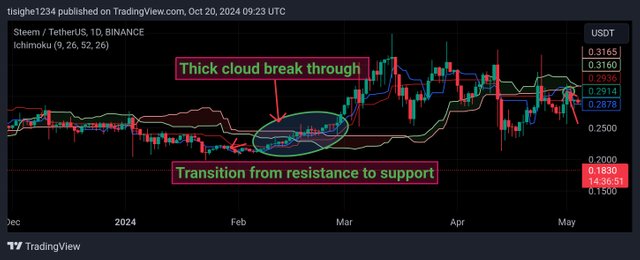
*Reversals: When the price breaks through the cloud—whether from below in a bearish trend or from above in a bullish trend—it often signals a reversal in the existing trend. For example, if Steem’s price had been trading below the cloud and then successfully breaks through and closes above it, this suggests that the bearish trend is reversing, and a new uptrend may begin. The cloud then transitions from resistance to support.
Continuations: If the price fails to break through the cloud and instead bounces off it, this indicates a continuation of the current trend. For example, if Steem’s price is in a downtrend and fails to break through the cloud from below, it signals that the bearish momentum remains strong, and the trend will likely continue downward.
 continuation.
Key Points to note:
The Ichimoku Cloud’s ability to dynamically adjust based on historical price movements makes it a powerful tool for identifying support and resistance levels. By watching how the price interacts with the cloud, traders can predict reversals or continuations of the trend and make informed trading decisions. In Steem’s historical price action, both the cloud’s support in bullish phases and resistance in bearish phases have provided reliable signals for traders to buy or sell accordingly.
Question 4: Trading with the Ichimoku Cloud
Ichimoku Cloud Trading Strategy for Steem (STEEM/USDT)
This strategy focuses on using the Ichimoku Cloud to identify trend direction, entry and exit points, and confirm signals for the Steem token. The core of the strategy revolves around three key Ichimoku components: the Tenkan-sen and Kijun-sen crossover, the position of the price relative to the cloud, and the Chikou Span for trend confirmation.
1. Strategy Overview
The Ichimoku Cloud combines multiple indicators to provide a complete trading system. Here's a step-by-step breakdown of the strategy:
Entry Points
Bullish Entry (Buy Signal) Criteria:
Tenkan-sen (Conversion Line) crosses above Kijun-sen (Base Line): This is your first sign that momentum is shifting upwards.
Price is above the cloud: This confirms the strength of the uptrend. Price being above the cloud suggests that the bullish trend is likely to continue.
Chikou Span (Lagging Line) is above the price: This confirms that the market is in bullish territory. If the Chikou Span is also above the cloud, it strengthens the signal.
Example: Suppose the price of Steem is currently in a bullish phase, and the Tenkan-sen crosses above the Kijun-sen while the price is clearly above the cloud. This alignment of signals indicates a buying opportunity.
Additional Confirmation: A thick green cloud (Senkou Span A above Senkou Span B) ahead indicates strong support for the trend. The cloud should also be angled upwards to suggest strong future momentum.
Bearish Entry (Sell Signal) Criteria:
Tenkan-sen crosses below Kijun-sen: This crossover suggests that the short-term trend is shifting downwards.
Price is below the cloud: If the price is trading below the cloud, it indicates a confirmed downtrend, making this an ideal point for a sell or short position.
Chikou Span is below price and below the cloud: This confirms that the trend is bearish.
Example: When Steem’s price falls below the cloud, and a bearish crossover occurs (Tenkan-sen crossing below Kijun-sen), this is a clear sell signal for exiting long positions or taking a short position.
Exit Points
Exit from a Long (Bullish) Position:
Price falls below the cloud: If the price breaks and closes below the cloud, it indicates the end of the bullish trend. This is a signal to close the long position.
Bearish Tenkan-sen/Kijun-sen Crossover: Even if the price is above the cloud, if the Tenkan-sen crosses below the Kijun-sen, it could suggest that the momentum is weakening, providing an early exit signal.
Chikou Span below price: If the Chikou Span falls below the price, it can act as a warning that the trend is reversing.
Exit from a Short (Bearish) Position:
Price rises above the cloud: If Steem’s price breaks above the cloud, it indicates the beginning of a bullish reversal, signaling that it’s time to exit the short position.
Bullish Tenkan-sen/Kijun-sen Crossover: If the Tenkan-sen crosses above the Kijun-sen while the price is below the cloud, it suggests weakening bearish momentum.
Chikou Span rises above price: This confirms that the bearish trend might be coming to an end.
Real-World Example: Steem Price Action Analysis
Let’s break down an example using Steem (STEEM/USDT) price action:
Example of a Bullish Trend ( Feb 2024)
Tenkan-sen and Kijun-sen Crossover: In Feb 2024, Steem experienced a bullish crossover where the Tenkan-sen crossed above the Kijun-sen.
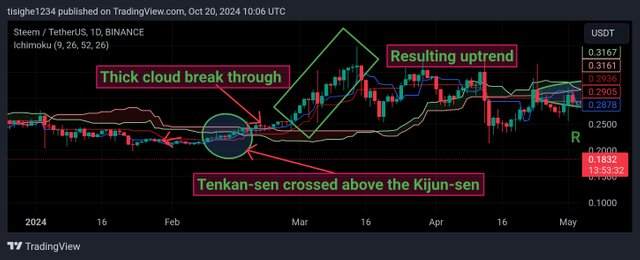
Price Above the Cloud: At the same time, the price was trading above the cloud, indicating that Steem was in a strong uptrend.
Chikou Span Confirmation: The Chikou Span was also above the price and rising, confirming the strength of the bullish trend.
This alignment created a clear buy signal, and Steem’s price continued to rise as the cloud also thickened, providing strong support. Traders who bought at this point could have stayed in the trade until the price showed signs of weakness (e.g., falling below the cloud or a bearish crossover).
Example of a Bearish Trend (June 2024)
Tenkan-sen and Kijun-sen Crossover: Later in June 2024, Steem showed a bearish signal when the Tenkan-sen crossed below the Kijun-sen.
Price Below the Cloud: The price had already fallen below the cloud, indicating the start of a strong downtrend.
Chikou Span Confirmation: The Chikou Span was well below the price and moving lower, confirming the continuation of the bearish trend.
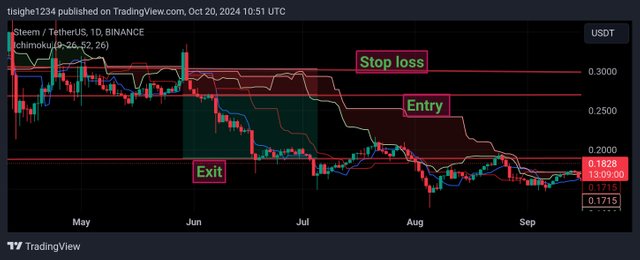
Traders would have used this as a sell signal and possibly opened short positions or exited their longs. The price continued downward, respecting the cloud as resistance.
Risk Management criteria
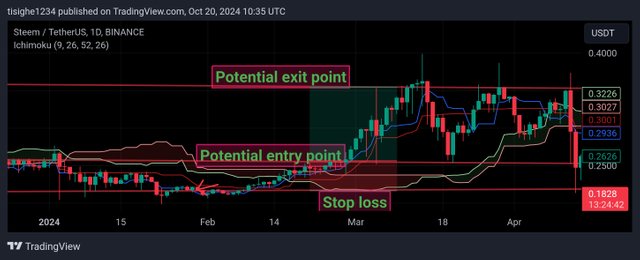
Stop-Loss Placement:
For long positions, place a stop-loss below the cloud. If the price breaks below the cloud after entry, it signals a potential trend reversal, and you want to minimize losses.
For short positions, place a stop-loss above the cloud. If the price breaks above the cloud, it could mean that the downtrend is reversing.
Position Sizing: Adjust your position size based on the distance between your entry point and the cloud, which acts as support or resistance. If the cloud is thick, use a smaller position size, as this indicates more volatility and a higher chance of the price bouncing or rejecting.
Conclusion
The Ichimoku Cloud strategy for Steem can effectively guide traders in identifying potential trends, providing clear entry and exit points based on the interaction of the price with the cloud, crossovers, and the behavior of the Chikou Span. By analyzing the full picture of the Ichimoku Cloud, traders can confidently enter trades when trends are strong and exit before reversals occur, maximizing profit and minimizing risk.
Question 5: Forecasting Future Price Movements Using the Ichimoku Cloud
The Ichimoku Cloud has a unique ability to forecast future price movements by projecting the Senkou Span A and Senkou Span B ahead of the current price, providing potential support and resistance areas. For Steem (STEEM/USDT), these projections can be used to anticipate the next possible price movements by observing how the cloud’s future shape and position develop.
Forecast Capabilities of Senkou Span A and B
1. Senkou Span A:
This is the average of the Tenkan-sen and Kijun-sen, and it is projected 26 periods into the future. It reflects short- to medium-term price movement and forms the upper boundary of the cloud when it’s above Senkou Span B.
2. Senkou Span B:
This is the average of the highest high and lowest low over the last 52 periods, and it is also projected 26 periods into the future. It’s a longer-term indicator and tends to move slower, forming the lower boundary of the cloud when Senkou Span A is above it.
Cloud’s Projection and Forecasting Future Trends
The area between Senkou Span A and Senkou Span B forms the cloud, which shifts forward, giving traders a 26-period advance look at potential support or resistance zones.
Thick Cloud: A thick cloud indicates a strong support or resistance level. If the cloud is wide and thick, it means that the market will have a harder time breaking through it. This can be especially useful when predicting future pullbacks or recoveries.
Thin Cloud: A thin cloud suggests weak support or resistance, making it easier for the price to break through. If the cloud becomes thin, it indicates that there is less momentum in the market, and a potential trend change could be in the works.
Bullish Cloud (Green): When Senkou Span A is above Senkou Span B, the cloud is green, indicating bullish sentiment. If Steem’s price stays above the green cloud in the future, this suggests that the uptrend may continue, with the cloud acting as support.
Bearish Cloud (Red): When Senkou Span B is above Senkou Span A, the cloud turns red, signaling bearish sentiment. If Steem’s price is below a red cloud, it will act as resistance, suggesting that the downtrend may persist.
Current Analysis and Forecast for Steem (STEEM/USDT)
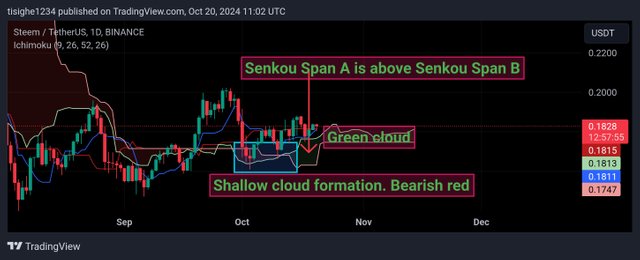
The cloud is green and thick, indicating strong bullish sentiment and solid support.
Senkou Span A is angling upward, suggesting that short- to medium-term price action may continue higher.
Senkou Span B is flatter, which could imply that the upward trend may not accelerate rapidly but will likely continue to grind upward steadily.
If Steem is trading above the cloud, the cloud’s future projection shows a strong support zone in case of any pullbacks. Traders can use this to plan entries if the price retraces toward the cloud. As long as Steem remains above the cloud, it is likely to stay in a bullish trend, with the green cloud acting as a support area.
However, if the cloud narrows or turns red in the future, it could suggest weaker bullish momentum or even a trend reversal. This would signal traders to watch for a potential downward move if the price breaks below the cloud. If the price fails to stay above the projected cloud, a new downtrend may emerge, with the Senkou Span B acting as future resistance.
Conclusion
The Ichimoku Cloud’s projection of Senkou Span A and B gives traders a clear view of potential support and resistance levels for Steem. If the cloud remains green and thick, it suggests a continuation of the uptrend, with potential buying opportunities on pullbacks. If the cloud turns red or narrows, it could warn of weakening bullish momentum or an impending downtrend. Monitoring how the price interacts with the projected cloud helps traders anticipate reversals or continuations, offering valuable insight into future market movements.
It was Nice experimenting with the ichimoku cloud turn by using this tool correctly We can make inform market decisions using the indicator.
I hereby I invite the following persons to join me participate in this contest. @chant, @simonnwigwe and @wirngo.
Reference.
Credit to: @rafk