Crypto Trading Strategy with Triangular Moving Average (TRIMA) - Crypto Academy |S6W4| - Homework Post for Professor @fredquantum

Hello Steemians, welcome to the 4th week of season 6 in the Steemit Crypto Academy. Today's lesson was delivered by professor @fredquantum on a crypto trading strategy using the TRIMA indicator. Indicators are no doubt important technical analysis tools in the market today. Efficient use of indicators can help increase the profitability of our trades. In this study, we will be looking at how to generate useful trading information using the TRIMA indicator.

Understanding TRIMA Indicator
Moving averages are trend-based indicators that are utilized to identify price direction. Moving averages are calculated using historical price data points over a period of time by taking the average closing prices within a period. The simple moving average takes into account the average closing prices of an asset over a period to generate a dynamic line on the chart. The simple moving average lags behind price and also reacts to unnecessary price fluctuations. This creates a lot of noise and rough signals which can mislead traders into making a wrong trading decision.
The TRIMA indicator was developed as an advanced Simple moving average with an added weight to obtain smooth and clean signal information from the market. The TRIMA indicator is a double-smoothed simple moving average which is averaged twice. This makes the TRIMA indicator filter noise and reacts less to unnecessary price fluctuations, unlike the simple moving average. With this, traders can obtain a smooth and clean trading signal to make good d trading decisions.
The crypto market is highly volatile and we see high and irrelevant price fluctuations in the market. TRIMA indicator is the best indicator to filter out this noise in the market and also signal accurate trading information.
Setting up TRIMA on the Chart and its Calculation
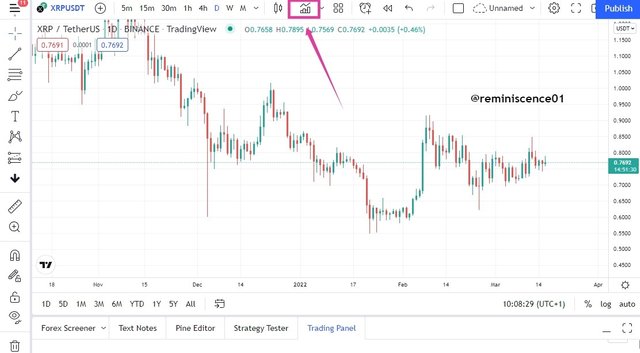
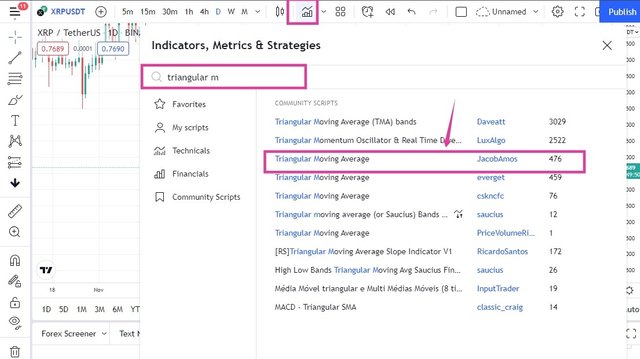
In this section, I will be explaining how to setup the TRIMA indicator on Tradingview.com platform. The steps are as follows:
- On Tradingview.com chart interface, click on the indicator icon located at the top corner of the page. On the indicators landing page, type Triangular Moving average using the search toolbar and select the indicator to be added on the chart. This is further illustrated in the screenshots below.
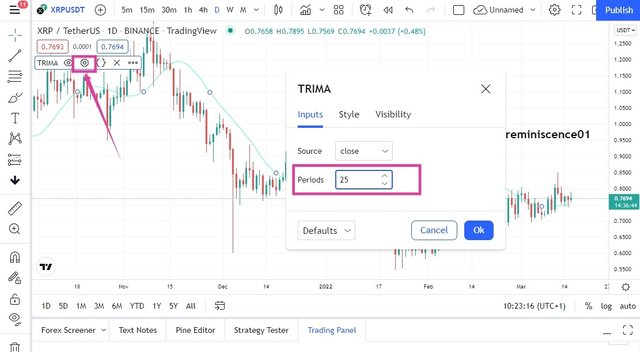
From the chart above, I have added TRIMA indicator on the chart. I have also changed the setting to suit my trading style and also to obtain a smoothed signal. This can be done by clicking on the settings icon as shown on the chart.
Calculating TRIMA Indicator
Indicators are derived from mathematical equation models of previous data points. The TRIMA indicator is calculated using the SMA as discussed in the previous section of this study. First, we determine the SMA of the asset over a period of time and then average these SMAs to determine TRIMA value.
Calculating SMA,
SMA = (P1 + P2 + P3 + P4 +...Pn)/ n
Where P = represent the price of an asset.
Pn = This represents the last price considered.
n = This represents the total number of periods considered
P1-4 = This takes into account the prices of an asset over 4 periods.
The formula is used to determine the SMA of price over a period n. Now we can determine TRIMA value averaging the SMA calculated for an n period.
TRIMA = (SMA1 + SMA2 + SMA3...+SMAn)/n
In the formula above, the value of TRIMA will be determined by taking into consideration the SMAs of an asset over an n period.
Identifying Uptrend and Downtrend Market Conditions Using TRIMA indicator
Identifying trends in the market is important an information every trader looks out for before making a trading decision. TRIMA indicator is a good trend-following indicator that can give an accurate signal on the direction of price. The effectiveness of the TRIMA on trend identification depends on the periods and also the timeframe used. A trader must select the period that best suits their trading style. A scalper can chide a short period to get recent price information. Also, a swing trader will choose a higher period to eliminate the noise from intraday fluctuations.
Uptrend
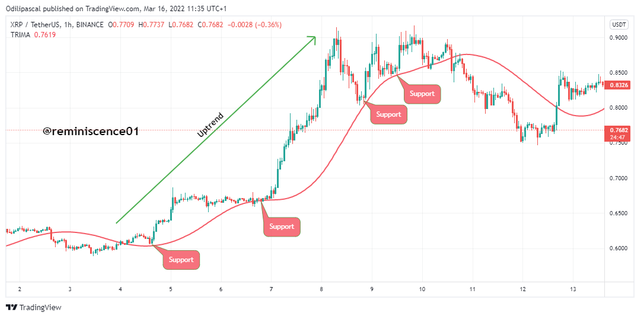
During an uptrend, price is seen creating higher and higher lows on the chart. This bullish movement of price can be confirmed on the TRIM indicator as price is seen trading above the indicator. An example can be seen on the XRP/USDT chart below.
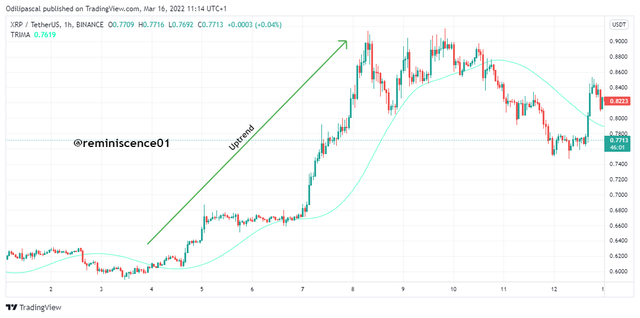
From the chart above, we can see how price broke above the TRIMA indicator which signals a change from a bearish to a bullish trend. The TRIMA indicators also serve as a dynamic support level during an uptrend. A break below the TRIMA indicator is seen as a trend reversal signal.
Downtrend
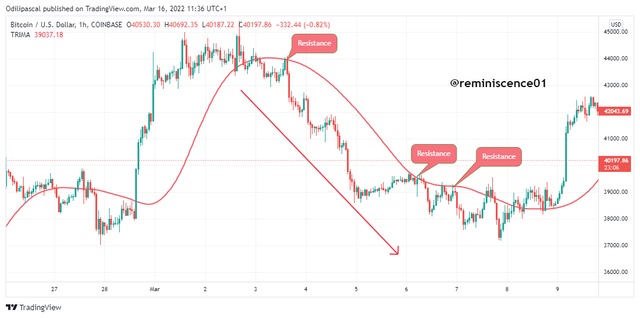
During a downtrend, price is seen creating lower highs and lower lows formation. This bearish movement can be confirmed on the TRIMA as price is seen trading below the indicator. An example can be seen on BTC/USD chart below.
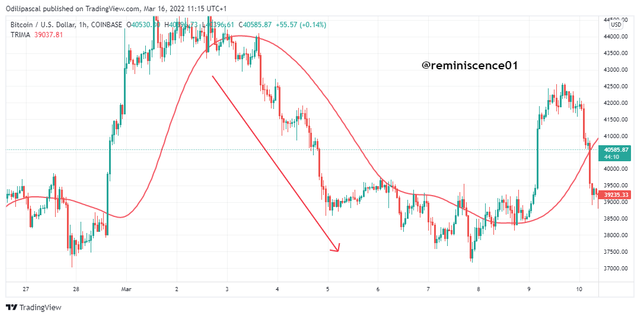
From the chart above, we can see price trading below the TRIMA indicator as the market declines. The TRIMA indicator also serves as dynamic resistance to price in a downtrend. A break above the TRIMA indicator is considered a trend reversal signal from bullish to bearish.
Dynamic Supoort and Resistance in TRIMA Indicator, And TRIMA movement in a Consolidating Market
Support and resistance are key levels on the chart where there's high buying and selling interest in the market. Traders often lookout for these areas to make entry positions as well as exit their positions in the market. Unlike the horizontal support and resistance drew manually by connecting previous highs and lows. The dynamic support and resistance are plotted automatically as price conditions change. Here, a trader does not need to draw horizontal lines on the chart as the market condition changes.
A good example of dynamic support and resistance is the trendline, channels, etc. Also, indicators like moving average, Bollinger Bands, Heikin Ashi, TEMA, etc are good tools that be used as dynamic support and resistance.
The TRIMA indicator is also good for dynamic support and resistance. During an uptrend, price finds support on the TRIMA line during a retracement. After then, price reverses to the original direction. This dynamic support can serve as an entry position for a buy trade. An example of dynamic support on TRIMA indicator is shown below.
From the chart above, we can see how the TRIMA indicator serves as dynamic support to price during an uptrend. Notice how price is rejected as it touches the TRIMA indicator.
Also, the TRIMA indicator is a good dynamic resistance. During a downtrend, price finds resistance on the TRIMA line during a retracement. After then, price reverses to the original direction. This dynamic resistance can serve as an entry position for a sell trade. An example of a dynamic resistance on the TRIMA indicator is shown below.
From the chart above, the TRIMA serves as dynamic resistance as price gets rejected as it touches the indicator during a retracement. A good sell trade can be executed upon reversal after price rejection.
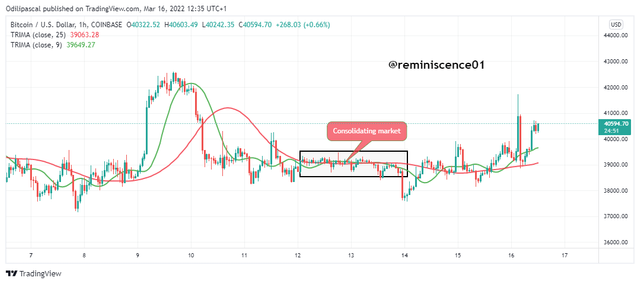
TRIMA Indicator in a Consolidating Market
During a consolidating market also known as a ranging market, price is seen with no direction as it bounces off support and resistance level. This signals low volatility in the market and also equilibrium on demand and supply. During this market condition, the TRIMA indicator is seen inside price. At this point, price is neither in an uptrend nor in a downtrend. An example can be seen in the chart below.
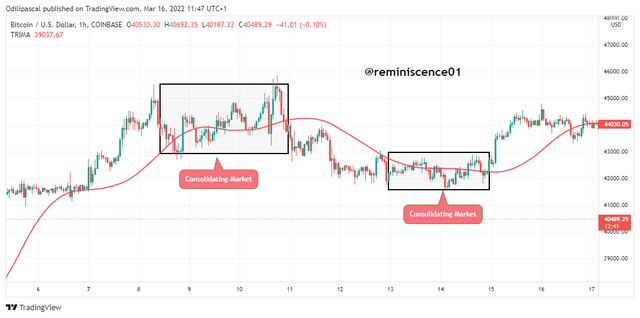
From the chart above, we can see the movement of the TRIMA indicator during a consolidating market. The indicators were seen inside price as price fluctuates within a range. A breakout is seen as the TRIMA line is seen above or below price which shies the beginning of a trend.
Combination of two TRIMAs to make Buy/Sell Entries
The TRIM indicator is developed to filter out noise and price fluctuations in the market. The indicator is double smoothed in order not to react faster to price. This makes the indicator lag behind price. This lag can cause a trader to open a position when the market has already moved. This makes a trader enter the market at a high price and last stoploss position. Some traders are unlucky as price reverses on then after they make an entry.
To help eliminate the lag in TRIMA indicator, we will be combining two TRIMA on the chart. One with a fast period and the order with a slow period. Here we will obtain a combo indicator that can help to filter noise in the market while reacting to recent price movement. The crossover bet these two TRIMA indicators serves as buy and sell signals in the market.
I have added a 9-period TRIMA as the shorter period and also the 25 period as the longer period TRIMA on the chart. These two periods suit my scalp trading style as I utilize the 1hour timeframe to determine price signals.
Buy Crossover TRIMAs
A buy trade is seen when the shorter period TRIMA crosses above the longer period TRIMA. This serves as a trend reversal signal from bearish to bullish. A buy trade can be executed after the crossover with good trade management. An example can be seen on the chart below.
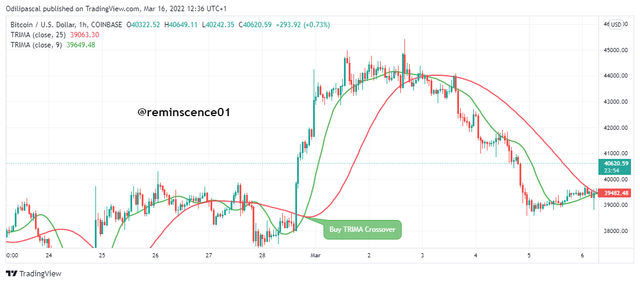
From the chart above, we can see how a buying opportunity can be identified using the combination of 9 period and 25-period TRIMA on the chart. Notice how price spikes after the crossover which shows high bullish momentum in price.
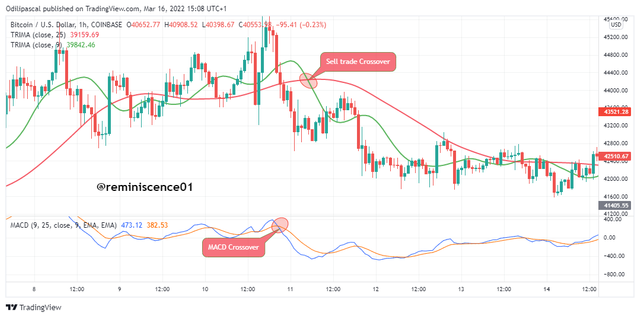
Sell Crossovers of TRIMAs
A sell trade opportunity is seen when the shorter period TRIMA crosses below the longer period TRIMA. This serves as a trend reversal signal from bullish to bearish a d also an opportunity to take a sell trade with proper trade management. An example can be seen on the chart below.
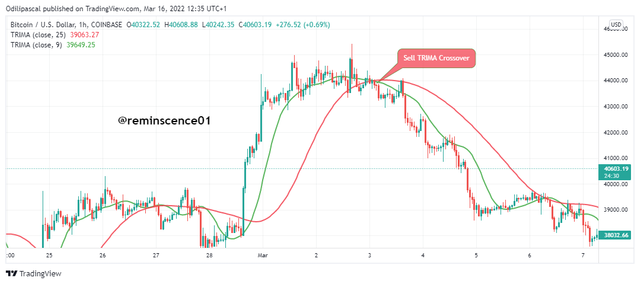
From the chart above, we can identify a sell trade opportunity as the shorter TRIMA crosses below the longer TRIMA indicating a downtrend. We can also notice how price declined to show high bearish momentum in price.
During a consolidating market, the two TRIMAs are seen overlapping each other. At this point, it is not advisable to open a position as price can breakout in any direction. Always be patient to confirm a crossover before making an entry. An example of the two TRIMAs in a consolidating market can be shown on the chart below.
Conditions for Trend Reversals using Combination of TRIMA and RSI
In the previous section, we have combined two TRIMAs to get better trading signals. For trend reversals, the TRIMA indicator still lags behind price and this can make it detect a trend reversal after price have already reversed. For this reason, we will be combining the TRIMA indicator with another technical indicator to confirm trend reversals. The RSI will be used for this purpose to confirm trend reversals on the TRIMA indicator.
Criteria for Trading Bullish Reversal using TRIMA
- Add two TRIMA indicators to the chart. Probably a fast period and a slow period. Also, add the RSI indicator to the chart.
- The RSI should enter the oversold region during a downtrend or a consolidating market which is a bullish reversal signal.
- Wait for the slow period TRIMA to cross above the fast period TRIMA which is also a trend reversal signal. After this confirmation in both indicators, execute a buy trade after the formation of at least two candlesticks.
- Proper stoploss and take profit should be placed at strategic positions. A 1:1 risk-reward ratio can be used with stoploss placed below the dynamic support(below the TRIMA crossover).
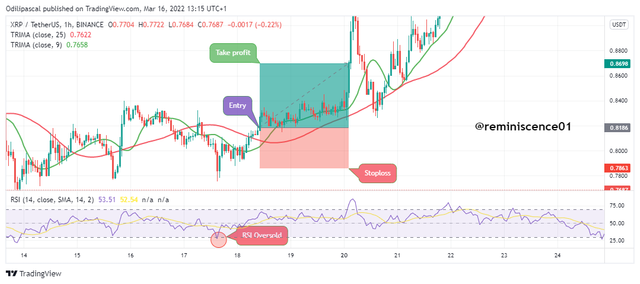
From the chart above, we can see after a downtrend, the RSI is seen to be in an oversold region which signals a trend reversal. Looking at the chart, we can also see that the shorter period TRIMA is below the longer period TRIMA. After some time, a crossover is seen as the shorter period TRIMA crossed over the longer period TRIMA. An entry position is seen after the formation of two candlesticks.
Criteria for Trading Bearish Reversal using TRIMA
- Add two TRIMA indicators to the chart. Probably a fast period and a slow period. Also, add the RSI indicator to the chart.
- The RSI should enter the overbought region during an uptrend or a consolidating market which is a bearish reversal signal.
- Wait for the slow period TRIMA to cross below the fast period TRIMA which is also a trend reversal signal. After this confirmation on both indicators, execute a sell trade after the formation of at least two candlesticks.
- Proper stoploss and take profit should be placed at strategic positions. A 1:1 risk-reward ratio can be used with stoploss placed above the dynamic resistance (above the TRIMA crossover).
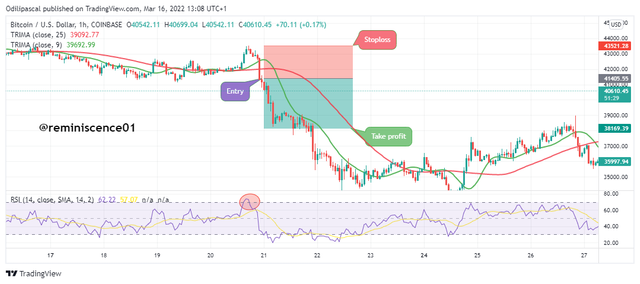
From the chart above, after price created a high of $43521, a retracement is seen as the RSI enters the overbought region signaling a trend reversal. We can also see the slow period TRIMA crossed over the fast period TRIMA. A sell trade is taken after the crossover as price continues to decline.
Combining MACD with TRIMA indicator to confirm Trend Reversals
The MACD is another momentum-based indicator that can be used to determine price direction. The MACD is made up of two EMA, a fast period EMA and a slow period EMA. The crossover of the fast period EMA above and below the slow period EMA is a trend reversal signal. In this section, I have added a slow period and fast period EMA of the same length as that of TRIMA indicator. The crossover on the MACD will be used to confirm the trend on the TRIMA indicator.
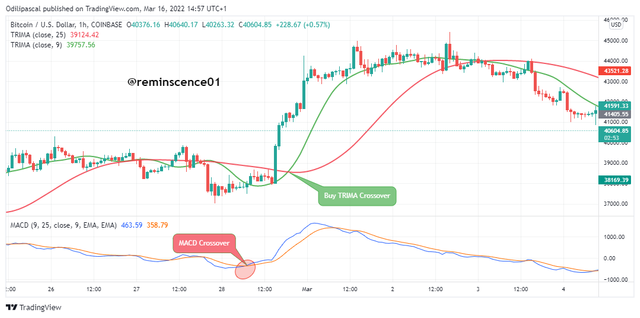
From the chart above, we can see a crossover of the slow period EMA on the MACD over the fast period EMA. This is seen as a bullish trend reversal which was confirmed later on the TRIMA. Looking at the TRIMA indicator, we can also notice a crossover of the slow period TRIMA over the fast period TRIMA. With this confluence between the two indicators, a buy position can be opened after the crossover on the TRIMA.
Also, for a bearish reversal, we can see a crossover of the slow period EMA below the fast period EMA which is a bearish reversal signal. Also, we can see a crossover of the slow period TRIMA below the fast period TRIMA which signals a bearish reversal.
In this section, I have combined MACD and TRIMA indicators to confirm trend reversals. A confluence between both indicators must be clear before an entry position can be taken.
Placing a Demo trade and Real using Using TRIMA reversal Strategy
In this section, I will carry out a technical analysis on Tradingview.com. The trade execution will be carried out on Binance exchange and Tradingview paper trading.
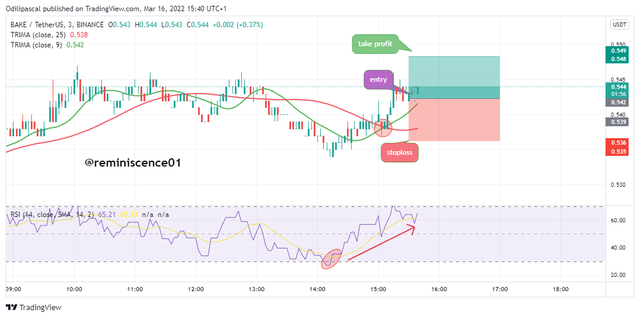
Real Trade on Bake/USDT using TRIMA Indicator
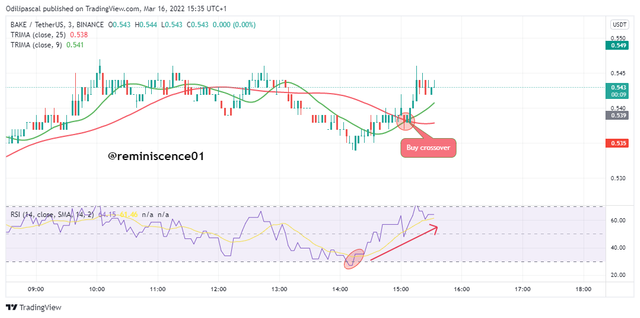
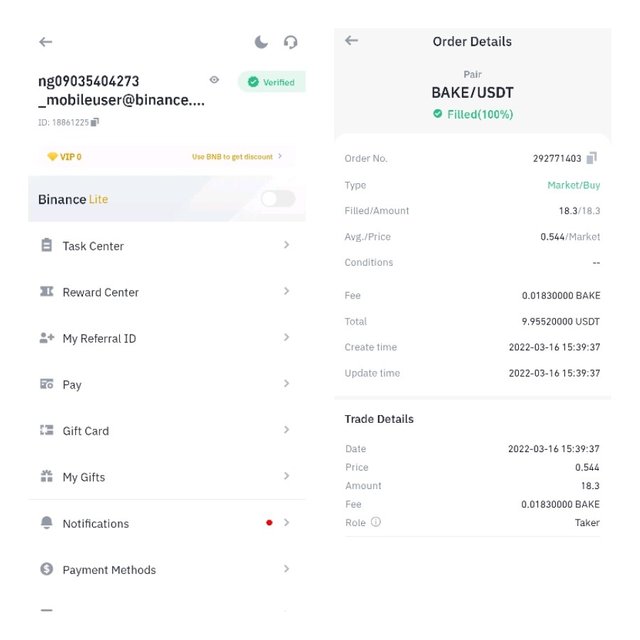
Looking at BAKE/USDT chart, I noticed price was declining as the short period TRIMA is below the fast period TRIMA. After some time, price entered the RSI oversold which signals a bullish trend reversal. I waited to confirm the trend reversal on the TRIMA indicator before making an entry. After some time, the short period TRIMA crossed above the long period TRIMA. I took a buy trade after the formation of two candlesticks with stoploss placed below the TRIMA crossover and a 1:1 risk-reward ratio. The transaction details are shown below.
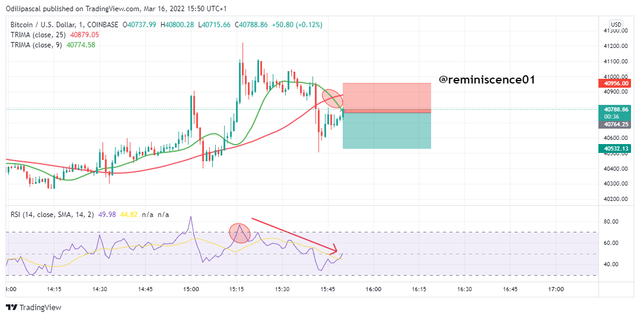
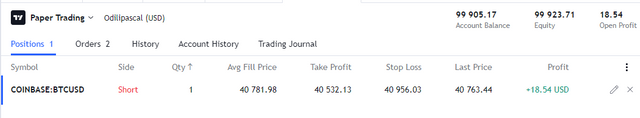
Demo Trade on BTC/USD Using TRIMA
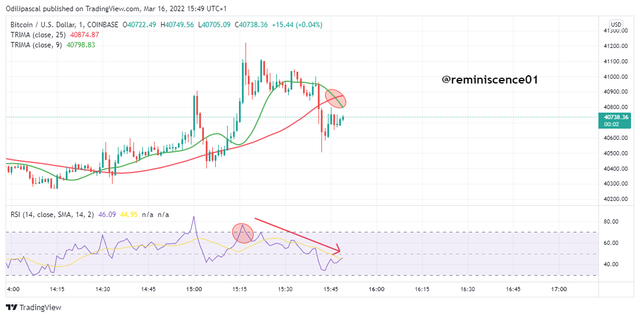
Looking at BTC/USD 1minute chart, I noticed the short period TRIMA is above the long period TRIMA which shows that price is still bullish. On the RSI, the RSI has entered an overbought region which signals a bearish trend reversal in the price of BTC/USDT. I waited for confirmation on the TRIMA indicator before taking a sell trade. After some time, the short period TRIMA crossed below the long TRIMA which confirms the trend reversal on the RSI. I opened a sell position with stoploss placed above the TRIMA crossover. A risk-reward ratio of 1:1 is utilized for this trade position. Details of the trade are shown below.
Advantages and Disadvantages of TRIMA Indicator
Advantages of TRIMA indicator
- TRIMA indicator helps to smoothing noise and unnecessary price fluctuations in the market.
- TRIMA indicator gives an accurate and clean signal compared to SMA. This helps traders to avoid falling for price manipulations and fakeouts in the market.
- The indicator can be used to identify trends with a glance at the chart. The oscillation of price above and below the TRIMA line is used to determine a bullish and bearish trend in the market.
- Trading signals are enhanced when two TRIMAs are combined. Crossovers between the short and long period TRIMA can be used to determine trend reversals in the market.
Disadvantages
- TRIMA indicator lags behind price which can trick a trader to open a position when price has already moved.
- The indicator cannot be used as a standalone trading tool. Other indicators like the RSI, MACD can be combined as a confirmation tool to the TRIMA indicator.
Conclusion
The TRIMA indicator is a trend-based indicator with an added advantage over the SMA. The indicator is double smoothed which smoothing and eliminates noise in the market. TRIMA indicator also serves as dynamic support and resistance to price. The indicator is no doubt a good indicator to gain useful price information.
Like every other indicator, TRIMA indicator lags behind price and can generate false signals. Combining this indicator with other indicators can help improve the efficiency of the indicator. Also, ensure you maintain proper risk management when using this indicator.
Cc: @fredquantum.
Hello @reminiscence01 , your post have been supported using @steemcurator07 account.