Crypto Trading with Williams %R Indicator - Crypto Academy / S4W4 - Homework Post for Professor @kouba01

Hello Steemians, welcome to another week in the Steemit Crypto Academy. This week, we were introduced to available for traders to make the good trading decision in the market. I'm I have taken this lesson and it is my interest to perform the homework task in this post. In this post, I will be performing my homework task on **Crypto Trading with Williams %R Indicator.

Williams %R Indicator, how it is calculated and its best setting
Williams %R is an oscillator-based technical indicator used to measure price oversold and overbought levels in the measure. Williams %R is a powerful indicator available for traders to make good trading decisions in determining early entry and exit points.
Williams's %R indicator was created by Larry Williams in the year 1973. This indicator plays a valuable role in determining possible trend reversals and continuations in the market.
Looking at the Williams %R indicator on the chart, It travels between 0 and -100, and traders can determine oversold and overbought regions using this chart. A reading above -20 is considered an overbought region and the price is expected to reverse to the downside. Similarly, a reading below -80 is considered as an oversold region where the price is expected to reverse to the downside.
Williams %R Calculation
The indicator is calculated using previous price data points. The formula includes :
Williams %R = (Highest High - Close) ÷ (Highest High - Lowest Low) × - 100
Where,
Highest High = This is the highest price in the last periods.
Close = This represents the recent closing price.
Lowest Low = This represents the lowest price in the last periods.
Note: The period by default is usually 14 days. But a trader can configure this setting to suit his trading style.
For example, considering 50 periods (50 days) the highest price of a crypto asset is 150 while the lowest price is equal to 30. The recent closing price value is found to be 70. Williams %R can be calculated using the formula above to be :
Williams %R = ( 150 - 70) ÷ (150- 30) × -100,
%R = (80÷120) × -100 = -99%
%R equal to 99% signifies an oversold region and this indicates that a possible reversal to the upside is expected. It is advisable to see this reversal happen in the market before taking a buy position.
Best Settings for Williams %R
Just like every other indicator, there are no definite settings to choose from. It all depends on your trading style and the settings that give you the best trading success. This can be confirmed through backtesting or demo trading for a period.
The Williams %R comes with a default period of 14 which the creator Larry Williams claimed to be the setting for this indicator. But I believe this depends on a trader's trading style. For example, a swing trader or a position trader will find 14 days period too short and noisier to his trading style.
Interpreting Williams %R Overbought and Oversold signals when trading Cryptocurrencies.
In this section, I will be explaining Williams %R Overbought and Oversold signals.
Williams %R Overbought Signal
Just like we have established previously, %R can be utilized by traders to spot trend reversal and take advantage of the market. %R signals an overbought signal when the indicator is below -20 and 0%. Traders stay on guide whenever the indicator is in the overbought region as the price is expected to reverse to the downside.
It should be noted that the overbought region isn't a sell trigger point whenever price comes to this area. It is advisable to be patient and wait for the reversal to start before taking advantage of the signal. An example of the %R overbought signal is shown in the chart below.
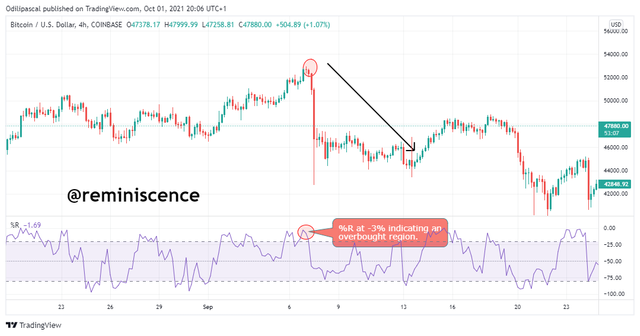
The image above shows the chart of BTC/USD. From the chart, we can see the price of BTC created a high at $52k after the indicator reached a level of -3% which showed that the price is in an extreme overbought condition. After that, there was a reversal in the price of BTC.
Williams %R Oversold Signal
The Williams %R indicator also signifies oversold conditions in the market. This can be seen when the indicator reads below -80%. Traders stay at alert when price enters this region for a possible bullish reversal. Just like we have stated, it is advisable to wait for the price to reverse before taking a buy position. The reason is that price can tend to remain in this region in a strong bearish trend.
An example can be shown in the chart below.
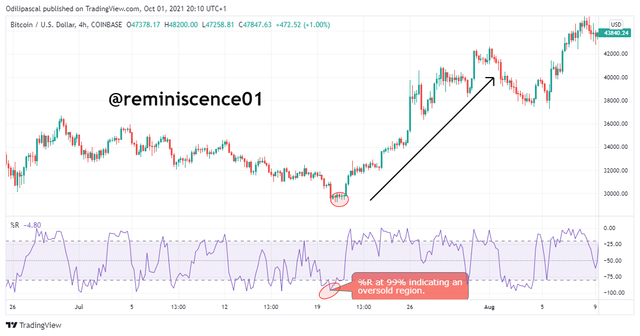
Looking at the BTC/USD chart above, we can see the price was in a continuous downtrend until it created a low at $29.4k. The %R indicator was spotted at 99% which indicates an extreme oversold of BTC. At this point, the price of BTC was expected to reverse to the upside and after that, the price reversed to start a bullish trend.
Failure Swings and How to identify it Using the Williams %R indicator
In this post, we have identified the upper limit and lower limit of Williams's %R indicator. The indicator is expected to reach the upper limit of above -20% to be considered an overbought region and for price reversal. Similarly, the indicator is expected to reach a lower limit of -80% for the price to be considered oversold and also a reversal to the upside.
Sometimes prices fail to reach these limits before reversing to the opposite direction. This can be caused due to high impact news that suddenly changes the direction of the market. An example can be seen in the chart below.
Overbought Failure Swing
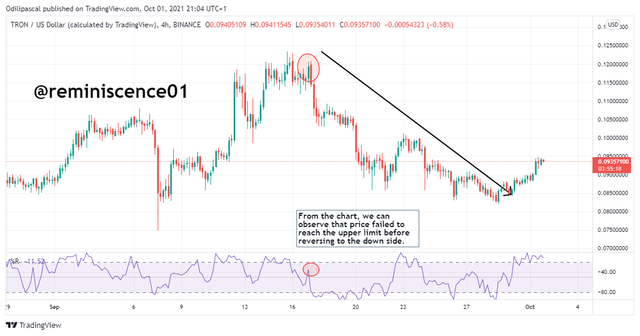
Looking at the chart above, we can notice that the price failed to reach the upper limit of %R which is considered an overbought region. Normally, the price is expected to enter the overbought region above -20% before reversing. But the price reversed without getting to -20%. This simply means that price is too weak to continue the bullish trend and thus declaring a sell signal.
Oversold Failure Swing
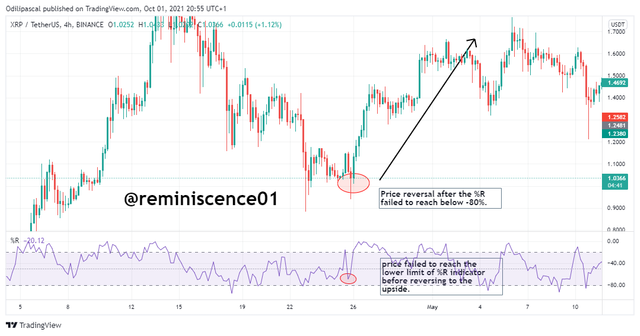
Looking at the chart above, we notice that XRP/USDT was in a downtrend before reversing at $1.03. Normally, the indicator was supposed to indicate that the price of XRP is oversold before the reversal. But price reversed without the indicator rising to the lower limit at -20%. This shows the weakness and exhaustion of the bearish trend.
Failure swings are still another opportunity to capture price reversals and make good profits from the market using Williams %R technical indicator.
Bullish and Bearish Divergence With Williams %R Indicator
Divergence is a common scenario in technical analysis traders can capitalize on to spot reversals. Divergence occurs when an indicator and price move in the opposite direction. This is observed from the market structure of the indicator and price. When divergences occur, the indicator might be indicating a bullish structure by forming a higher-high formation while price action will be showing a bearish formation of lower-low. Let's look at Divergence with Williams %R indicator.
Williams %R Bullish Divergence
A bullish divergence can be spotted when the Williams %R indicator is signaling an uptrend by the formation of a higher-high structure. Meanwhile, price is signaling a downtrend by the formation of a lower-low structure. Bullish divergence indicates that the bearish trend of price action is weak and a possible reversal is expected in the market. An example of this can be seen in the chart below.
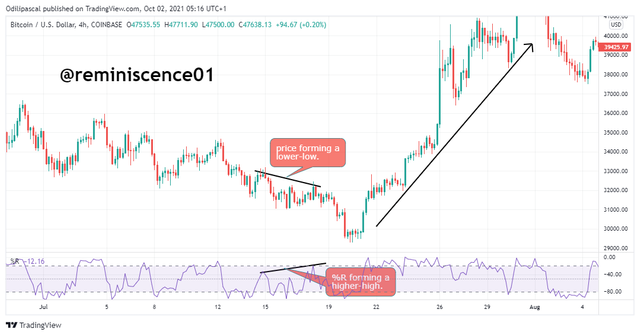
From the chart above, we can notice a bullish divergence on BTC/USD. The market was in a downtrend forming lower lows. After a while, an uptrend formation(Higher high) was seen on the Williams %R indicator shows the weakness of the seller to keep pushing the price down. This signal to traders that the market is transitioning from a bearish trend to a bullish trend.
Williams %R Bearish Divergence
A bearish divergence can be spotted when the Williams %R indicator is signaling a downtrend by the formation of a lower-low structure. Meanwhile, price is signaling an uptrend by the formation of a higher-high structure. Bearish divergence indicates that the bullish trend of price action is weak and a possible reversal is expected in the market. An example of this can be seen in the chart below.
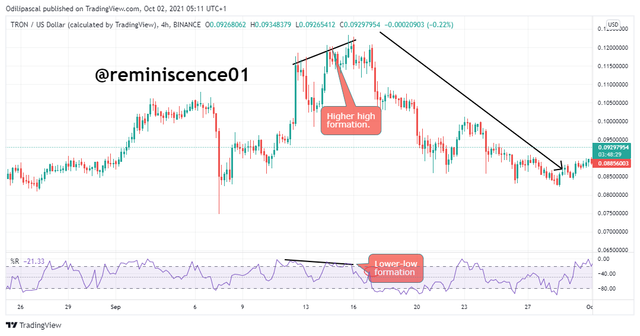
From the chart above, we can notice a bearish divergence on TRX/USD. The market was in an uptrend forming structure. After a while, a downtrend formation(lower-low) was seen on Williams %Rthe indicator shows the weakness of buyers to keep pushing prices up. This signal to traders that the market is transitioning from a bullish trend to a bearish trend.
How to Spot trend using Williams %R indicator and How false signals are filtered.
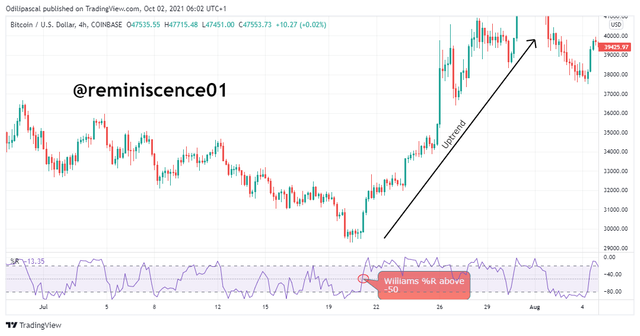
Apart from spotting trend reversals using Williams %R overbought and oversold regions, the indicators can also be used to spot trends in the market. The threshold of -50 is used to spot bullish and bearish trends using the Williams %R indicator.
A bullish trend can be spotted when the indicator is above the -50 threshold. Above -50 threshold indicates a strong bullish momentum and also the injection of more buyers to keep pushing prices up. An example can be seen on the chart below.
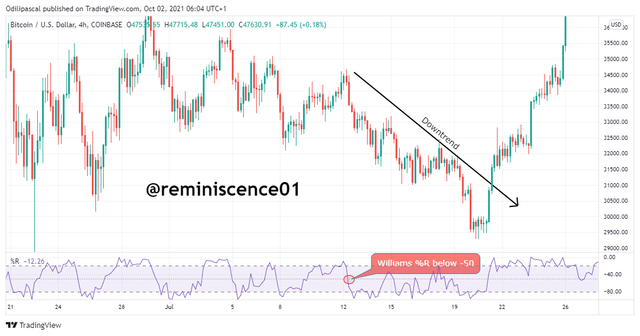
Similarly, a bearish trend can be spotted when the indicator is below the -50 threshold. Below the -50 threshold indicates a strong bearish momentum and also the injection of more sellers to keep pushing prices down. A good example can be seen on the chart below.
How to filter false signals
Every indicator is prone to false signals and the trader must spot these false signals. False signals from an indicator can be filtered when the indicator is used in conjunction with other technical indicators or other technical analysis tools.
For the Williams %R indicator, false signals can be filtered when the indicator is used in conjunction with the Exponential Moving Average (EMA). With this combination, a false signal from the Williams %R indicator can easily be identified and filtered. The best approach for this combo is to set the period of both indicators to 14 to avoid conflicting signals from both indicators.
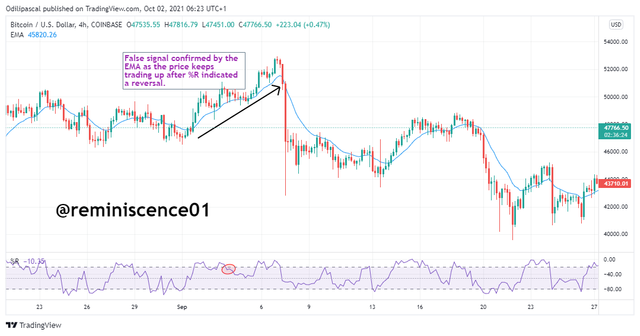
From the chart above, we can see the false signal being spotted by the EMA. The Williams %R indicator signaled a bearish reversal after the indicator reversed back from the overbought region. But looking at the EMA, the price is still trading above the 14 periods EMA which means that buyers are still in control of the price.
Now let's look at the scenario where the EMA is used to confirm the signal from the Williams %R indicator.
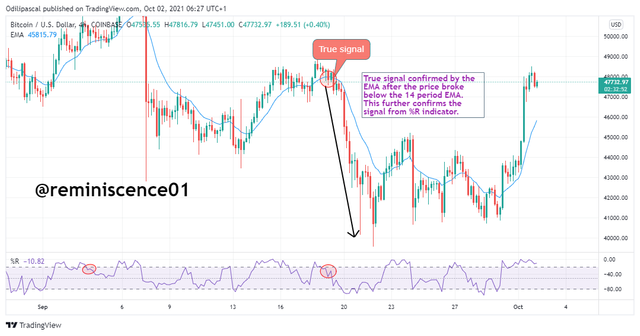
Looking at the chart above, we can see a confluence between the Williams %R indicator and the EMA on BTC/USD. From the Williams %R indicator, we notice the reversal of price after reaching the overbought threshold at -20%. This indicates a bearish reversal in the market. This signal can further confirm from the EMA as we a price break below the 14 periods EMA. This break signifies a change in trend from bullish to bearish which was signals by the Williams %R indicator.
Using Crypto Asset pair to present the various Signals from the Williams %R indicator.
In this section, I will be carrying out an analysis to present the various signals from the Williams %R indicator. This analysis will be carried out on Tradingview/for both buy and sell signals.
Buy Signal: BTC/USD Chart
From the section of this post, we have established the criteria for Williams %R buy signal and how to get a true signal using the exponential moving average (EMA). A Buy signal can be seen when Williams %R indicator is below the -80% threshold which shows that price is oversold.
The best approach here is to wait for the price to reverse to the upside after trading below -80% before looking for a buy position. To further confirm this by signal, it is necessary to combine the Williams %R indicator with an exponential moving average. A true confirmation of the buy signal is seen when price breaks above the EMA line which confirms the bullish trend.
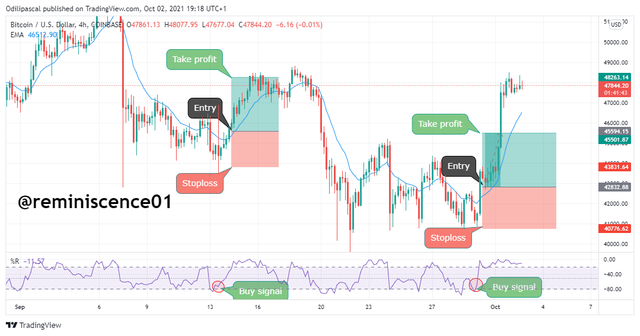
From the chart above, we can notice how BTC was in a downtrend trading below the 14 period EMA creating a low at $43k. After that, the Williams %R indicator indicated that BTC is oversold. This tells traders that the bear run is exhausted and a possible reversal is expected. This bullish signal was further confirmed using the EMA as price broke above the EMA line signaling a shift from bearish to a bullish trend.
An entry position can be after the breakout candle with stoploss placed below the EMA line. Take profit can be 1:2 R: R (risk-reward). Though this entry criteria depends on a trader's trading style.
Sell Signal: BTC/USD Chart
For a Sell signal using Williams %R indicator, the indicator is meant to be in an oversold region which is between -20% and 0%. After that, price is expected to reverse to the downside. A good confirmation of the sell signal can be as price breaks below the 14 period EMA line which signal a shift from bullish to a bearish trend.
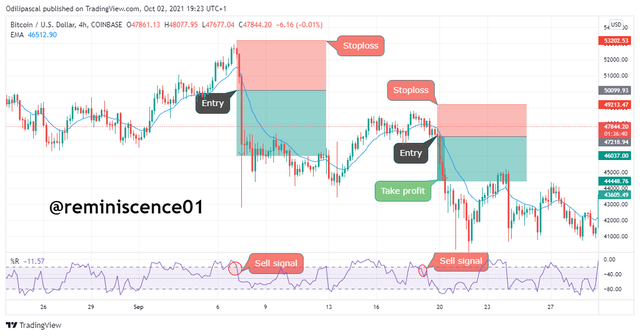
From the chart above, we have a situation of a bullish trend on BTC/USD as price reached a high at $52.6k. Williams %R indicator showed that BTC is overbought and a possible reversal is expected. To further confirm this sell signal, we need to look at the EMA to avoid a false signal from the indicator.
Looking at the 14 period EMA, we can see a break below the EMA line which showed a transition from bullish to a bearish trend. Stoploss can be placed above the EMA line with a 1:2 risk-reward ratio.
The confluence between the Williams %R indicator and the EMA is a powerful trading strategy that can increase the success of your trading.
Divergence on BTC/USD
We have discussed divergence in this post and how a trader can capitalize on the signal. Looking at the BTC chart below, we can spot a bullish divergence. Though price was forming a lower low formation (sell signal) while the indicator is signaling a bullish trend. The bullish trend of the indicator shows exhaustion in the downtrend. This is shown in the chart below.
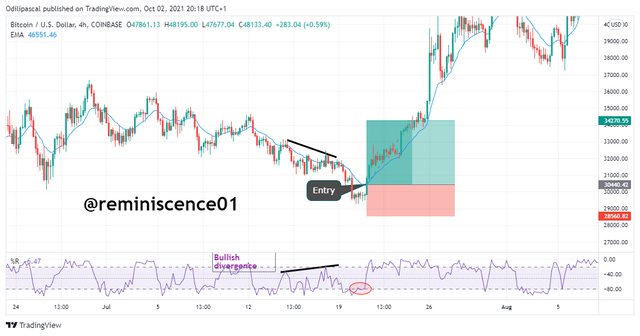
After the divergence was spotted, a reversal was expected to occur. After some time, price broke into the oversold region and reversed to the upside. This bullish reversal was further confirmed using the 14 period EMA as price broke above it.
Conclusion
Technical indicators are powerful technical analysis tools that help to make a good trading decision. In this post, we have discussed the Williams %R indicator which is a good indicator for spotting trends and also trend reversals using the oversold and overbought regions.
Using indicators as a standalone tool makes it prone to false signs and market manipulation. However, the false signal of the Williams %R indicator is filtered using the exponential moving average (EMA) which increases the success rate of using this indicator to trade cryptocurrencies.
Furthermore, the crypto market is highly volatile and it is expected that a trader applies good risk management and stoploss while trading.
Note: All charts used in this post are screenshots taken from tradingview.
Thank you @Kouba01 for this amazing lesson.
Hello @reminiscence01,
Thank you for participating in the 4th Week Crypto Course in its 4th season and for your efforts to complete the suggested tasks, you deserve a Total|10/10 rating, according to the following scale:
My review :
Work with excellent content, because you have taken every question seriously, allowing you to get answers that are precise and in-depth in its analysis and clear in its methodology.
Thanks again for your effort, and we look forward to reading your next work.
Sincerely,@kouba01
Thank you @kouba01