Support and Resistance Breakouts - Steemit Crypto Academy |S6W3| - Homework Post for Professor @pelon53


Hello Steemians, I welcome you all to the 3rd week of season 6 in the Steemit Crypto Academy. Today, we will be looking at Support and Resistance breakouts in technical analysis. Professor @pelon53 has done great to deliver this lesson and I will be submitting my homework task in this post.
Advantages of Locating Support and Resistance on a Chart
Technical analysis is doubt the most important form of analysis available for retail traders to understand the market today. One of the most important technical analysis tools is the support and resistance levels on the chart. These are key levels every trader looks out for before making any trading decision. As a trader, before you make any trading decision in the market, you first understand how price is reacting at the support and resistance levels.
Support and resistance are key levels on the chart where there is high buying and selling interest. At this point, the market experience a break to gather momentum for the next wave of the market movement. The reaction of price at the support and resistance levels are triggered by the supply and demand of price.
Support and resistance levels are important as it helps traders to determine potential reversal and continuation of price in the market. The rejection of price at support and resistance levels serves as reversal points in the market. Also, the break of support and resistance levels serves as a continuation of the original trend.
Also, identifying support and resistance on the chart helps traders to find entry points as well as exit points on the chart. Traders seek to place their take-profit positions at nearest support and resistance levels because these are the areas of high buying and selling interest.
Breakout of Support and Resistance
The normal idea of support and resistance is that price will reverse to the upside once it gets to support and also a downward reversal at a resistance level but that is not always the case. Anything can happen when price gets to these levels as it depends on the buying and selling interest in the market. If there's still buying interest at a resistance level, a breakout is seen for a continuation of the bullish trend. Similarly, if there's still a selling interest at a support level, price breaks out below the resistance level for a continuation of the downtrend.
Breakout of a Resistance
The resistance is seen as an area of high selling interest in the market. At the resistance, buying orders are mostly closed which triggers selling pressure in the market for price to decline. In some cases, we can see high demand of price in the market which pushes price to break out of the resistance level. The breakout of price above resistance level indicates high momentum from buyers to keep pushing price up. Traders can take advantage of breakout at the resistance to open a buy position. An example of a breakout at resistance is shown on the chart below.
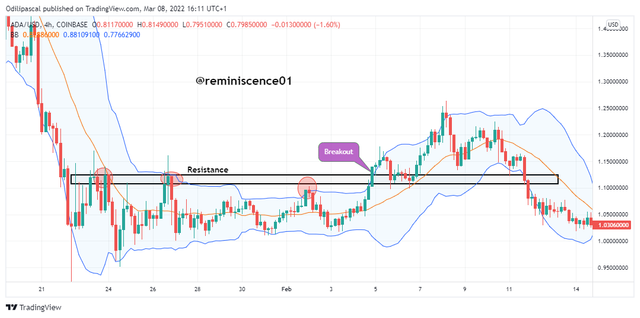
In the chart above, I have added the **Bollinger band as a filter to the breakout. The Bollinger band is a volatility-based indicator that measures the volatility of price. The upper and lower band of the Bollinger band serves as dynamic support and resistance of price. A breakout of the Bollinger band can be seen when the candlestick breaks out of the band. From the chart above, we can see that the breakout about the resistance level drawn on the chart can also be seen on the Bollinger band as the breakout candle is seen outside the upper band.
Explaining Support Breakout
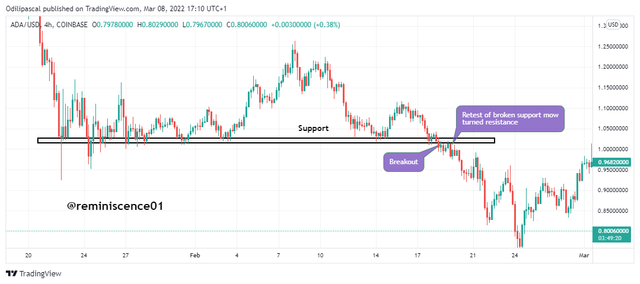
Just like I have explained previously, the support level serves as a level of high buying interest in the market. Traders always book profits for their sell positions to look for buy opportunities. Price is expected to be rejected at the support level but this is not always the case. During strong selling pressure, price can break the support level to continue the bearish movement. An example of a support breakout is seen on the chart below.
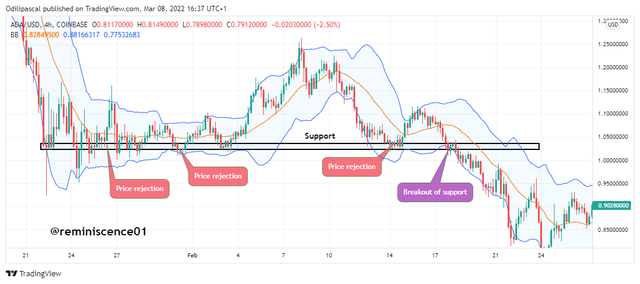
From the chart above, we can see how price was rejected several times at a support level before breaking below it. It is assumed that the more a level is tested, the greater the chance of price breaking the level and that is exactly what happened here on ADA/USD. Also, I have added the Bollinger band to confirm the breakout. The lower band of the Bollinger band serves as support as we see price bounce off the lower band. A breakout is seen when a candlestick breakout below the lower band. From the chart above, we can see the breakout candle of the support drawn on the chart also corresponds with the breakout on the Bollinger band as we a bearish candle breakout below the lower band of the Bollinger band.
False Breakout and How it can be Avoided
Sometimes in the market, we see price break a level. After the breakout candlestick, we see price reverse back into the zone. This is called false breakout carried out mostly by the big players to generate liquidity for their position. For this reason, a trader needs to be patient and not jump into the market immediately after a breakout.
False breakouts are catastrophic and can lead to huge loss of funds. For this reason, proper confirmation is required to ensure that a breakout is true. Though it is difficult to determine the direction of the market when it gets to support and resistance levels. You can't tell if price will be rejected or a breakout will occur. This is the reason support and resistance levels are used as profit-taking levels in the market.
Let's look at an example of a false breakout on the chart below.
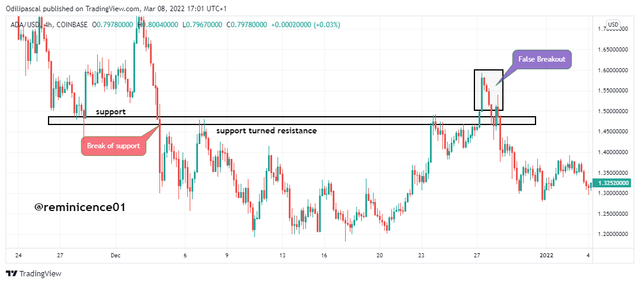
From the chart above, we can see an example of a false breakout on ADA/USD. Price broke a support level now turned resistance. After some time, price broke above the resistance for a potential uptrend. But we tend to see price reverse back to the broken resistance to keep going down. Traders who opened a position based on the breakout must have placed their stoploss below the broken resistance. This stoploss will be triggered as price reverse back down.
Avoiding False Breakout
The best approach to avoid getting caught up in false breakout is to wait for a break and retest of the broken level. Each time a level is broken, price comes back to retest the level before reversing back to the direction of the breakout. This confirms that a breakout is true.
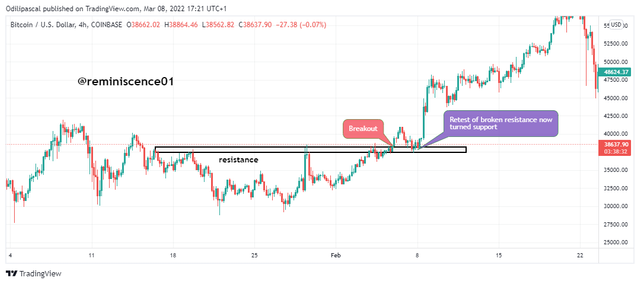
For a resistance level, when price breaks above a resistance level, price comes back to retest this level now turned support for a continuation of the bullish movement. An entry can be when price reverses back after retesting the broken resistance with a bullish candlestick pattern like bullish engulfing or the hammer. An example can be seen below.
For a support level, when price breaks below the support level, price comes back to retest the level now turned resistance for a continuation of the bearish movement. An entry can be when price reverses back to retest the broken support now turned resistance with a bearish candlestick pattern like the bearish engulfing pattern or the inverted hammer. An example is shown below.
Demo Trade Using Break of Resistance and Support
In this section, I will carry a demo trade by analyzing a crypto pair on Support and resistance breakout. This analysis will be carried out on Tradingview while the trade execution will be carried out using tradingview paper trading.
BTC/USD
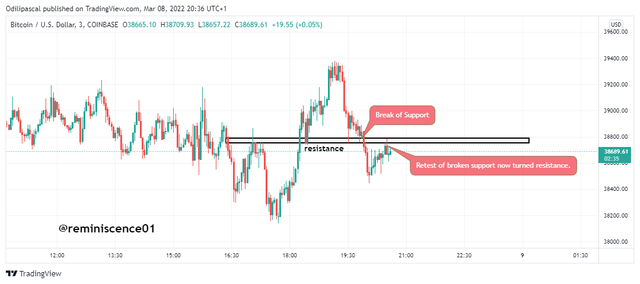
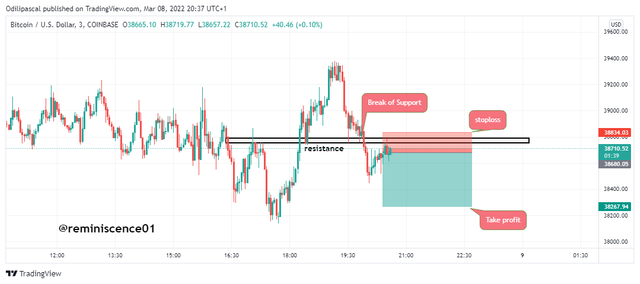
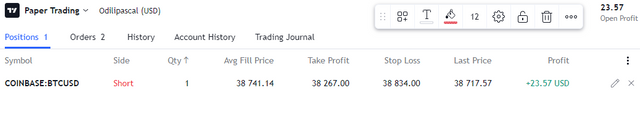
Looking at BTC/USD, I noticed price broke a support level at $38764. I was patient to wait for a retest of the broken support to turn resistance. This is will give me confirmation that the breakout is not false. After some time, price went back to retest the broken support now turned resistance. I executed a sell position after price reversed back down with stoploss placed above the broken support. The details of the trade can be shown in the screenshot below.
.png)
BAKE/USD
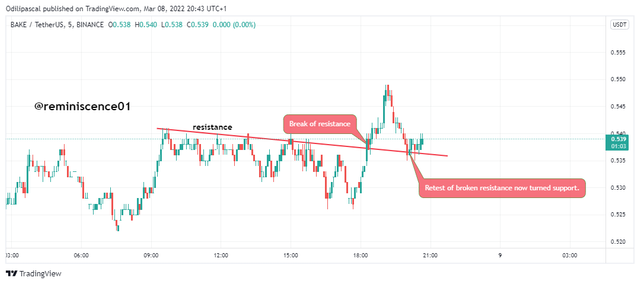
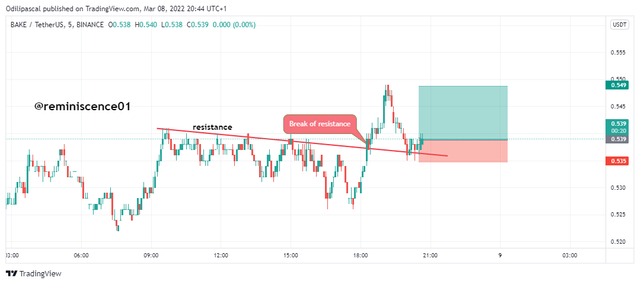
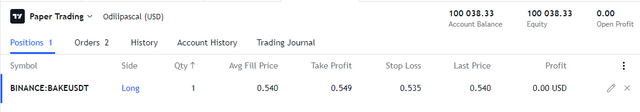
On BAKE/USD Chart above, I noticed price have been testing a resistance level multiple times. Normally, this is a sign that price will break this resistance for a bullish continuation. After some time, price broke the resistance and retested it to form a support. At this point, it is confirmed that the breakout is not a false breakout. I waited for price to reverse back up before opening a buy position. Stoploss for this position was placed below the broken resistance and the profit target was set at the nearest resistance. The details of the trade can be seen on the chart below.
Conclusion
In this study, we have discussed support and resistance breakout in the market. Support and resistance are key levels on the chart every trader looks out for to make a trading decision. Price does not always get rejected at these levels as many studies discussed. Sometimes during a strong trending market, these levels can be broken for a trend continuation.
The breakout can sometimes be difficult for traders to detect. Some breakouts are false which leads traders to get trapped in the market. It is required that a retest of this level is seen before a trader can look for an entry. Also, these levels serve as entry and take profit positions are we have discussed in the trades carried out in this post.
Thank you professor @pelon53 for this amazing lesson.