Trading Strategy RSI + ICHIMOKU CLOUD - Steemit Crypto Academy |S6W2| - Homework Post for Professor @abdu.navi03


Hello Steemians, welcome to the 2nd week of season 6 in the Steemit Crypto Academy. The academy has transitioned into trading related courses to enable us to understand how to make good trading decisions in the market. Today's lesson was delivered by professor @abdu.navi03 on a trading strategy that combines the RSI and the Ichimoku Cloud indicator. According to the lesson, the combination of these two strategies eliminates the flaws encountered when the indicators are used individually in making trading decisions.
Understanding of RSI + Ichimoku Strategy
Technical indicators are no doubt powerful technical analysis tools that help traders to understand price movements in the market. Although technical indicators are prone to false signals especially when used alone, it is required that combining technical indicators with other technical analysis tools or using two indicators can help to filter out false signals in the market.
In this study, the RSI + Ichimoku indicator see combined to form a trading strategy. The RSI is a momentum-based indicator that measures price momentum by indicating price overbought and oversold in the market. The RSI indicator can signal false signals when used in a trending market and this makes the RSI be a bad choice as the market is not always in a range.
The Ichimoku indicator on the other hand is a trend-based indicator that helps traders to understand the direction of price as well as spot future dynamic support and resistance. The Ichimoku indicator lags behind price which shows that signal information is revealed after price has already moved.
Now combining the RSI and the Ichimoku indicator forms a powerful trading strategy that can not only identify the direction of price, the strategy will also give a first-hand signal to traders when a new trend is about to start. With this, traders can make an early entry into the market with minimal risks.
Flaws of RSI and Ichimoku
In the previous section, I have highlighted the flaws of both indicators. But in this section, I will go in-depth in my explanation using an example on the chart.
Flaws of the RSI Indicator
The relative strength index (RSI) is a momentum-based indicator that indicates how far price have gone by using the overbought and the oversold conditions. With the RSI, traders can obtain how far price have gone. The strength of buyers and sellers is revealed on the RSI and this helps to understand which side of the market is losing momentum and which side is in control of price. The RSI line oscillates around 0-100 on the indicator window. A reading below the 30 threshold indicates that price is oversold and a reading above 70 indicates that price is overbought.
The use of RSI is limited to a trending market because the indicator can not indicate the strength of strength. Normally, when the RSI is in an overbought region (above 70) it signals a bearish market to traders. However, during a strong trending market, the RSI can remain in the overbought region and won't tell how far the trend will go. Let's look at the chart below.
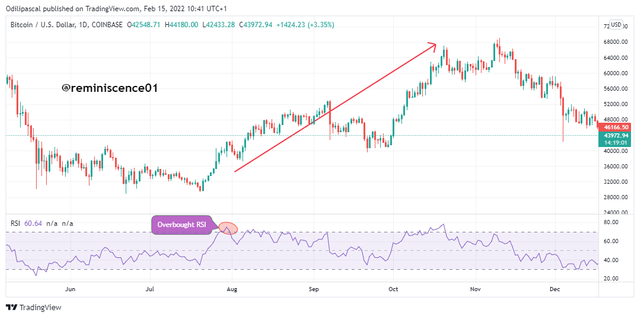
Looking at the chart above, we can see that the RSI was in an overbought region above 70 which signals a trend reversal and a sell position. But looking at price action, we can see that price continued trending up despite the RSI signaling a trend reversal. The RSI in this case failed to determine the strength of a trend and the overbought signal will be false during a strong trending market as price can remain in the overbought region.
From our example above, the RSI cannot measure the buying pressure in the market and how long a trend will go into the future. This makes the RSI a bad choice when used alone especially in a trending market.
Flaws of the Ichimoku Cloud Indicator
Ichimoku cloud is a trend-based indicator developed by Goichi Hosoda in 1968. The indicator was developed to identify several price information such as trends, momentum, support, and resistance, and buy/sell signals in the market. The indicators are made up of 5 lines which serve as moving averages of previous price data points. The crossing of price above and below the moving averages serves as a trading signal in the market.
The Ichimoku cloud serves as future support and resistance levels which helps traders to spot price reversals. Also, the position of price above the cloud signals an uptrend, and the position below the cloud signal a downtrend. The break above and below the clouds signals a trend reversal and an opportunity to open a position in the direction of the breakout.
Just like moving averages, the Ichimoku lags behind price which means that it signals a trading signal when price have moved. The lagging of the Ichimoku indicator can make traders enter the market at a high price while maximizing their stop loss. The indicator cannot identify the beginning of a new trend on time to traders. Let's look at the example below.
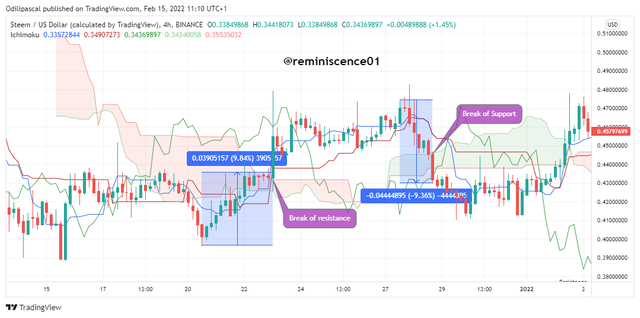
Looking at the chart above, we can see how price broke above and the cloud signaling a price reversal. Now notice that price has already made a move of +9.8% before the Ichimoku indicated the bullish trade. The Ichimoku in this case didn't identify the bullish movement on time and this will make it difficult to capitalize on the entire movement. Sometimes, the Ichimoku signals a trend when it is exhausted.
Also, in a sideways market, the Ichimoku can break above and below the cloud without any corresponding trend following this breakout. This can be seen on the chart above.
Trend Identification Using RSI+Ichimoku Strategy
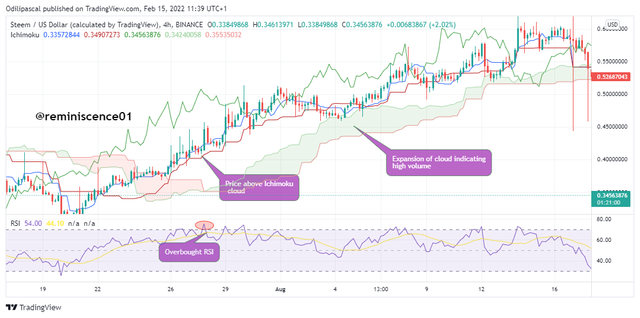
In this section, we will be looking at how to identify potential trends using the RSI+Ichimoku strategy. When the RSI is above 70, price is seen to be in an overbought region. Similarly, during a strong bullish trend, the RSI is seen to remain in the overbought region. This strong buying pressure can be seen in price action as price continue forming new highs.
The RSI cannot reveal the high buying volume which is pushing price higher. This is where the Ichimokylu indicator comes into play. When price is trading above the Ichimoku, it signals an uptrend. Furthermore, the momentum of the uptrend can be seen in the expansion of the Ichimoku cloud. An example can be seen on the chart below.
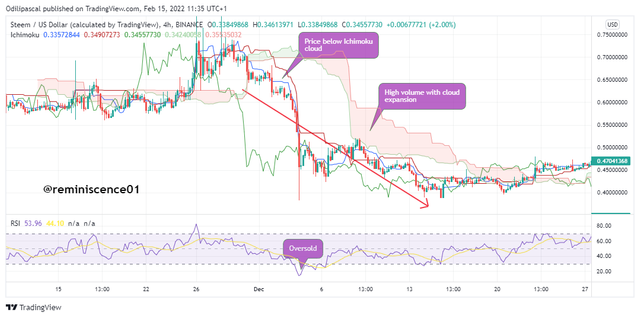
For a downtrend, when the RSI is below 30 it shows that price is in an oversold region. However, the oversold region can also signal a strong selling pressure either in a downtrend or a beginning of a downtrend. However, to identify the volume of price in the bearish market we will be looking at the Ichimoku cloud. If price is trading below the Ichimoku cloud, it indicates a downtrend. The volume of the sellers can be determined using the size of the cloud. The larger the cloud, the larger the volume. An example can be seen in the chart below.
Using MA with RSI+Ichimoku Strategy
The moving average can be combined with this strategy to increase the efficiency of the trading signal and also to filter false signals from the Ichimoku cloud. The moving average is also a trend-based indicator that helps to identify trends and trend reversals in the market.
The MA period can be set depending on a trader's strategy. But according to the strategy discussed in the lesson, 85 period MA was using with the RSI+Ichimoku strategy.
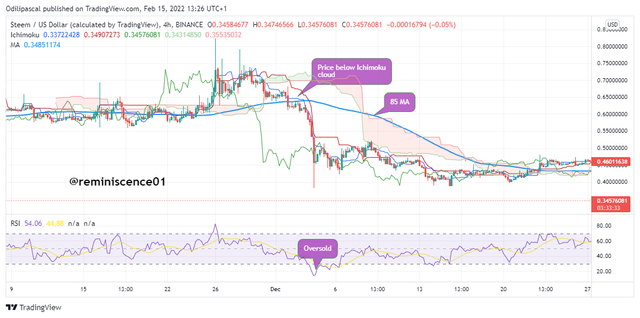
Looking at the chart above, we have added 85 period MA(blue line) on the chart. We can observe that MA is in confluence with the Ichimoku cloud as price is trading below the 85 period MA. This helps to confirm that price is in a downtrend. The addition of the MA serves as a confirmation tool to filter out false signals by this strategy.
Support and Resistance with RSI + Ichimoku Strategy
Support and resistance are very important levels on the chart these levels represent areas of buying and selling pressures of price. In this strategy, we will see how we can identify support and resistance. In a trending market, the Ichimoku will be used to identify support and resistance. On the other hand, during a ranging market, the RSI will be used to identify support and resistance levels.
In a Trending Market
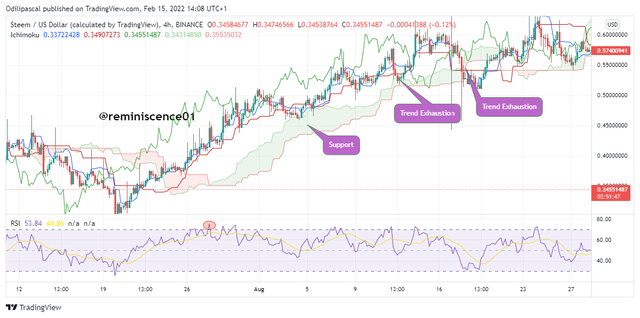
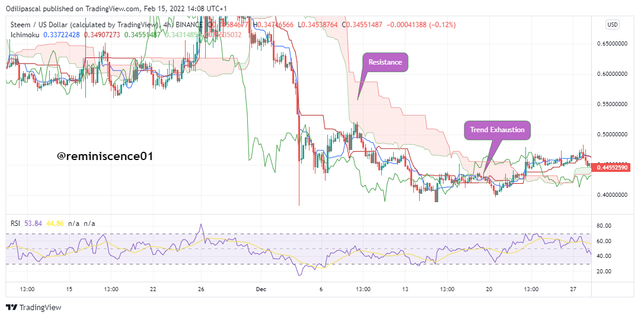
The Ichimoku cloud serves as a support and resistance level during a trending market. The Ichimoku serves as support when the cloud is green. During an uptrend, price finds support on the Ichimoku cloud. Also, the Ichimoku cloud serves as a resistance when the cloud is red. During a downtrend, the Ichimoku serves as a resistance on the chart. On the other hand, when price approaches the cloud, it signals trend exhaustion and weakness in the current trend. Also, when price is far away from the cloud, it signals a strong trend.
A break of the cloud signals a trend reversal. An example can be seen on the chart below.
In Sideways Market
During a sideways market, the Ichimoku doesn't give an accurate trading signal. For this reason, we will be using the RSI as it works best during a ranging market. The RSI overbought and oversold regions serve as support and resistance. The RSI reveals the momentum in price which can help to spot price reversals.
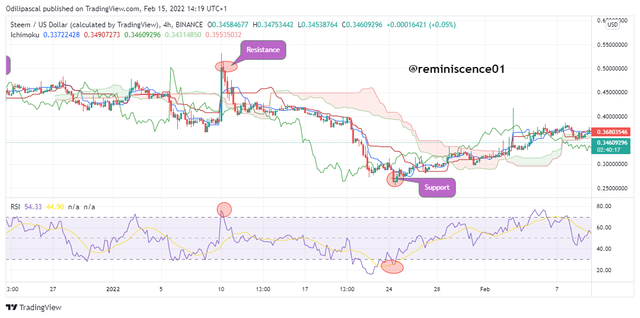
From the chart above, we can see how the RSI served as a support and resistance using the oversold and the overbought region. Price gets rejected when it enters the overbought and oversold regions during a ranging market. I have used a threshold of 70 - 30 for the RSI overbought and oversold. A trader can modify this range to suit their trading style.
Using this Strategy for Intraday Trading
Every trading strategy is good if used very well. It depends on the trader's experience and discipline to use a trading strategy effectively. The strategy we discussed in this post can be applied to any trading system. Intraday traders can use this strategy to identify trends in the market. Also, this strategy is effective in both trending and ranging markets.
Intraday traders can utilize the strategy to find entry and exit points in the market. The combination of the MA to this strategy also helps it filter out false signals and price manipulation. Indicators are important technical analysis tools that work effectively using the right setups.
Demo Trade Using RSI + Ichimoku Strategy
In this section, I will be performing a demo trade using the strategy discussed in this study. The chart analysis will be carried out on Tradingview.com while the trades will be executed using trading view paper trading.
BTC/USD Buy Trade
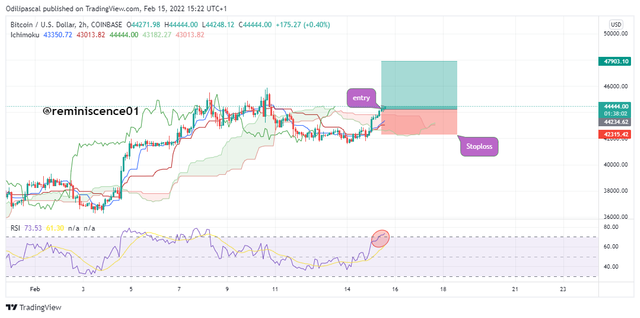
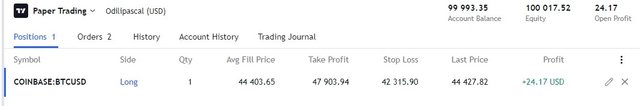
On opening the BTC/USD chart, I noticed that the RSI was in an overbought region which also signals high buying pressure. I went down to the Ichimoku and saw that price broke above the cloud which signal a trend reversal from bearish to bullish. I went ahead to open a buy position. Stop loss for this trade is placed below the cloud with a 1:2 risk-reward ratio.
ETH/USD Sell Trade
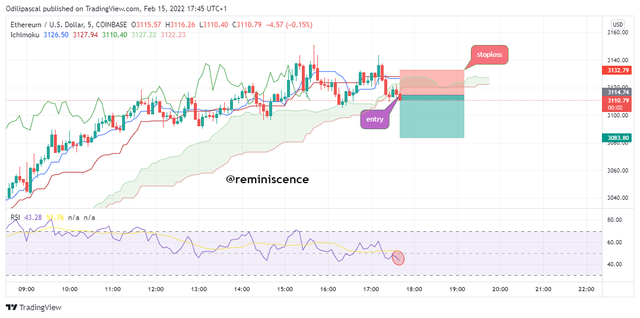
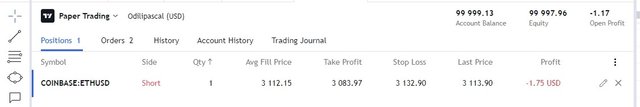
From the chart below, we can see that the RSI crossed below the 50 line which shows bearish pressure in the market. Also looking at the Ichimoku, I observed that price broke below the cloud indicating a change from a bullish trend to a bearish trend. I opened a sell position with a stop loss placed above the cloud.
Conclusion
In this study, we have discussed a trading strategy that combines the RSI and Ichimoku indicators. The combination of these two signals helps to filter out false signals when these indicators are used alone. With this trading strategy, a trader can obtain trading signals in both a trending and a ranging market.
The success of this strategy depends on the traders' style and also the configurations of the indicator. Also, endeavor to use proper risk management as price will not always go in our favor.
Thank you professor @abdu.navi03 for this amazing lesson.