Mastering the Bull Run with Trailing Stop and Multi-Timeframe Analysis
 |
|---|
Greetings and welcome to another wonderful class, as we discuss again on a very interesting topic titled mastering the Bull Run with Trailing Stop Techniques and Multi-Timeframe Analysis. Like always, I hope you get to learn something new as I attend to the hints as provided.
Explain Trailing Stop and Its Usefulness in a Bull Run |
|---|
Before we get into all details about the usefulness of a trailing stop, I'm sure you would like to know what it is all about isn't it? So then, what's this trailing stop we are learning this week?
Well, I have come to understand that a Trailing stop is a type of order where we can set when trading cryptocurrencies or other assets to help us protect our profits while still giving room for potential gains.
Think of it as an order that allows you buy an asset and allows you set a stop at a certain amount or percentage below the highest price the asset reaches after you buy it. Therefore, if the asset's price goes up, the trailing stop moves up with it, but if the asset's price starts to drop, then the trailing stop stays where it is. Still confused? I would too, so let's take a look at an everyday example.
 |
|---|
A good example of a trailing stop will be a person hiking up a mountain. let's say you are hiking and you have a friend who is following you with a rope attached to your waist. So as you climb higher, your friend behind keeps the rope tight but allows it to slide a little as you move up.
To start the hike, it's clear you will start at a lower height right? Now let’s say you started hiking the mountain at 100 meters and you tell your friend that he can only let the rope slide down to 90 meters. Therefore, as you climb to 120 meters, the rope slides up with you, but if you slip and start to fall back down, your friend will stop you at 90 meters.
In this example, the 90 meter mark is serving as your trailing stop as it protects from falling down too far, but allows you to capture the gains upward and still giving you room to move higher.
In trading, a trailing stop works similarly to the rope example above. What do I mean by that? let's say you bought an asset at $50 and set a trailing stop at $5 below the highest price reached, if the asset climbs to $60, your trailing stop moves up to $55, but if the asset then drops to $55, your stop is triggered (to stop the price from falling down further), and at this point you sell, giving your a profit of $5 instead of losing it all or running into loses if the price continues to fall.
Now that we have come to know what Trailing stop is all about, we can now look at its usefulness.
Like most of us here, I have just learned about trailing stops in trading, and it’s pretty amazing. Imagine I bought some cryptocurrency, and it’s doing really well, in this case a trailing stop serves a safety net that follows the price of my crypto as it rises.
So, let's say I bought Steem for $100 and set a trailing stop at 10%. This means that if the price goes up to $120, my trailing stop automatically adjusts to $108 (which is 10% below the highest price). But then, if the price keeps climbing up, let's say to $150 now, the trailing stop will also move up to about $135.
But then here’s the cool part, if the price of Steem starts to drop, my trailing stop stays at its last position which is $135, so if the price falls to that price, my trade automatically sells to lock in a profit of $35 ($135 - $100) since I bought Steem at $100. Therefore a trailing stop is like having a personal assistant who keeps an eye on my investment, ensuring I don’t lose too much if the market turns against me.
Thus, trailing stop is useful in helping traders manage their risk while letting their profits run and it is a smart way to navigate the ups and downs of the crypto or financial world compared to our take profit and stop loss.
Seeing how good the trailing stop works, a certain question entered my mind and the question is how do I get to determine the percentage I would like to set my trailing stop, and in my research I have come to find out that, to determine the percentage for a trailing stop, you need to consider certain factors, such as:
Volatility of the Asset:
When determining the percentage of a trailing stop, one needs to look at how much the price of the asset tends to fluctuate, and if it is very volatile, you might want to set a wider trailing stop percentage to avoid getting stopped out too early.
Risk Tolerance:
This involves about how much you are willing to lose before you sell. This way, if you are not willing to take big risks, you might prefer a tighter trailing stop (like 5-10%), while if you’re okay with taking on more risk then a wider stop (like 15-20%) might be better.
Market Conditions:
In everything you do, you have to consider the current market trends. For example, if the market is trending strongly in one direction, you might want to give your trade more room to breathe with a wider trailing stop.
Testing:
We are told you can't just jump on a meal without testing, if that's correct, then it applies here too. This means that it's always best to test the market with different percentages, or better in a demo account or with smaller amounts to see what works best for your trading style.
All these will help determine the best trailing stop percentage for you. But then, the percentage you choose should align with your trading strategy and comfort level with risk.
Now that we've known what trailing stop is all about, it's usefulness and how to determine the percentage we need let's look at the different types of trailing stop to know which is best for you.
Percentage-Based Trailing Stop:
This type of trailing stop allows you to set a specific percentage away from the highest price your asset has reached and it is the most common of them all. This type covers all the examples I've given above where we get to set a percentage for our trailing stop.
For this exercise, I will be using Binance exchange to show the steps in setting up a percentage trailing stop, and to do that;
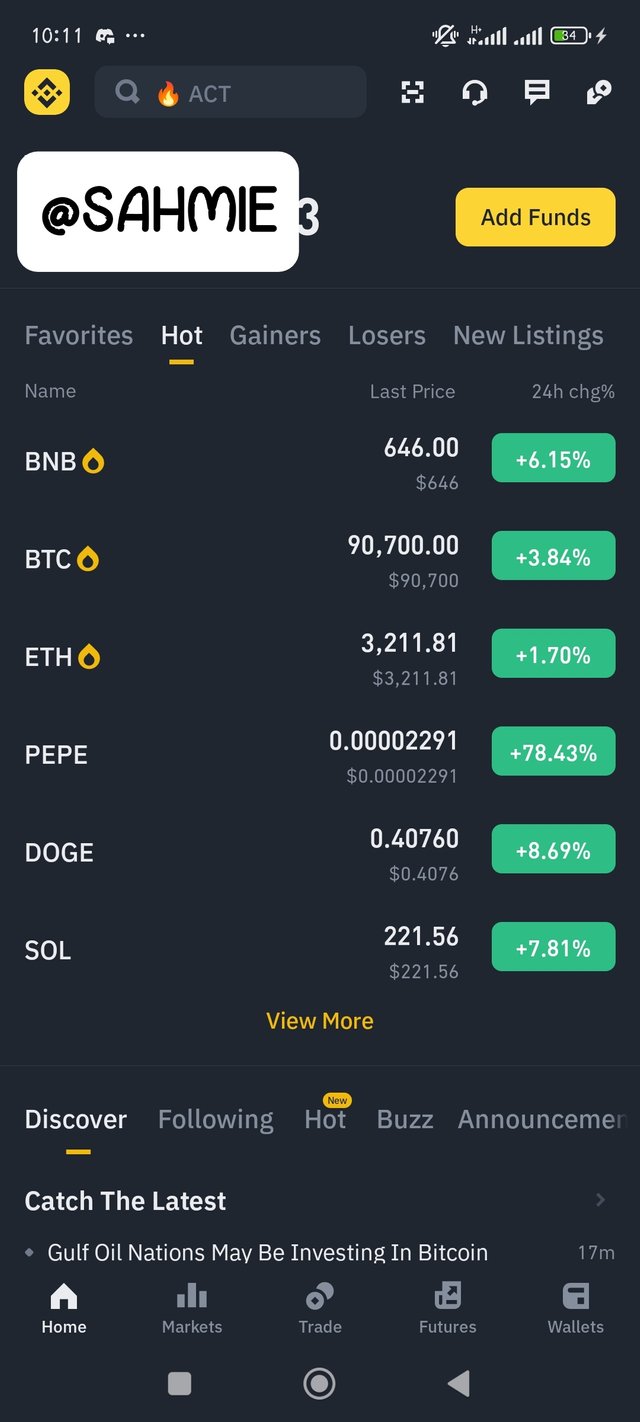
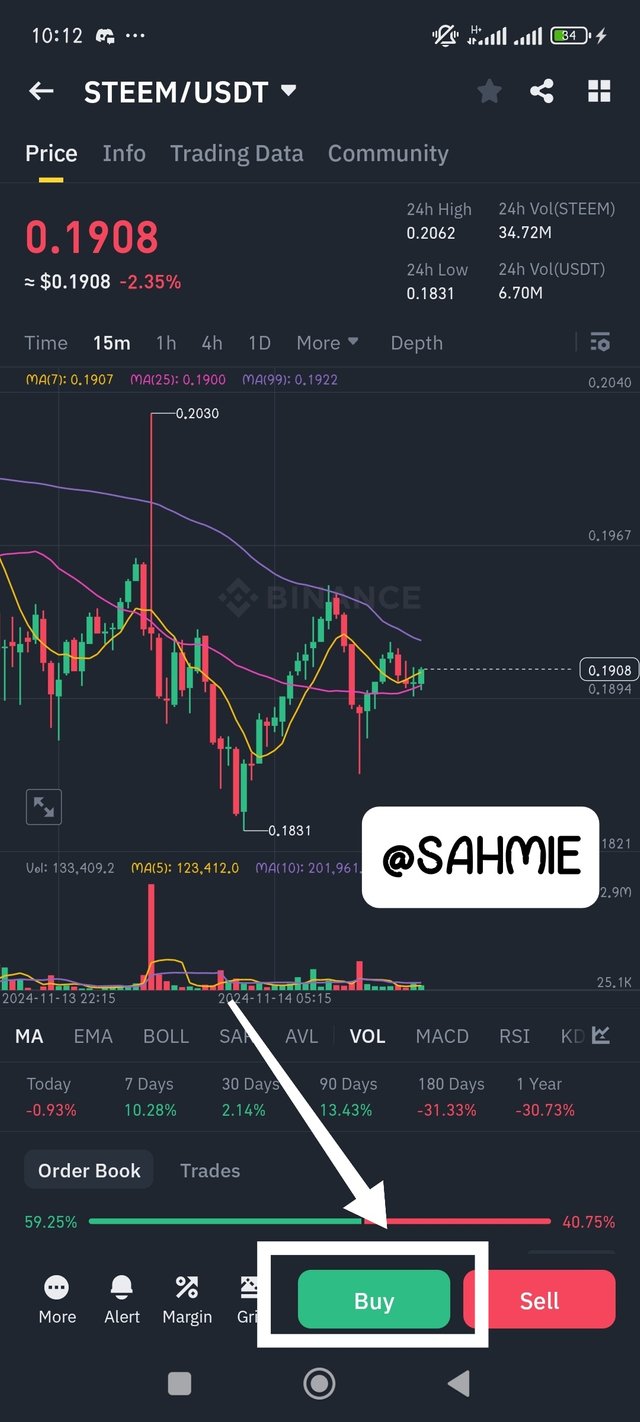
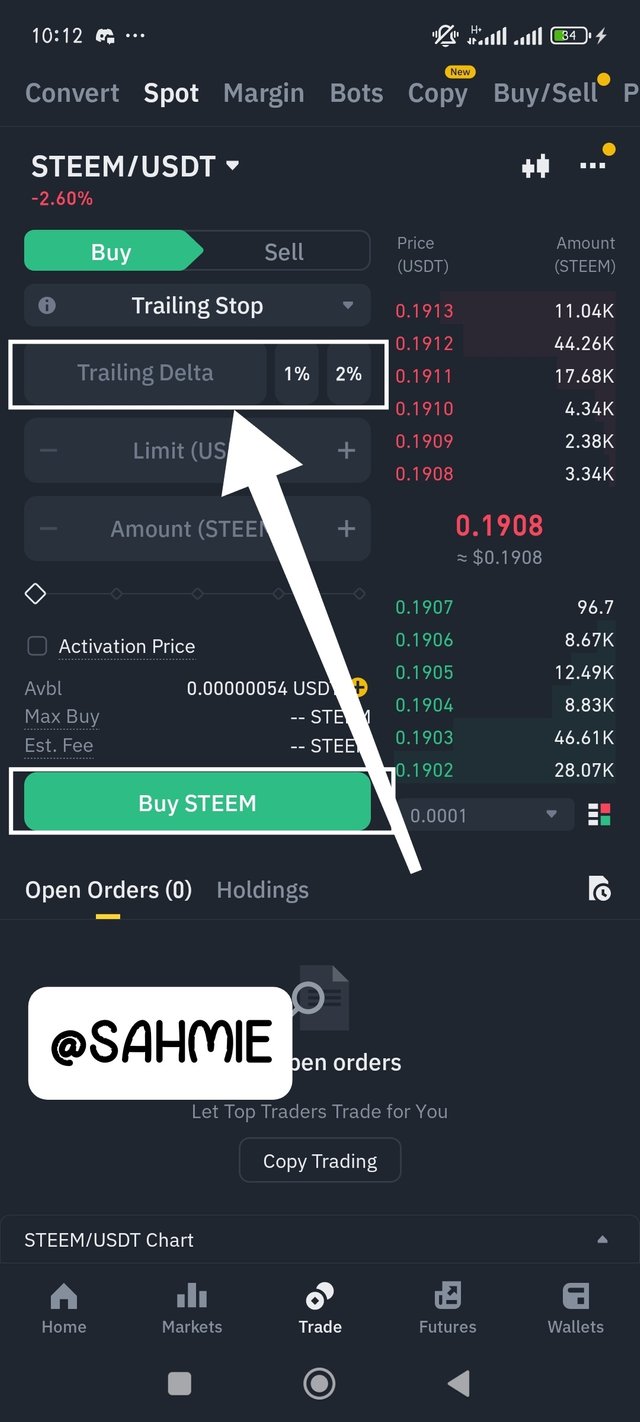
Open your Binance exchange app or platform, once loaded open any trading pair you want to trade, ( I will be using STEEM/USDT pair). Once opened, since it's a bull market scenario, click on buy.
 |  |
|---|
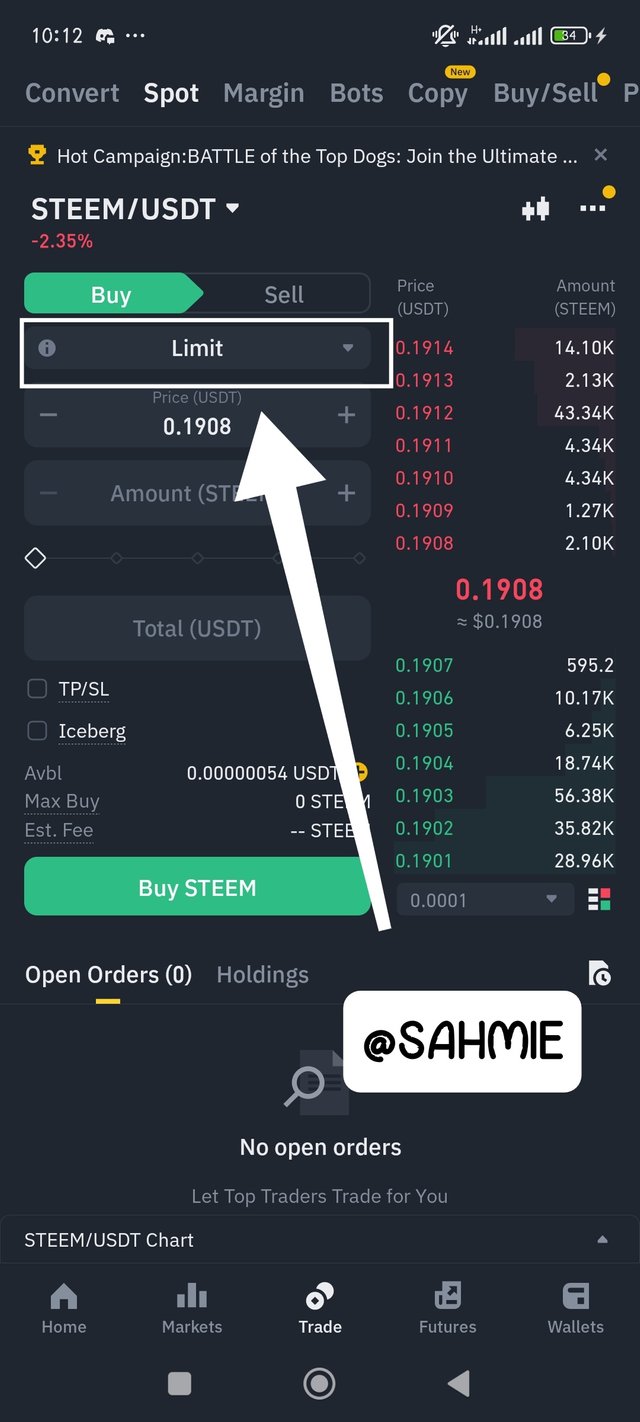
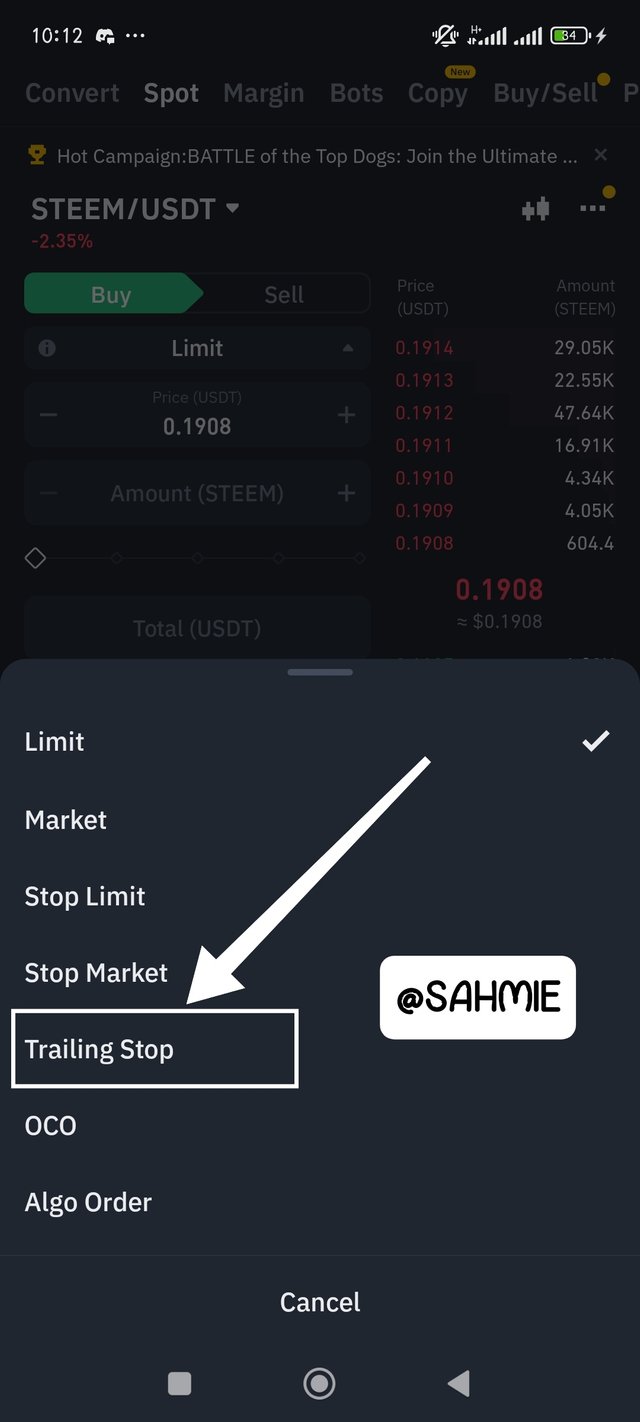
One the buy page, now click on "Limit" to bring down a drop box for all the other types of orders. From the drop down box, select Trailing Stop as your order type. With the trail stop order now open, put in the percentage you want at the "Trailing Delta" space, also the amount of Steem to buy, then click on buy Steem as shown below.
 |  |  |
|---|
Fixed Level Trailing Stop:
With this type, you choose a fixed amount to stay below the highest price, that way if you bought an asset for $50 and set a fixed trailing stop of $5, your stop would be at $45, and if the price rises to $70, your stop moves up to $65. But then, if the price falls to $65, your trade automatically sells. This method is mostly useful when you want to limit your loss to a specific amount rather than a percentage.
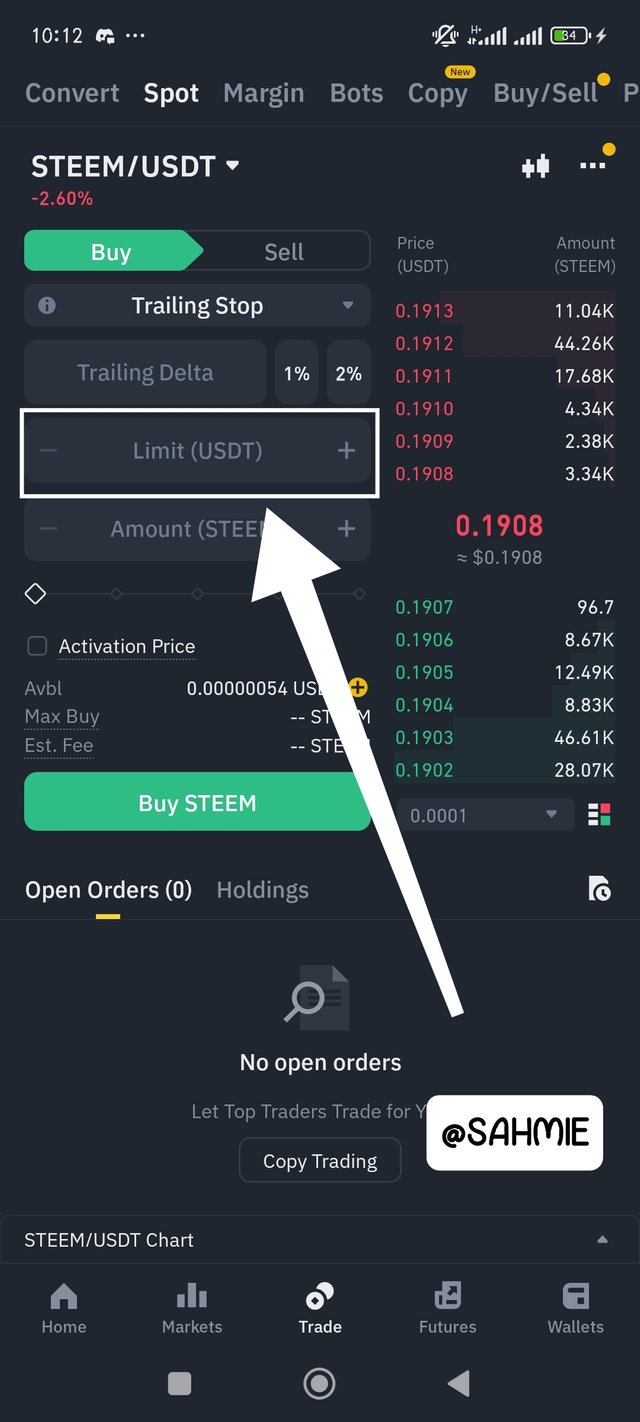
Open your Binance exchange app, then open any trading pair you want to trade, ( I will be using STEEM/USDT pair). Then click on buy.
 |  |
|---|
One the buy page click on "Limit" to bring out all the other types of orders, then select Trailing Stop as your order type. Once now open, put in the limit you want at the "Limit (USDT)" space, also the amount of Steem to buy, then click on buy Steem as shown below.
 |  |  |
|---|
ATR-Based Trailing Stop:
This type of trailing stop evolves around the ATR (Average True Range) of an asset, and it is a tool that measures market volatility. With this method, you set your trailing stop based on the ATR value. For instance, if the ATR is $2 and you decide to set your stop at 1.5 times the ATR, your trailing stop would be $3 below the highest price reached. This approach allows your stop to adapt to changing market conditions, giving you more flexibility during volatile periods.
This type of trailing stop is more dynamic because it adjusts based on market volatility. i.e., if you set your trailing stop at a multiple of the ATR, it will widen or narrow depending on how much the price is moving. For instance, if the ATR indicates a lot of volatility, your stop will be further away from the current price, allowing for more room to grow. But if the volatility is low, then your stop will also be closer to the current price with less room to roam.
To set this up, it almost the same as the the fixed trailing stop loss, with the difference being that you will have to calculate the ATR risk level by yourself first to input the limit on the "Limit (USDT)" space. Since I couldn't find ATR on Binance, let's head to Tradeview for that (I will be using 1 week timeframe), shall we.
Step one:
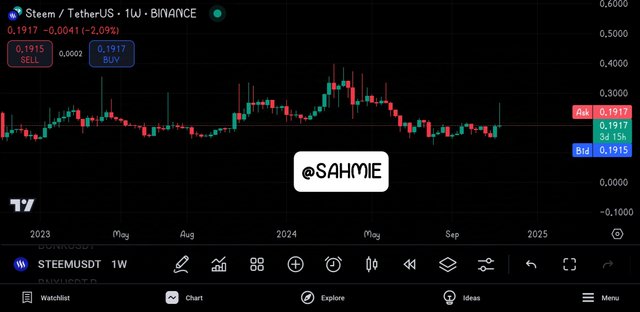
Open the STEEM/USDT pair chart on the trade view app, you can change yours to any desired timeframe, but since I will be using 1 week, and it's already in 1 week, no need to change for me.
Step two:
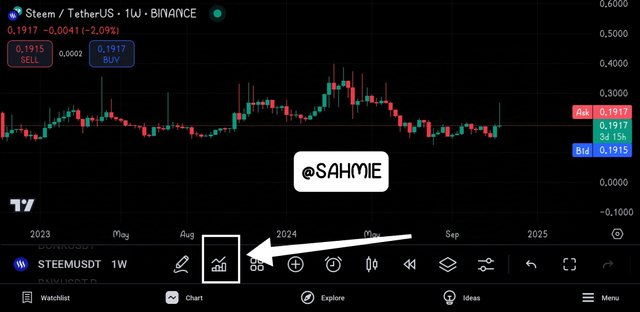
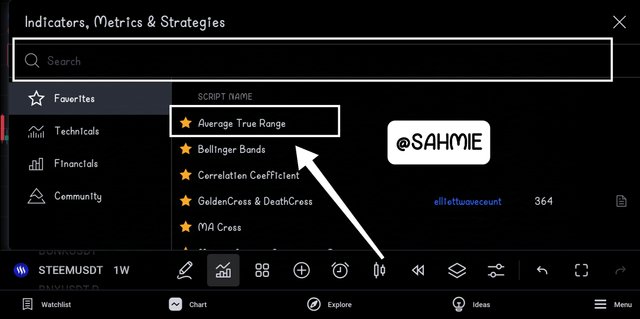
Click on the indicators button as shown below and searched for Average True Range on the search bar and select it from your result to apply, (again, since it's on my favourites, I click it to apply).
Step three:
Once the ATR is applied to the chart (usually found below the chart), you will also see the current value of the ATR at the far right. Don't forget to note the current STEEM price as it's needed for the calculation.
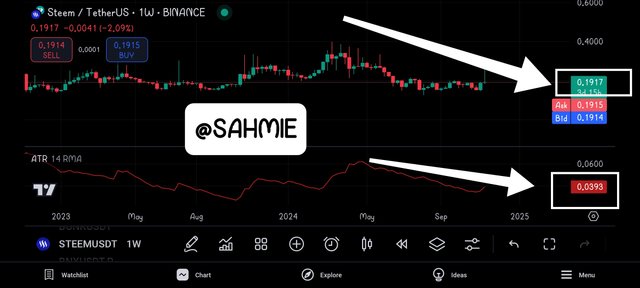
From the screenshot above, we have the ATR value as 0.0393 and the current STEEM price at the time to be 0.1917, so now we can calculate the limit of our ATR based Trailing Stop if our risk factor is 1 as follows;
ATR = 0.0393
Steem price = 0.1917
Risk factor = 1
So, Risk level = 1 X 0.0393 = 0.0393.
Therefore our Stop loss limit = 0.1917 - 0.0393 = 0.1524
This means that our stop loss will be at 0.1524, However as time goes one, we are expected carry out this calculation again to adjust the Stop loss position.
Multi-Timeframe Analysis for Steem’s Bull Run |
|---|
When analyzing a trading pair, in this case the Steem/USDT pair, using different timeframes can really help us refine our trading decisions, especially regarding entry points, stop levels, and profit-taking. This is because by using these different timeframes together, we get to have a comprehensive view of the market. However, what can we get to learn from these different timeframes to improve our overall decision?
Weekly Timeframe:
The weekly timeframe chart gives us the bigger picture of the market as it shows the overall trend for a longer period. Helping us to understand whether the market is in an uptrend, downtrend, or sideways which will improve our decision if we are looking to buy or sell.
For entry points, if the weekly trend is in the upward direction, we would want to look for buying opportunities and decide to enter the market when the price pulls back to a support level.
However, stop loss or exit points can be set just below key support levels identified on the weekly chart. This way, if the price breaks below that level, it indicates a potential change in trend, and we exit our position to limit losses.
Daily Timeframe:
The daily chart tends to provide more detail on the price movements and helps us in seeing shorter-term trends that might not be visible on the weekly chart. Which can also help us to confirm the direction of the trend.
For entry positions, if the daily chart shows a pullback in an uptrend, it could indicate a good time to enter. To support this decision, we can also look for signs of reversal, like bullish candlestick patterns, to confirm our decision.
Stop levels on this timeframe can be more precise, therefore we might want to place our stop just below the most recent low on the daily chart to allow us to protect our position while giving it room to fluctuate.
Hourly Timeframe:
The hourly chart is all about the most recent price action and is great for fine-tuning our trades as it shows us what’s happening right now to help us catch short-term movements.
For entry points, if the hourly chart shows a bounce off a support level while the daily and weekly trends are favorable, it’s a strong signal to buy. However, when it comes to taking profit, the hourly chart can help us to identify when the price is reaching resistance levels or showing signs of exhaustion better. Therefore, we might want to take profits when we see a bearish reversal pattern forming or when the price hits a resistance level.
Having this at the back of our minds, we can now go into analyzing the Steem/USDT chart using these different timeframes. And for this, we will be looking out for the trends across these different timeframes, shall we?
To do this, let's open the weekly chart for Steem/USDT, we will be looking for the overall trend and key support and resistance levels on this timeframe.

The chart is open as shown above, now to identify the trend, key support and resistance we need technical indicators to help us, so click on the indicators button and apply your desired indicators.
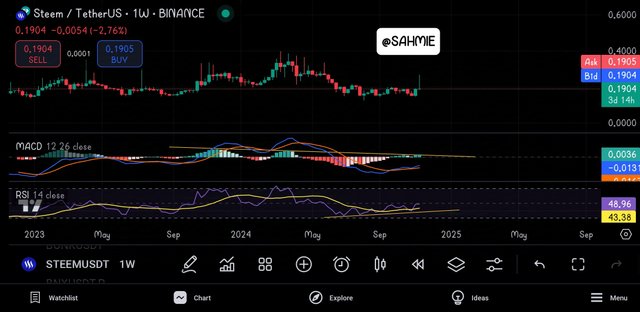
On the above screenshot, I've have applied the MACD and RSI indicators to help me identify the trend of Steem over week. Now from the screenshot above we can see that Steem is on a downward trend on the MACD indicator showing lower highs, whereas earlier weeks are indicating higher lows on the RSI indicator, so I was left to seek for more support, so i used another indicator in Moving Averaging (MA) crossing as shown below.
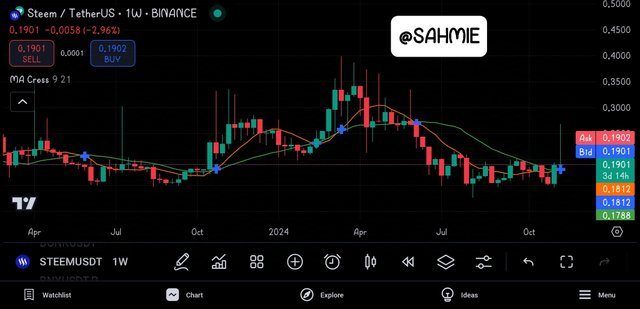
From the above screenshot showing the Moving Average crossing, we can confirm that the price of Steem is a breakout point as the shorter moving average is crossing above the longer moving average indicating an upward trend just as we've seen in the RSI indicator. Next, was to look for key support and resistance level on the chart as shown below.
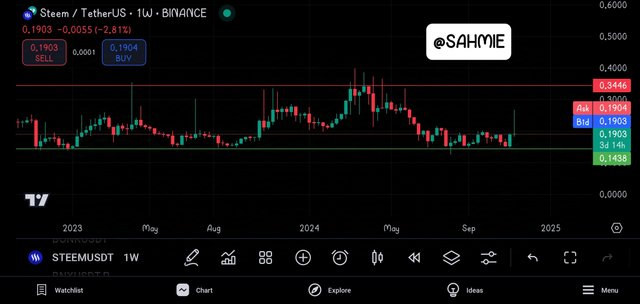
Now, from the above screenshot, we can clearly identify our key support level as 0.1438 and the resistance as 0.3446.
Next, we move on to the daily chart, to give us a more detailed view of the price movements within the week. Here we get to check if the daily trend aligns with the weekly trend. The look for patterns, such as consolidations or breakouts. Having in mind that if the price is consolidating (moving sideways), it might break out in either direction. If it’s trending up, look for pullbacks to buy at lower prices.
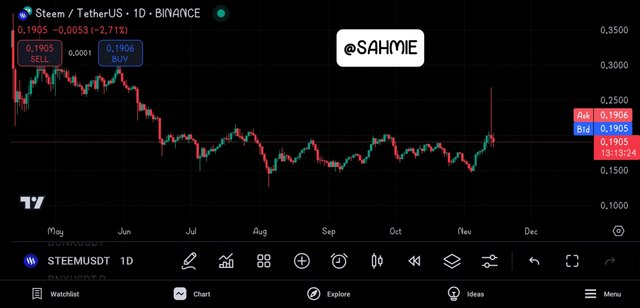
Above is the screenshot of the STEEM/USDT daily chart, to confirm the trends observed on the weekly chart, I applied same indicators as shown below.
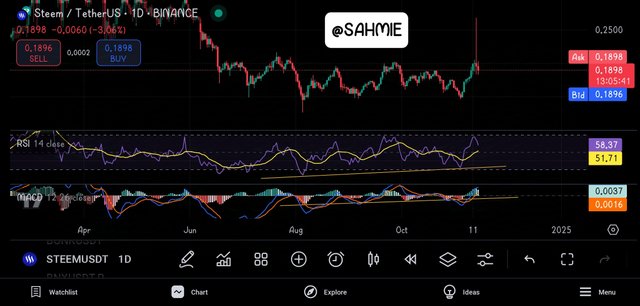
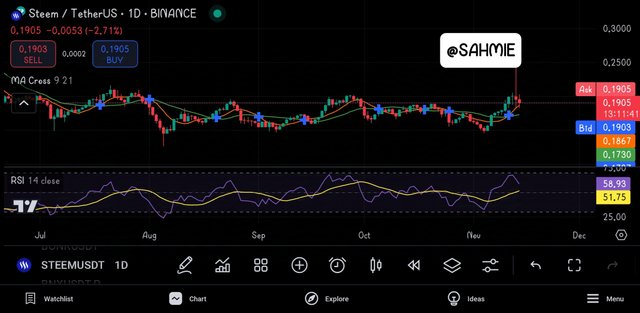
From the screenshots above, we can clearly see that it confirms what was observed on the weekly chart as all three indicators confirmed the upward trend, as both MACD and RSI are giving higher lows whereas the MA crossing shows how the shorter MA is moving above the Longer MA.
Finally, we move onto the hourly chart, because this is where we can see the most recent price action and short-term trends. Here we also looking at how the price behaves in relation to the daily and weekly trends. However, if the daily trend is up, you might look for buying opportunities on the hourly chart when the price dips.
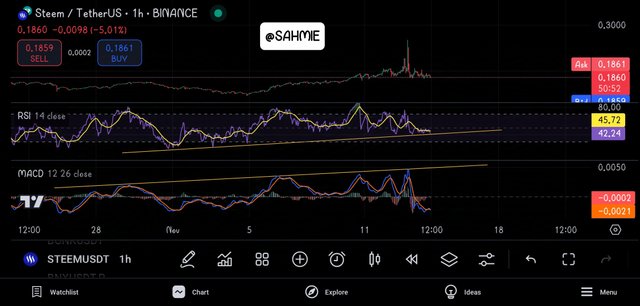
From the screenshot above, shows the hourly chart where the MACD and RSI indicators were applied, and guess what? You are right. It also confirms the upward trends seen in both the Weekly and Daily charts as the RSI indicator indicates higher lows and the MACD indicator shows higher highs.
Now, to buy we need to identify any short-term support and resistance levels to help us make decisions about entry and exit points.
Conclusion
After analyzing all three timeframes, all three timeframes indicates an upward trend, and the hourly chart is also showing a pullback, hence this could be a good buying opportunity.
Adjusting Trailing Stops Based on Multi-Timeframe Analysis |
|---|
Here’s how we can adjust trailing stops using multiple timeframe, using the Average True Range (ATR) as a guide to set your stops.
Weekly ATR for Long-Term Security
Start by calculating the ATR on the weekly chart. The ATR measures market volatility, so when the ATR is higher, it indicates more price movement. For example, if the weekly ATR is 2.00, this means the price typically moves about 2 units each week.
If you're in a long-term trade and the price is moving up, you might set your trailing stop at a distance of 2 times the weekly ATR below the current price. So, if your asset is at 50, your trailing stop would be set at 50 - (2 x 2) = 46. This gives you a buffer against normal price fluctuations while still allowing for upward movement.
Daily ATR for Shorter-Term Adjustments
Now, switch to the daily chart and calculate the daily ATR. Let’s say the daily ATR is 1.00. This means the price typically moves about 1 unit each day.
As the price continues to rise, you can adjust your trailing stop more frequently based on the daily ATR. For instance, if the price moves up to 55, you might set your trailing stop at 55 - (1 x 1) = 54. This adjustment allows you to capture more profit while staying close to the current price action.
Combining Both Timeframes
To maximize your strategy, you can combine both stops. For instance, if your weekly stop is at 46 and your daily stop is at 54, you would use the tighter stop (54) for your current position. This way, you’re still protected by the broader weekly context but can react quickly to the daily price movements.
If the price continues to rise and reaches 60, you could recalculate your daily stop to 60 - (1 x 1) = 59, while still keeping an eye on your weekly stop at 46. This ensures that you lock in profits while maintaining a safety net.
By adjusting the trailing stops based on both the weekly and daily ATR, we've created a flexible strategy that adapts to market conditions, where the weekly ATR provides long-term security and the daily ATR helps us stay responsive to short-term trends, helping us enhance our profit potential while managing risk effectively.
Develop an Advanced Trading Strategy for a Bull Run |
|---|
By combining trailing stops with multi-timeframe analysis, we can create a good strategy that allows us to capitalize on Steem’s bull run and manage risk effectively. To do this well, I need to do certain things, which are;
Identifying the Bull Run
First thing first is to confirm that Steem is in a bull run, and I can do this by looking at higher timeframes, like the weekly or monthly charts, to see if the price is consistently making higher highs and higher lows, as we've learnt last week that this is a good sign of a bull run.
Setting Up Multi-Timeframe Analysis
I will be using the three different timeframes as provided by this lesson which are weekly, daily, and hourly to help me get a comprehensive view of the market. Where;
On the weekly chart, I will have to identify the overall trend direction and look for support and resistance levels.
On the daily chart, I will be keeping an eye for entry points, as this is where I can see more detailed price movements and patterns that indicate when to buy.
Lastly, on the hourly chart, I will have to monitor the short-term price action to fine-tune my entry and exit points.
Having an Entry Strategy
I will have to identify a good entry point on the daily chart to buy Steem. For example, if I see a bullish pattern or a breakout above a resistance level.
Setting My Trailing Stops
After entering my trade, I will calculate the ATR for both the daily and weekly charts. Let’s say the daily ATR is 0.10 and the weekly ATR is 0.50. Then use it to set my initial trailing stop based on the daily ATR. i.e., if I bought Steem at 1.00, I will set my trailing stop at 1.00 - (1 x 0.10) = 0.90, to give me room for the price to move while protecting my investment.
Adjusting My Trailing Stops (if need be)
As the price moves up, I will need to adjust my trailing stop based on the daily ATR. For instance, if the price rises to 1.20, I can recalculate my trailing stop to 1.20 - (1 x 0.10) = 1.10. This way, I will be locking in profits as the price increases.
I will be keeping an eye on the weekly ATR as well. If the price is still trending upward, I can decide to set a wider stop to accommodate larger price swings, perhaps at 1.20 - (1 x 0.50) = 0.70.
My Exit Strategy
If the price starts to reverse and hits my trailing stop, I'll exit the trade automatically and this helps protect my profits without me constantly monitoring the price.
Additionally, if I notice signs of weakness on the higher timeframes (like the weekly chart showing bearish patterns), it might be wise that I exit the trade even if my trailing stop hasn’t been hit yet.
Below are the various criteria to look out for my entry and exit, adjusted the trailing stop levels for each timeframe, and methods to optimize gains while also minimizing risk:
Daily Chart:
Look for bullish patterns like a breakout above a resistance level or a moving average crossover. For example, if Steem has been trading around 1.00 and suddenly breaks above 1.05 with strong volume, that could be a good entry point, because it indicates that buyers are gaining strength.
Confirmation: I will wait for confirmation, like a candle closing above the resistance level to help ensure that the move is likely to continue.
Trailing Stop:
Setting up a trailing stop right after entering the trade. For example, if I enter at 1.05, my initially trailing stop can be set at 1.00 based on the daily ATR.
Profit Targets:
I will consider setting my profit targets based on previous resistance levels or Fibonacci retracement levels. If Steem has a previous high at 1.20, that could be a target where I can consider taking some profits.
Daily Timeframe:
Use the daily ATR to set your trailing stop. If the ATR indicates a volatility of 0.10, and your entry is at 1.05, you might set your trailing stop at 1.05 - 0.10 = 0.95.
Weekly Timeframe:
After a few days of upward movement, check the weekly ATR. If it’s 0.50 and the price is now at 1.20, consider adjusting your trailing stop to 1.20 - 0.50 = 0.70. This gives you a wider stop to avoid being stopped out too early.
Hourly Timeframe:
Use this for fine-tuning. If the price is moving quickly, you can adjust your trailing stop more frequently based on the hourly ATR. For example, if the hourly ATR is 0.05, and the price is at 1.15, you could set your trailing stop at 1.15 - 0.05 = 1.10.
Scaling Out:
As the price rises and hits certain profit targets, consider selling a portion of your holdings. For instance, if you bought 100 Steem at 1.05, you might sell 25 at 1.20 and another 25 at 1.30. This way, you lock in profits while still holding some in case the price continues to rise.
Reassessing Market Conditions:
Regularly check the higher timeframes (like the weekly chart) for signs of a trend reversal. If you see bearish signals, it might be time to tighten your trailing stop or exit the trade entirely.
Using Indicators:
Consider incorporating indicators like the Relative Strength Index (RSI) to gauge overbought or oversold conditions. If the RSI reaches above 70, it might be a signal to take profits or tighten your stop.
Precautions and Limitations of Trailing Stops and Multi-Timeframe Analysis |
|---|
Premature Exit:
Trailing stops can trigger too early if they're set too close to the current price. In a bullish market, prices often rise but can also drop slightly before going back up. If your stop is too tight, you might sell your position during a small dip, missing out on larger gains later.
Market Gaps:
Sometimes, prices move quickly without trading at every level, which is called a gap. If the market opens significantly lower than your stop price, you might sell at a much worse price than you intended. This can happen especially in volatile markets, leading to unexpected loses.
Conflicting Signals:
When using multi-timeframe analysis, you might see different trends on different charts. For example, a daily chart might show a strong upward trend, while an hourly chart might show a downward trend. This can confuse you about what action to take, and you could end up making the wrong decision.
Emotional Reaction:
Watching prices move can create anxiety, especially if you're using trailing stops. If you see your trailing stop getting close to being hit, you might react emotionally and make hasty decisions, like moving the stop or exiting a trade too soon.
Setting the Right Distance:
Finding the right distance for your trailing stop can be tricky. If you set it too far away, you risk losing more profit than necessary. If it's too close, you risk getting stopped out too soon. This balancing act can be challenging, especially for new traders.
False Breakouts:
In a bullish market, there can be sudden price spikes that look like a breakout but are actually false signals. A trailing stop might get triggered during these spikes, leading you to exit a trade that could have continued to rise.
Therefore, to avoid being caught up in the limitations here are some tips:
Set Wider Trailing Stops:
Instead of placing your trailing stop too close to the current price, set it further away. This allows the price to fluctuate a bit without triggering your stop. You can determine a reasonable distance based on how much the price typically moves during the day.
Use Average True Range (ATR):
The ATR indicator measures market volatility. By using it, you can set your trailing stop a certain multiple of the ATR away from the current price. This way, your stop adjusts to the market's volatility, reducing the chance of getting stopped out during normal price swings.
Identify Key Support and Resistance Levels:
Look for significant support and resistance levels on your charts. Place your trailing stop below support levels for long positions, as these levels are where prices tend to bounce back. This gives your trade room to breathe while still protecting your profits.
Wait for Confirmation:
Before adjusting your stops based on price movements, wait for confirmation signals, like candlestick patterns or indicators that show a trend is reversing. This can help you avoid reacting too quickly to minor price changes.
Analyze Multiple Timeframes:
When looking for trend reversal signals, check multiple timeframes. For example, if you're trading on a daily chart, also look at the weekly and hourly charts. If you see a reversal signal on the daily chart confirmed by a similar signal on the weekly chart, it’s more likely to be reliable.
Look for Divergence:
Divergence occurs when the price moves in one direction while an indicator (like RSI or MACD) moves in the opposite direction. This can signal a potential trend reversal. Checking for divergence across timeframes can provide stronger confirmation of a trend change.
Practice Patience:
Sometimes, the market takes time to show clear signals. Avoid the temptation to react immediately to every price movement. Trust your analysis and wait for clear, confirmed signals before making adjustments.
DISCLAIMER: Everything on this publication is not in any way a trading advice but just a piece of my understanding for learning purposes.
I wish to invite @starrchris, @bossj23, @ngoenyi, and @ruthjoe.
Thank You for your Time
NOTE: Always have a smile on your face, as you are never fully dressed without one.

Upvoted! Thank you for supporting witness @jswit.