SEC S18-W4 || Mastering Liquidity Levels in Trading
 |
|---|
Greetings friends and welcome to my participation in this week's engagement challenge where we are to learn about mastering liquidity trading levels. As I share my knowledge and findings, I hope you get to learn something new as I attend to the hints provided.
Describe the concept of liquidity levels in trading. Why are they important for traders? What indicators or tools are used to identify these levels on a price chart? |
|---|
As someone who likes swimming, I would like us to look at the concept of liquidity in this aspect, after all, liquidity sounds similar to liquid. Therefore, we can look at liquidity as a pool with water (liquid) for everyone to dive in or out, with the various levels of water taken as the levels of liquidity.
Knowing what Liquidity is all, about it is safe to say that Liquidity levels in trading are like the different water levels in the pool which determines how easy or hard it is to take a swim (buy or sell a stock or asset). Hence, here are the main liquidity levels:
High Liquidity:
This is like the big pool where buying and selling happens in large volume without causing much price change, hence making it easy to trade at this level without affecting the market much, just like the swimmers jumping in without causing much overflow of the pool.
Medium Liquidity:
This is like a smaller pool where trading can still happen smoothly, but then big trades at this level might cause a bit of a ripple in prices.
Low Liquidity:
This is like a tiny pool where everything is tight and close and even small trades can cause big price swings making it riskier to trade as it is harder to buy or sell without changing the price a lot.
Now that we know what Liquidity and liquidity levels are all about, what makes these levels so important for traders? Well, these levels are important to traders because it is like having a bustling market where you can easily buy and sell. Hence are some of the main reasons why liquidity is important:
Ease of Trading:
Liquidity ensures that traders can quickly enter and exit positions without significantly impacting the price. It's like shopping in a busy market where you can buy and sell without waiting too long or affecting the prices too much.
Narrow Bid-Ask Spread:
High liquidity often results in a narrow bid-ask spread, meaning that the difference between buying and selling prices is small. This is beneficial for traders as it reduces trading costs and improves the overall efficiency of trading.
Price Stability:
In liquid markets, prices tend to be more stable because there are enough buyers and sellers. This stability helps traders make more accurate predictions and execute trades at desired prices.
Reduced Slippage:
Slippage occurs when the intended price of a trade is different from the executed price due to market volatility. With high liquidity, slippage is minimized as more participants are willing to trade at various price levels.
Risk Management:
Liquidity allows traders to manage risk effectively by easily entering and exiting positions. It provides flexibility and the ability to adjust trading strategies promptly based on changing market conditions.
Access to Diverse Assets:
Liquid markets offer a wide range of assets to trade, providing traders with more opportunities to diversify their portfolios and explore different investment options.
Market Confidence:
A liquid market instils confidence in traders as they know they can easily convert their assets into cash when needed. This confidence encourages active participation and contributes to market stability.
Okay, next in line is knowing how we can identify the different liquidity levels on a price chart, to this, traders can look out for a few key indicators, such as:
VOLUME BARS INDICATOR:
Keeping an eye on the volume bars at the bottom of the chart (in most charts) gives information about the liquidity of the asset in view where taller bars indicate higher trading activity and better liquidity. When you see those bars reaching for the sky, it is a sign that there is more action and liquidity in the market.
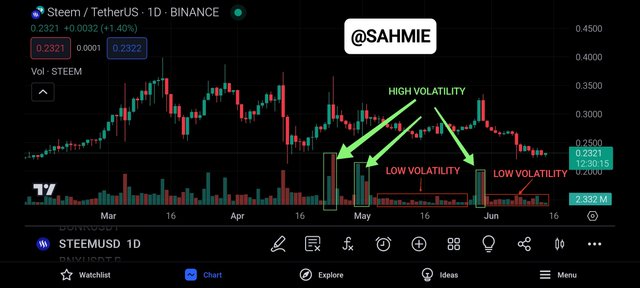 |
|---|
Then again, the green bars indicate that the current state of trading is in favour of an upward trend, that is more buying is happening, whereas the red bars indicate that the market is in favour of a downward trend.
Most trading software like Bitcoin, Bybit, OKX etc shows this indicator automatically below the chart, however, it's not so with Tradeview, so to add the volume bar indicator to your charts on Tradeview, follow the steps below;
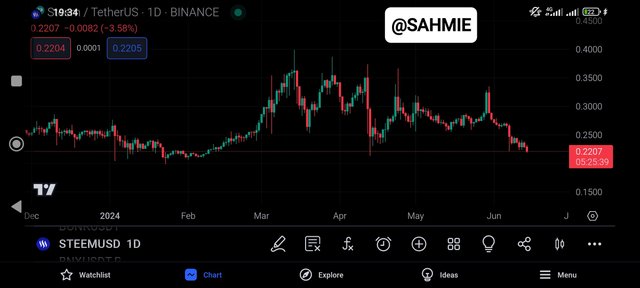
STEP 1: Open your desired chart, in my case STEEM/USDT chart, under a 1-day timeframe.
STEP 2: On the chart, click on the indicators button at the bottom of the chart (for App) and top of the chart (for web).
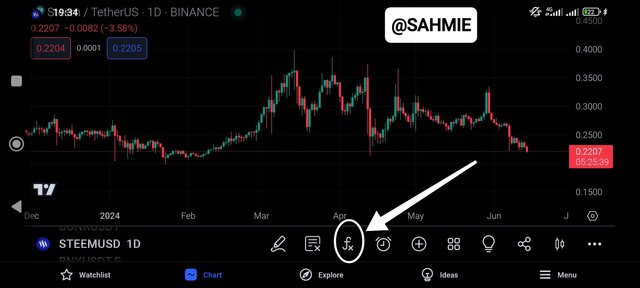
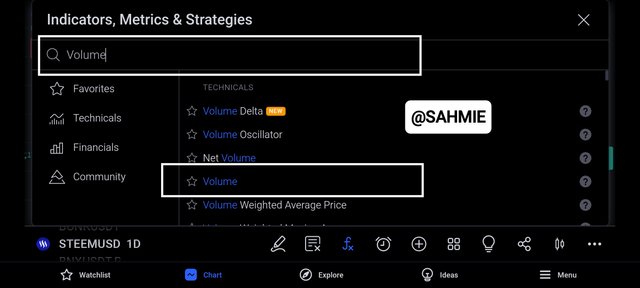
STEP 3: In the indicators menu, search for the volume indicator by typing "Volume" into the search box.
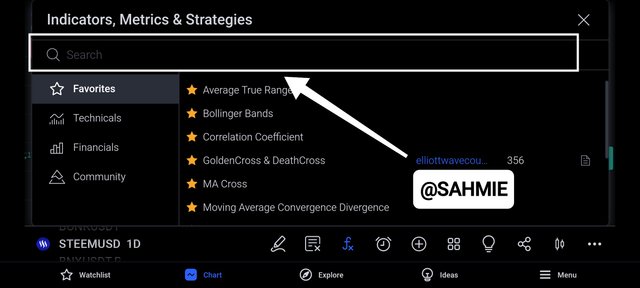
STEP 4: From the search results, select the volume option to apply this indicator to your chart.
BID-ASK SPREAD INDICATOR:
This is an indicator that looks at the spread, i.e., the difference between the Bid and Ask prices of an asset. Therefore keeping an eye on this indicator can give clues to the various liquidity levels of an asset. When looking at this indicator, a narrow spread indicates high liquidity, making it easier to trade without much price impact. Whereas, a wide bid-ask spread indicates low liquidity levels.
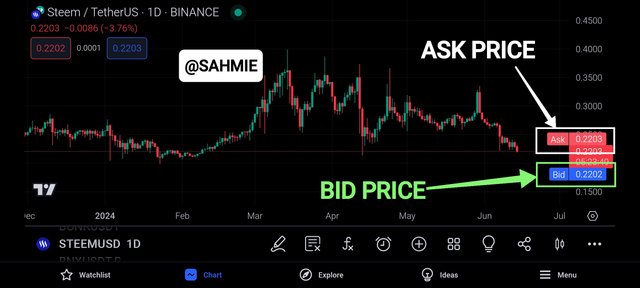
From the above screenshot, we can say the market is volatile as the bid-ask spread is minimal, that is;
Bid = 0.2202
Ask = 0.2203
Hence, Spread = 0.2203 - 0.2202 = 0.0001 = 0.1 pip
You might be wondering why, right? well here is why. The "bid" is the price buyers are willing to pay, while the "ask" is the price sellers want, hence the spread is the difference between what the buyers are willing to pay and what the sellers want for that asset, therefore when the spread is tight (close), it means that both buyers and sellers agree on the price, but if it is wide, it means the difference in price valuation is big and there might be disagreement, making it hard for traders to enter and exit trade easily.
To add the Bid-Ask Spread indicator to your charts on Tradeview, follow the steps below;
STEP 1: Open your desired chart, in my case STEEM/USDT chart, under 1 day timeframe.
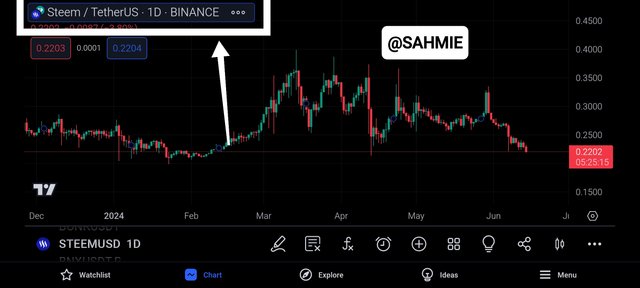
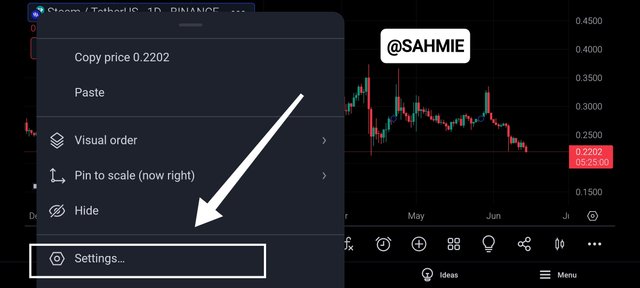
STEP 2: Click on the chart tag, then on the three dots in front as shown below.
STEP 3: Scroll down the menu to find "Settings" below as the last option and click on it, as shown below.
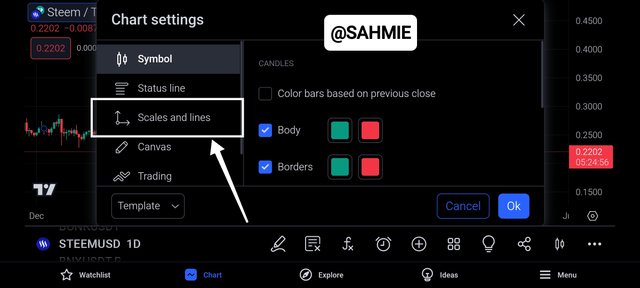
STEP 4: Under settings, click on "Scales and Lines" as shown below
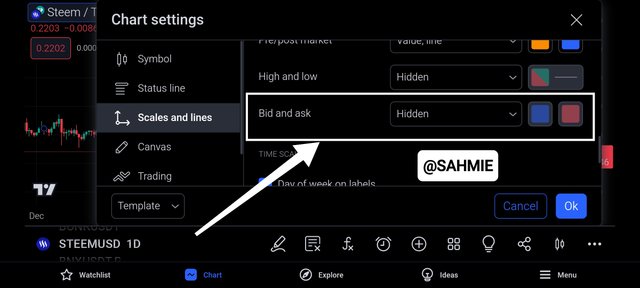
STEP 4: Under the scales and lines menu, scroll down to the Bid and Ask menu and click on the "hidden option" as shown below
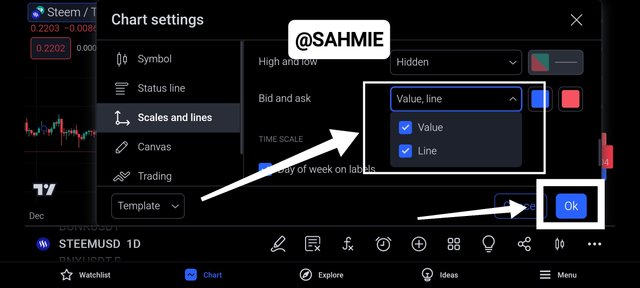
STEP 5: Open the hidden option and select both value and lines, then click on "OK" to add both the Bid and Ask Values and Lines to your chart, as shown below.
PRICE MOVEMENTS:
Watch how prices move on the chart, especially during high trading volumes. If prices change smoothly and without significant gaps, it's a sign of good liquidity. But then, if you notice sudden jumps or erratic movements, it could indicate lower liquidity levels.
By paying attention to these indicators on the price chart, traders can get a clearer picture of liquidity levels in the market.
What is a Fakeout in the context of liquidity levels? Explain why and how traders are often trapped by Fakeouts. |
|---|
Trading can be likened to a busy auction where every trader is bidding for an asset, therefore a Fakeout happens the asset appears to have significant interest in buying or selling at a certain price, which makes it look like a big move is about to happen, so traders seeing this increased activity, thinks it is a good signal to enter a trade, then suddenly this significant interest disappears, turning out to be a deceit.
 |
|---|
 |
|---|
Just like an auctioneer shouts out loud in an auction to make it look like there is a lot of interest in an item, but in reality, there is no intention of actually buying the item. In trading, some traders create the illusion of high liquidity at a certain price level to trick others into entering trades based on these false signals, where the market often quickly reverses, catching those who entered trades based on the false signal off guard.
Therefore, traders get caught in these fakeouts because they fall victim to the action they see happening at the price level, which gives them the impression that a big move is about to happen, so they jump into a trade thinking they are making a smart move and hoping to make a profit. In their worst nightmare, the market quickly turns around, and those who fell for this increased activity end up in a bad spot, just like getting fooled at the auction.
Describe an effective strategy for trading liquidity levels correctly. What signs or confirmations should traders look for before taking a position based on a liquidity level? |
|---|
Generally, it is always important to look for genuine signals amidst the noise in trading. Therefore an effective strategy would be for traders to be patient and wait for confirmation before making a move. This confirmation could come from factors like significant trading volume, price movements aligning with the expected direction, or other technical indicators supporting the liquidity levels.
This is because, by waiting for these confirmations, traders can avoid falling for fakeouts and make more informed decisions, which can be likened to being a savvy shopper at the market who doesn't just buy something. After all, everyone else seems interested in it but rather wait for the right signs to show that it's a good deal. Therefore the strategy is to be Patient, observant, and confirm your next move which are key to trading smartly around liquidity levels.
Talking about confirmations and signs, some signs or confirmations traders should look for before taking a position based on a liquidity level are;
Volume Confirmation:
Traders should pay attention to the trading volume. If there's a surge in volume accompanying the liquidity levels, it can indicate genuine market interest.
Price Movement Alignment:
It's essential to observe if the price movement aligns with the expected direction based on the liquidity levels. If the price behaves as anticipated, it provides further confirmation of a valid trading opportunity.
Supporting Indicators:
Traders should use other technical indicators to validate the signals provided by liquidity levels. These indicators could include moving averages, trend lines, or oscillators, which can help confirm the strength of the market activity.
Market Depth:
Checking the market depth, which shows the buy and sell orders at different price levels, can also provide insights. A strong liquidity level supported by significant orders can indicate a more reliable trading opportunity.
What are some tips and techniques to avoid Fakeouts when using a trading strategy based on liquidity levels? Give a concrete example with detailed steps |
|---|
Take a clue from the last section where I already talked about signals and confirmations to have an eye on, here are some tips and techniques to use.
Volume Watch:
Keep an eye on the trading volume. If there's a sudden spike in volume along with a liquidity level, it is like seeing a lot of people genuinely interested in a product in the market. This can signal a real trading opportunity.
Price Movement Check:
Make sure the price movements match what you expect based on the liquidity levels. This is like making sure the price of a fruit at the market is going up when everyone is buying it. If the price behaves as you predicted, it strengthens the validity of the trade.
Use Indicators:
Employ other tools like moving averages or trend lines to back up the signals from liquidity levels. Think of these indicators as extra helpers at the market guiding you on whether it's a good deal or not.
For example, let us assume we see a lot of buying interest at a certain price level for an asset we are watching. But instead of rushing into a trade, we wait and observe, while also keeping our eyes on the trading volume, then we notice the trading volume is increasing significantly, then the price also starts to rise or fall as expected, and our indicators too are all showing positive signs. Therefore, since these multiple confirmations give us the green light to enter the trade, we can now confidently enter the trade knowing it is not a fakeout but a genuine opportunity based on the market's activity. But then, with all confidence we can still set up our stop loss at a considerable level so we don't fall victim as nothing is certain.
But then, by being patient, checking various factors, and seeking multiple confirmations, we can avoid the pitfalls of fakeouts and make more informed trading decisions when using liquidity levels as part of our strategy.
Analyze a chart of a crypto asset of your choice, including the Steem token, to identify liquidity levels. Describe a potential trade based on these levels by explaining your reasoning and the steps you would take to enter and exit the position. |
|---|
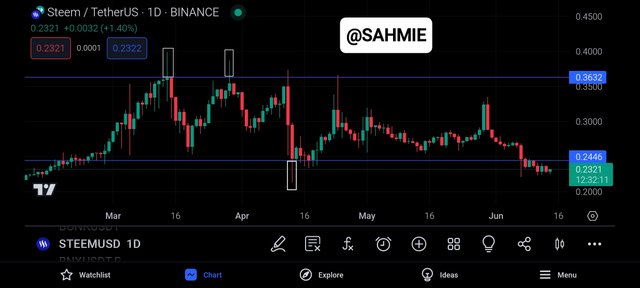
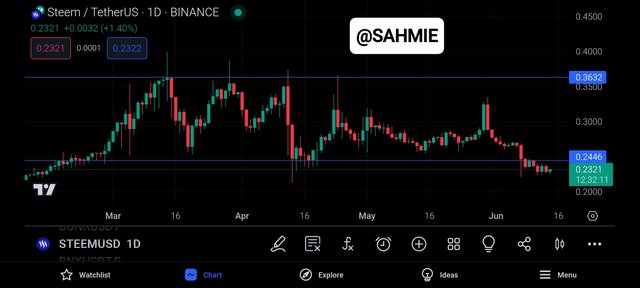
Above is a screenshot of STEEM/USDT chart on a 1-day timeframe, to identify liquidity levels, we are looking at the trading volume and price action on the chart, where high trading volume indicates higher liquidity levels, as more traders are buying and selling the asset. We can see these levels mostly below a major support level and above a majority resistance level, because at these levels supply and demand increase.
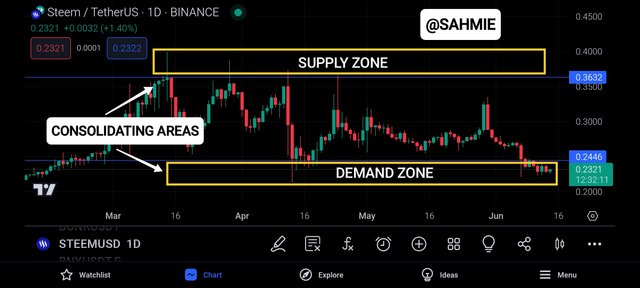
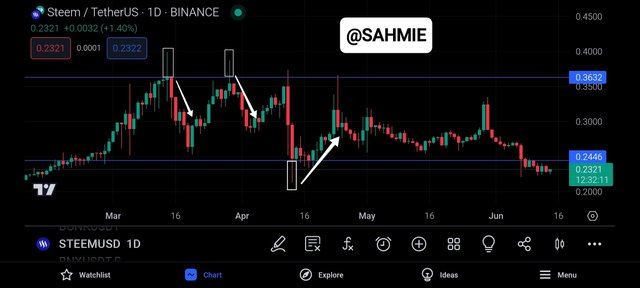
Based on these liquidity levels, a potential trade could be to enter a buy or sell position if the price has been consolidating for a while and then breaks out of the consolidation to the upside (breaking support level) for buy, and downside (breaking resistance level) for sell, with high trading volume, indicating increased liquidity.
Additionally, I may want to confirm the bullish/bearish momentum by using technical indicators such as the Relative Strength Index (RSI) or Moving Averages Convergence Divergence (MACD) for better-informed trading.
Hence, I will be setting my limit order to buy slightly above the support level or sell just below the resistance level, to ensure I get filled at a good price without overpaying. To manage my risk, I will be placing a stop-loss (SL) order by;
Adding the Average True Range (ATR) value of the last 21 days to the resistance level for selling positions.
Subtracting the Average True Range (ATR) value of the last 21 days from the support level for buy positions.
This means it would be slightly above or below the consolidation or breakout point to limit losses if the trade goes against me.
To exit the trade, I will also be setting a take-profit (TP) order at a price level that offers a good risk-to-reward ratio or wait for a signal from my technical indicators to indicate a price reversal or a change in trend, such as the Moving Averages crossing.
Thank You for your Time
I want to take this opportunity to invite @starrchris, @ngoenyi, @chants and @ruthjoe.
NOTE: Always have a smile on your face, as you are never fully dressed without one.

Upvoted. Thank You for sending some of your rewards to @null. It will make Steem stronger.
Informative blog. step by step explanation is easy to understand and give proper insights. Confirming signals with additional indicator is a key note. Thank you.
Greetings my friend @sahmie,
Wow, this is so informative! Confirming signals with additional indicators is key. It’s like having extra helpers guiding your trades!
All the best in the contest, success for you👍.
Your post has been successfully curated by our team via @steemdoctor1 at 35%.
Thank you for your committed efforts, we urge you to do more and keep posting high-quality content for a chance to earn valuable upvotes from our team of curators and why not be selected for an additional upvote later this week in our top selection.
@sahmie Your discussion is excellent:
Hola amigo, los desafìos cada vez se ponen mas interesantes y me ha obligado a leer mucho para entender las cosas nuevas. Los niveles de liquidez en trading son básicos para entender la dinámica del mercado.
Es interesante ver hacia donde se mueve el dinero y cual es el siguiente paso en una tendencia se vuelve un rompecabezas. Estos indicadores que como el RSI, el volúmen, la información de las velas así como la determinación de las resistencias y soportes, la detección de falsas rupturas, los stop-loss entre otros, son herramientas que ayudan en el juego del trading.
Me la pasé leyendo varias hora para entender este rompecabezas. La verdad que cada indicador y herramienta aporta información muy valiosa que otros no muestran. Es como ver la misma moneda desde diferentes perspectivas.
Gracias por compartir, saludos, éxito y un fuerte abrazo.
Hey there.
It's awesome to hear how you're diving into those trading challenges and expanding your knowledge. Liquidity levels really are the foundation for understanding how the market moves. It's like putting together puzzle pieces to figure out where the money's flowing and what the next trend might be. Indicators like RSI, volume, and candle info, along with spotting resistance and support levels, false breakouts, and setting stop-loss points are all like tools in your trading toolbox, helping you navigate the market game. I totally get how each indicator gives you a unique perspective, like looking at the same coin from different angles. Keep up the great work with your research and trading journey. Wishing you success and sending a big hug your way.
Saludos amigo, ¡buena suerte!
I have really learn a lot from this post Sir.
Thanks for sharing