Trading Steem with the Ichimoku Cloud
INTRDODUCTION
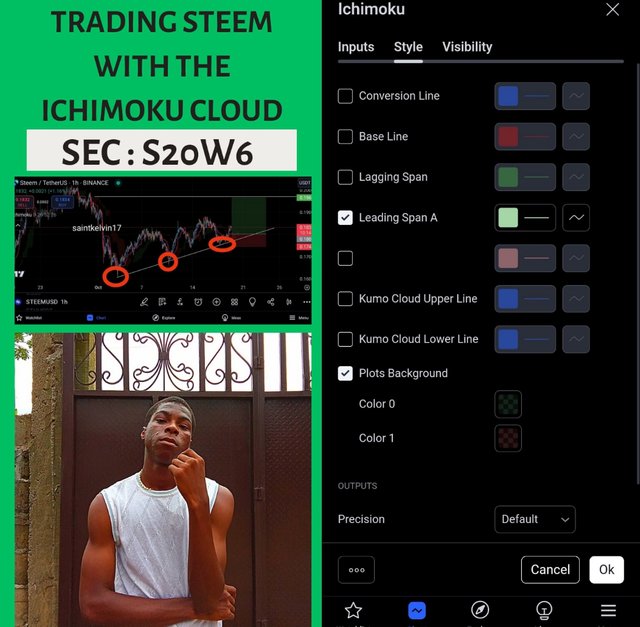
Today is will be talking about the process involved in trading steem with the Ichimoku Cloud and I will also explain alot of things based on the questions by the professor.
Question 1: Explain the Five Components of the Ichimoku Cloud
1.) Tenkan-sen (Conversion Line)
The conversion line or more commonly referred to as the Tenkan-sen is one of the most active elements of Ichimoku Cloud and is the most volatile. It is derived from the mean of the highest high price and the lowest low price over nine previous periods. It might be simple in mathematics, however, it is highly useful in interpreting short-term changes in price action. With the emergence of the Tenkan-sen, it gives a scope for the traders to respond actively to the changing trends as it gives the areas to enter and exit the market. If the price is consolidating above the Tenkan-sen then it can be considered an up-trend in a short time, while against this if the price is turning and staying under the Tenkan-sen then it is a down-trend in a short period. In other technical tools, it is often likened to short term moving averages and tends to present the marked forecast for a very short span of time.
Apart from its purpose of locating short-term reversible movements, the Tenkan-sen serves more such as a trigger line for triggering buying and sell signals. Its crosses above or under the Kijun-sen (The baseline), create additional signaling in the Ichimoku Cloud, which is like the golden cross and the death cross in other systems. When the Tenkan-sen cuts the Kijun-sen upwards, it is a buy signal while a sell signal occurs when it crosses downwards. These provide traders with possible entry and exit zones and thus the Tenkan-sen is a key element of short-term trading strategies within the Ichimoku system.
What most traders like about the Tenkan-sen is that it is very fast to react to the market price and keeps traders updated on the current strength or weakness of the price. Unfortunately, being quick has its negative aspects and that is where a lot of false signals are generated particularly in choppy or sideways markets. Local markets tendencies are avoided by many traders who use the Tenkan-sen alongside with other constituents of the Ichimoku Cloud. The same applies when it comes to losing positions because after drawing the Tenkan-sen most traders can go that far cooking up a bearish perspective only to lose again when they have already incorporated the Kijun-sen or the Senkou Spans.
2.) Kijun-sen (Base Line)
Kijun-sen, or baseline, compared to tenkan-sen is the slowest element of ichimoku clouds. This is calculated by adding the lowest low and the highest high of the past 26 periods and dividing it by 2. Due to this longer calculation period of time, the Kijun-sen turns out to be more stable and the medium term direction can be tracked more effectively.. This gives the traders some idea regarding which side of the market they should not go to. For instance, where the price action is above the Kijun-sen, the correlation would indicate that the trend is upwards. Where the price movements fall strictly beneath the Kijun-sen, this indicates that the trend is downwards.
Pivots, moving averages, and Kijun-sen levels with their attributes are heavily utilized and considered valuable in adding dynamic support or resistance to the overall movement of the price. This is usually how the horizontal line is viewed in the children’s world. For instance, when the price continues making higher highs and deeper lows during an uptrend, the price will tend to come back down to the Kijun-sen before going higher again. Also, making lower lows and lower highs would mean the price will tend to go back up to the Kijun-sen before coming back down again. In this case, the Kijun-Sen Line becomes quite convenient in forecasting possible local reversals and consolidations of the price within an uptrend or downtrend when used with other components of the Ichimoku cloud.
The Kijun-sen also in combination with the Tenkan-sen works in the center of the crossover signals of the Ichimoku cloud. As stated before, such internal dynamics of the Ichimoku system transforms into divergent signals towards the bullish Gim as the Tenkan-sen moves above the Kijun-sen and bearish when going the geater below the sen. However, while the Kijun-sen is less reactive compared to the Tenkan-sen, it works as a filter and suppresses a few unnecessary price variantes and false signals which the latter may entail during extreme oscillating or choppy price conditions. Effectively, these traders support the Kijun-sen direction trends with high volumes and thus smooth medium-term fluctuations.
3.) Senkou Span A (Leading Span A)
Senkou Span A, or Leading Span A, is the first from the two lines which defines the Ichimoku Cloud in terms of its boundaries. This is done by taking the average of the preceding ten as well as the kijo sen and thereafter shifting the resulting figure ahead by 26 periods. Such forward looking aspect is one of the major distinguishing features of Ichimoku Clouds as it gives the traders a foresight of potential support and resistance levels. Senkou Span A functions similarly forming the upper edge of the cloud in an active market and the lower edge in a depressed one.
Senkou Span A is mainly concerned with the purpose of demarcating the extent of the cloud. The cloud always provides dynamic supports to the market coming from above and closes the price gaps at the extremes. Once prices retreat beyond the cloud, then it signals the end of bullish activities in the market and supposed the cloud to substitute resistance. But if prices stay beneath the cloud, bullish activity is over and the market is internally bearish with the cloud preventing upside breakthrough. The cloud thickness mean good market strength or volatility; a thick cloud brings more change to price movement while a thin cloud means directional waning or changing conditions to range.
As far as strategy is concerned, Senkou Span A is an especially helpful tool for traders who wish to forecast the market conditions ahead. Since it is drawn 26 periods later in the future and therefore, has an element of prediction that helps the traders understand the level of resistance and support the market may reach at the nearest possible time. The reason for such a way of thinking about Senkou Span a is that this is the only indicator which solely relates to aspiring it helps to understand all the trends down to the hourly chart for a advanced price action strategy that expects trend changes and trend breakouts.
4.) Senkou Span B (Leading Span B)
Senkou Span B is the second of the Ichimoku Cloud lining, but the line is generally slower and stable than Senkou Span A. It is derived from taking the average high low value over a period of 52 time frames and projecting it forward 26 time frames. Since it takes into account longer time horizons, Senkou Span B is less affected by changes in the price over short time frames, hence being a reliable measure of the more longer term support and resistance levels.
Senkou Span B like Senkou Span A also assist in delineating the edges of the cloud which comes as aid for the traders to visualize where he potential support and resistance areas are situated in the market. More horizontal in rising markets than in progressive bullish ones, Senkou Span B is often the most back side of the cloud since it always comes out after Senkou Span A has shown itself because it takes time to react. Senkou Span B serves as the lower boundary, holding the price when it is above the cloud and Senkou Span B serves as the upper boundary containing the price when it is below the cloud. Lapayowker (1986) observes that the distance between Senkou Span A and Senkou Span B also shows the force of the market, wider distances indicative of volatile movements and narrower movements showing lateral movement.
Traders commonly employ Senkou Span B in order to make quantitative assessments of the trend. For example, when the price is quite a distance above Senkou Span B and the cloud is ‘thick’, it tells that the market is ‘bullish’. In the contrary, should the price be well below Senkou Span B and the cloud is thick, it indicates a strong downtrend. Senkou Span B’s slower reaction time makes it particularly useful for long-term traders who want to avoid the noise of short-term price movements and focus on the broader market trend.
5.) Chikou Span (Lagging Span)
The third part of the Ichimoku Cloud is the Chikou Span (or the lagging span). While the earlier lines are plotted in advance, the Chikou Span is traced backward by 26 periods from the present price. This provides traders with a gauge comparing the present price of a security to how it has traded in the past. If the Chikou Span is above where the price was 26 periods ago, the bulls are in control and if it goes lower, the bear is in control. Thus, the Chikou Span allows traders to mitigate the degree of force ion the trend so as to help avert making structural mistakes in the action in view, hence the Chikou Span as a form of a lagging indicator in strategy formulation.
The main purpose of Chikou Span is to provide trend and momentum direction as confirmation. If the Chikou Span is above the price 26 periods ago, the trend remains bullish and one can seek for entry levels for buying position. On the other hand, if the Chikou Span is below the price 26 periods ago, the trend is considered bearish and one can look for favorable levels to take short positions. The Chikou Span aids is to ensure the safety of actions by restraining the limbic acting elements by complacent extreme price deviations and hence the reason why Coming Span is normally compromised by the term ‘lagging’ being underestimated.
Besides confirming trends, it is also possible to deduce possible reversals using the Chikou Span. For instance, if the Chikou Span crosses above the price which is 26 periods back, it can be viewed as an indication of a forthcoming bullish phase. Likewise, if the Chikou Span crosses below the price which is 26 periods back, it can suggest the beginning of a bearish trend. The Chikou Span gives added information to traders about market momentum and the timing of their market entry and exits.
How does each component contribute to understanding market trends and making trading decisions for the Steem token?
- Tenkan-sen (Conversion Line)
The Tenkan-sen is an indicator that is sensitive to price movement in a very short period. This makes it suitable especially for watching the short term momentum for Steem. It does so since it computes an average of the highest high and lowest low of the previous nine periods. This allows enough time for traders to anticipate changes. For Steem, whenever the price is beyond the Tenkan-sen average, it is a bullish market, and the same is applicable vice-versa. Therefore, for the short term investors in Steem who wish to profit from quick price changes in the trends, the use of Tenkan-sen can be very beneficial.
Furthermore, the importance of the Kijun-sen invokes a crossover phenomenon while in the company of the Tenkan-sen. The bullish Tenkan-sen/Kijun-sen crossover is said to signal entry in Steem and a reversal signal – bearish cross – signals against entry into Steem with expectation of profiting. These crossovers as a rule signify a great possibility of a market trend being persistent especially in the cryptocurrency space which is quite volatile with cryptocurrency such as Steem. Such signals are appropriate for short term participants as they directly address future prices specifically entry and exit points within short time horizons especially when the said standing orders are quite far away.
- Kijun-sen (Base Line)
The Kijun-sen represents such an outlook based on information from prior history, as she takes information on the highest high and lowest low over the last 26 average periods. The Kijun Sen enables Steem traders to maintain a constant reference level and look at the market trends concerning the token. Steem prices are interpreted to be in a bullish phase when the price is above the Kijun-sen while a bearish outlook is predicted when the price is below the line. For instance, owing to the Kijun-sen’s slower movement, in relation to the Tenkan-sen, it is more favorable to use the Kijun-sen in the trading strategy and determine profit targets in the middle term.
Also, the Kijun-sen is one such average, which manages to filter out the day-to-day noise and is vital for traders who would rather be of the noise. The Kijun-sen stands out because of the aid it plays in the decision-making of the market participants as one trend is dominant at a certain period. Utilized together with the Tenkan-sen for crossover signals, the Kijun-sen also plays a significant role in trading for the capturing of longer-term trends of Steem, thus improving the overall decision-making ability.
- Senkou Span A (Leading Span A)
Senkou Span A is a boundary of the Ichimoku cloud which drops when Steem price is in an uptrend and gives the charting operator the probability of it acting as dynamic support or resistance zone. It is derived by taking average of the Tenkan-sen and Kijun-sen but this average is plotted 26 periods ahead which provides a useful tool for anticipating future movements in the market. Speaking of Steem when the price is over Senkou Span A it signifies the bullish trend and this level acts as a support zone, where price action is expected to cool off for a while before again going upwards.
For the support sitting on future expectation, Senkou Span A is crucial because it helps in forecasting where support or resistance will be located in the forthcoming periods. Because it is looking ahead, it can be integrated into the strategies of the traders allowing them to make their arrangements in good time trusting that Steem will receive serious volatility at these particular levels. This way, Senkou Span A becomes indispensable not as a trade sign but as an assisting tool in determining the behavior of markets in the trending Steem markets.
- Senkou Span B (Leading Span B)
Senkou Span B serves as the lower range of the Ichimoku cloud and is computed as an average of the highest high and the lowest low in the past 52 periods and then projecting it into the future 26 periods. In Steem token trading, this span gives a long-term view as well as a steady view of the market and assists in determining the levels of long-term support and resistance. If the Senkou Span B is positioned at the top of the cloud when the price is trending downwards, it will serve as a resistance zone and allows traders to measure the point where price could reverse or zone of selling.
While determining the size of the cloud, Senkou Span B perception also encompasses the volatility of Steem. A thicker cloud indicates that Steem’s market is more volatile than thinner clouds which represent weaker directional trends or range bound consolidation. This is very significant to long term investors they wish to acquire Steem for a long time but want to be aware of the future trends without overexposure to short term fluctuations.
- Chikou Span (Lagging Span)
The Chikou Span is located among this Cloud as the lagging span albeit lagging far backaway with a head of 26 in comparison with the current price. It is helpful especially in the volume trade of the Steem token. The Chikou Span translates into market bullishness when it is higher than the price 26 time units back but bearishness when lower. For traders, they call it the lagging span because it offers support whenever the signals from the other components of the system misalign with the general trend in the market.
Moreover, the Chikou Span will also assist the traders in Steem for spotting price action bearish and bullish reversal. For example, a bullish reversal may occur if the Chikou Span crosses above the price of the past 26 periods giving prospective traders an appetite to restock. On the other hand, a bearish reversal action is indicated whenever the Chikou Span drops below the price. In offering this type of confirmation, the Chikou Span assists traders in over committing to a buy or sell position in Steem.
Conclusion
To summarize, each indicator within the Ichimoku Cloud contributes information on the trading of Steem token to the traders for the short, medium, and long terms. In this respect, the Ichimoku Cloud is an all-encompassing means of comprehending market conditions and assisting in more effective trading strategies, whether by the immediate direction of the player (against sell-side, Tenkan-sen), within the time frame of a week to a month with support and resistance levels (Kijun-sen), by predicting further market developments (Senkou Span A and B), or when determined by the previous price action (Chikou Span).
Question 2: Analyzing Trend Direction with the Ichimoku Cloud
In this section, I will be giving an analysis of the trend direction using the ichimoku cloud indicator and before that, I will love to show a step by step process on how this indicator can be applied to the chart.
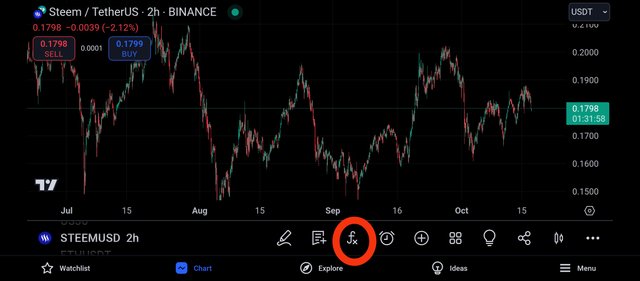
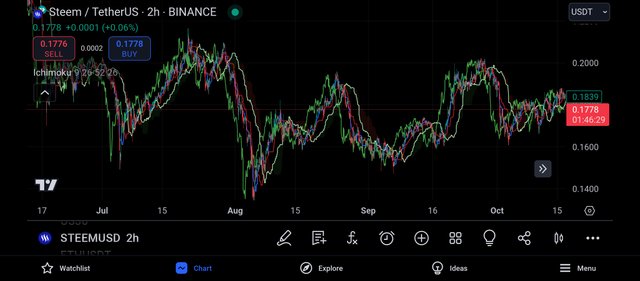
I then visited my trading view app, which is where I can find the ichimoku cloud indicator and then I moved straight to the pair STEEMUSDT which is the pair that I am required to carry out my analysis on.
And on my trading view, I clicked on the icon labeled "FX" which is the icon responsible for the application of indicators to the price chart.
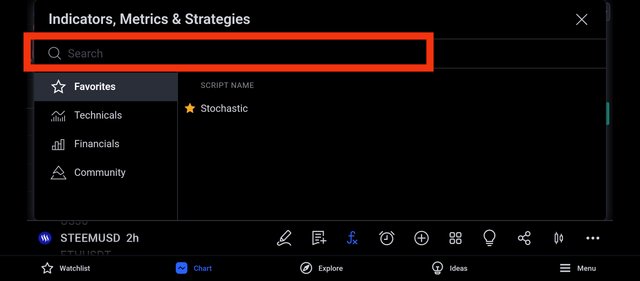
After clicking on the FX icon, the above screenshot appeared and then I decided to search for the needed indicator.
As indicated above with the red rectangle is the search button and then I proceeded to search for my required indicator.
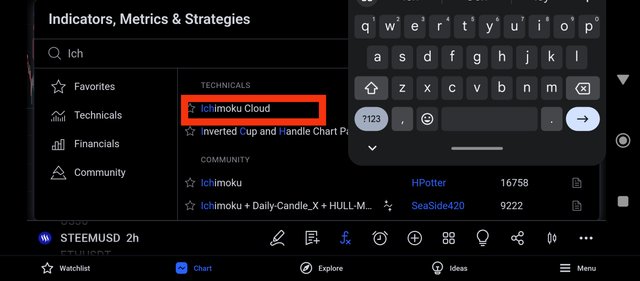
By typing the first few letters of the ichimoku cloud indicator, the indicator appeared and I proceeded to click on it just as seen above.
After clicking on the indicator, the below display appeared which shows that the indicator has been successfully applied.
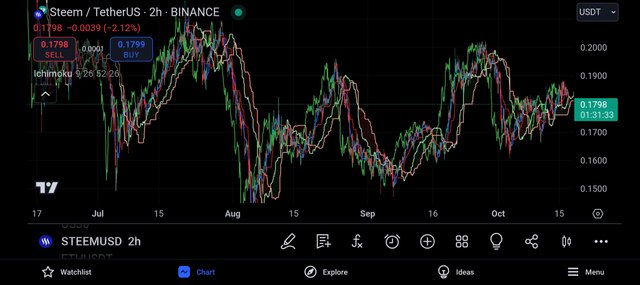
As shown above, we can see that the indicator took over the display of the price chart, and a novice wouldn't be able to differentiate which is which.
And as such, I took it upon myself to differentiate all lines and what they represent in the market price.
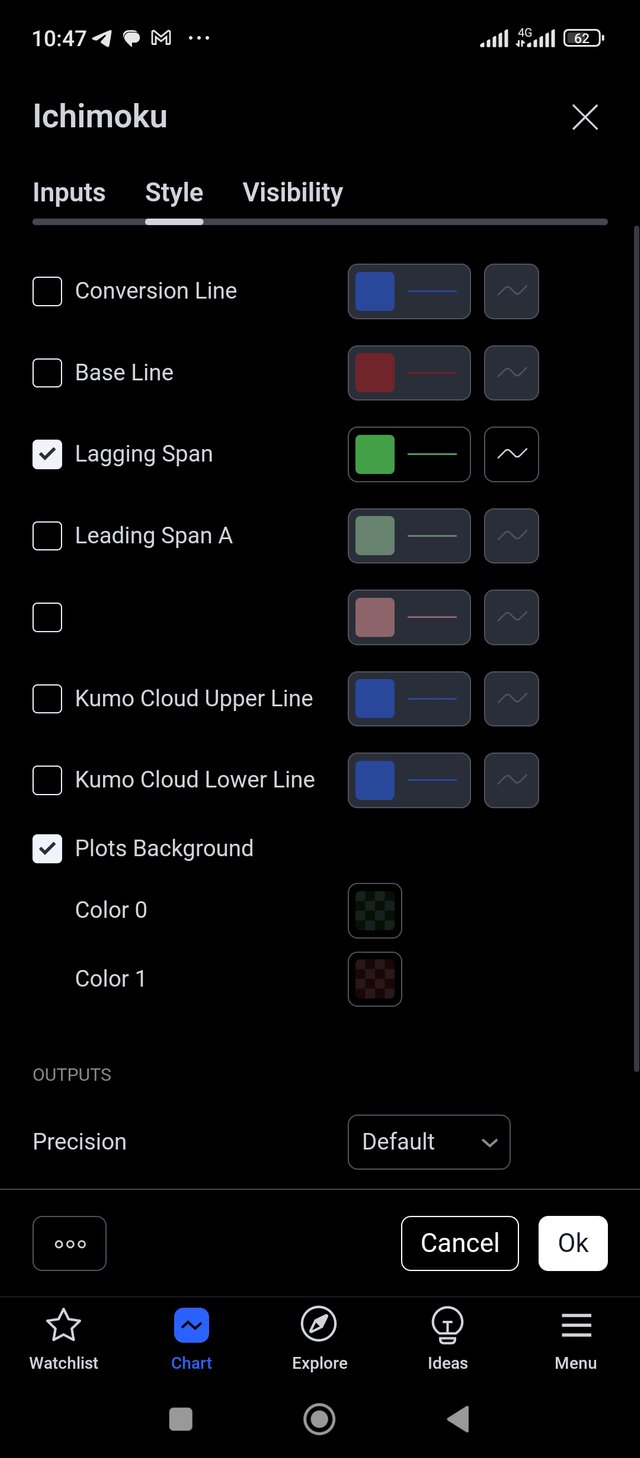
From the above screenshot gotten from trading view on my device, we can see the different colours of line and what they represent.
The blue line on the ichimoku cloud indicator stands for the conversion line which we popularly know to be Tenkan-sen, and we have examined in the proceeding context what it stands for.
The red line in the ichimoku cloud indicator stands for the base line which we popularly know to be the kijun-sen and we have explained what it is used for and how it is used.
The deep green line is functioning as the lagging span, and we understand that to be the chikou span and we have explained what it is used for.
And the light green line stands for the leading span A, and we understand the leading span A to be sekou span A.
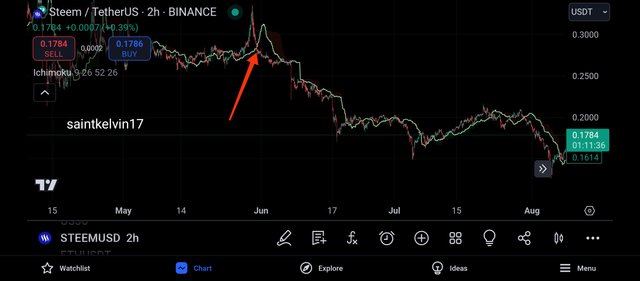
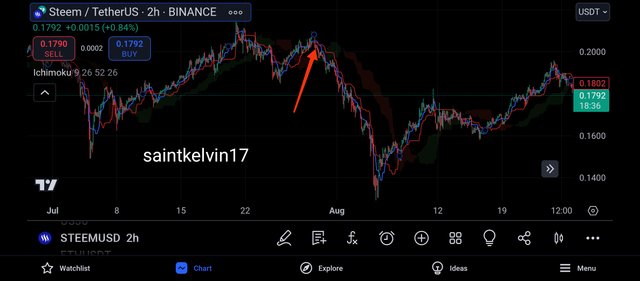
And to identify the trend of the market, I will be making good use of the leading span A of the ichimoku cloud indicator.
Whenever the leading span A crosses above the price chart, the market can be understood to be bearish, that is, in a downtrend, and this means that the market will keep forming lower lows and lower highs.
And from the above screenshot, we can see that the market began it's bearish move immediately it crossed below the leading span A, and this can be used as a criteria when searching for trends in the market.
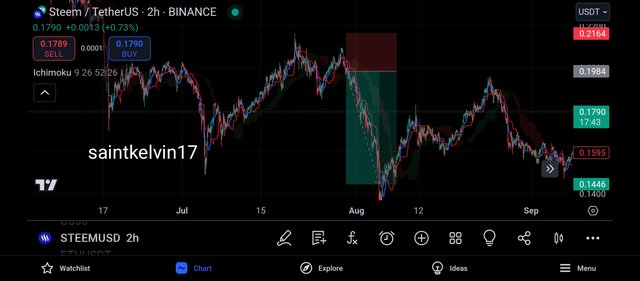
Likewise when the market turns bullish, we can see that the leading span A has crossed below the price chart, thus functioning as a support level to the market.
And when I am i see the leading span A, I can refer the market to be in a bullish phase, thus creating new highs.
To be very precise, when we see the leading span A functioning as a resistance level, the market can be said to be in a downtrend and when we see the leading span A functioning as a support level, the market can be said to be in a bullish phase.
Question 3: Identifying Support and Resistance Levels with Ichimoku
- SUPPORT LEVEL:
A support level is one of the basic concepts of crypto trading, as a support level is understood to be a trading level where the buying pressure exceeds the selling pressure.
It is believed by many that there are lots of buyers waiting on the support level than sellers, which is one reason the market fails to continue lower when it gets to the support level.
And whenever the support level becomes broken, it is believed that the buyers couldn't counter the sellers on that level.
And then, I decided to show how the ichimoku can be used to identify support level.
I visited the price chart and the ichimoku cloud was very noisy and it will be difficult for one to get a proper analysis, especially if you are a novice, and this can be seen from the screenshot below.
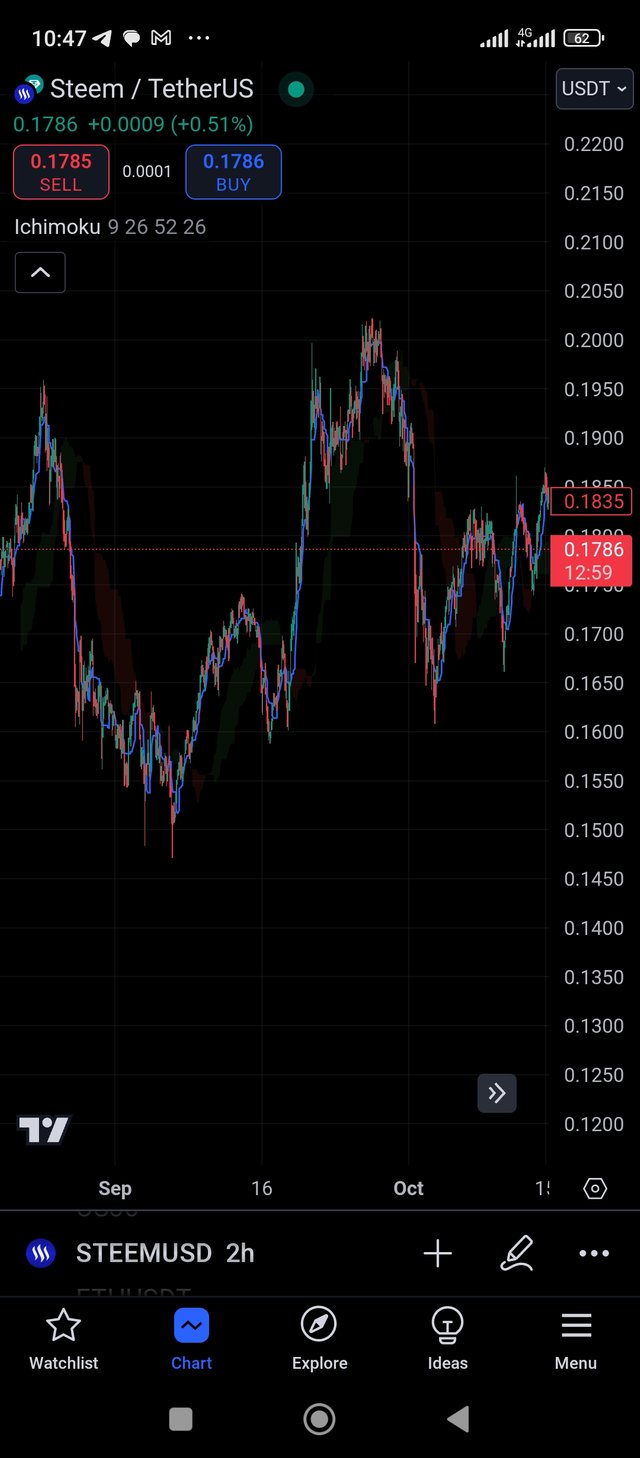
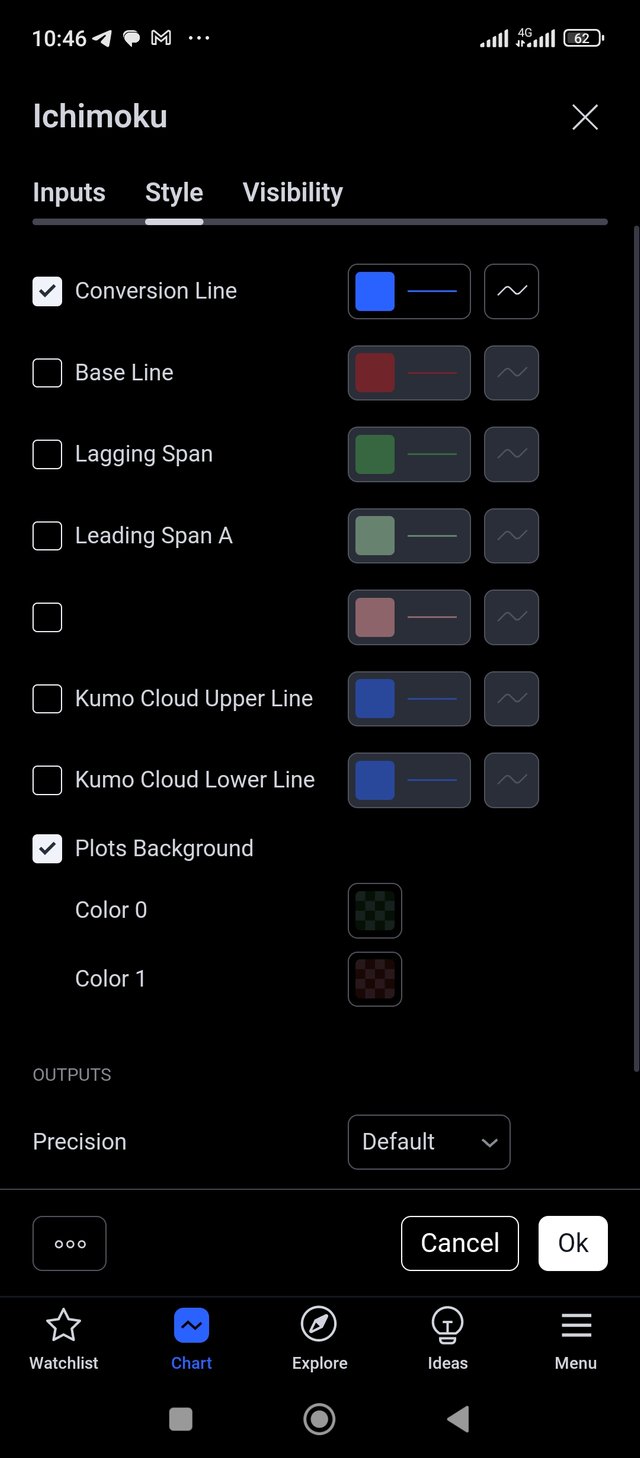
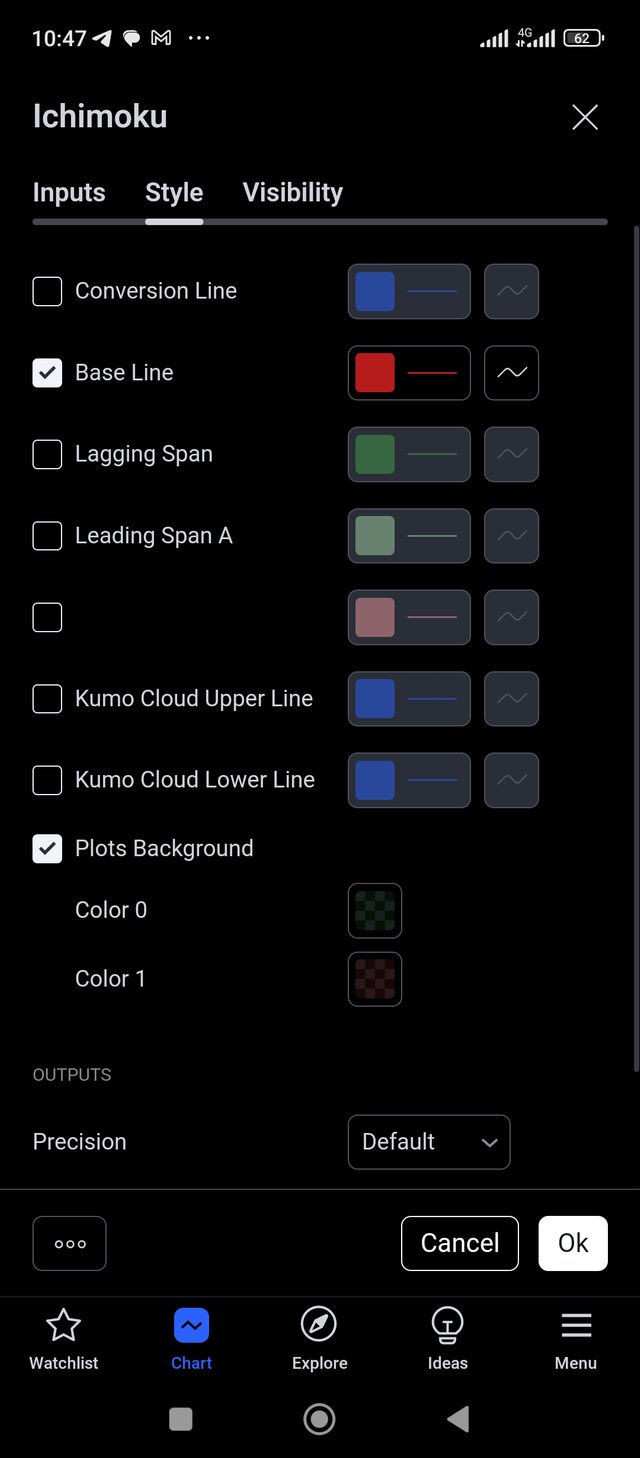
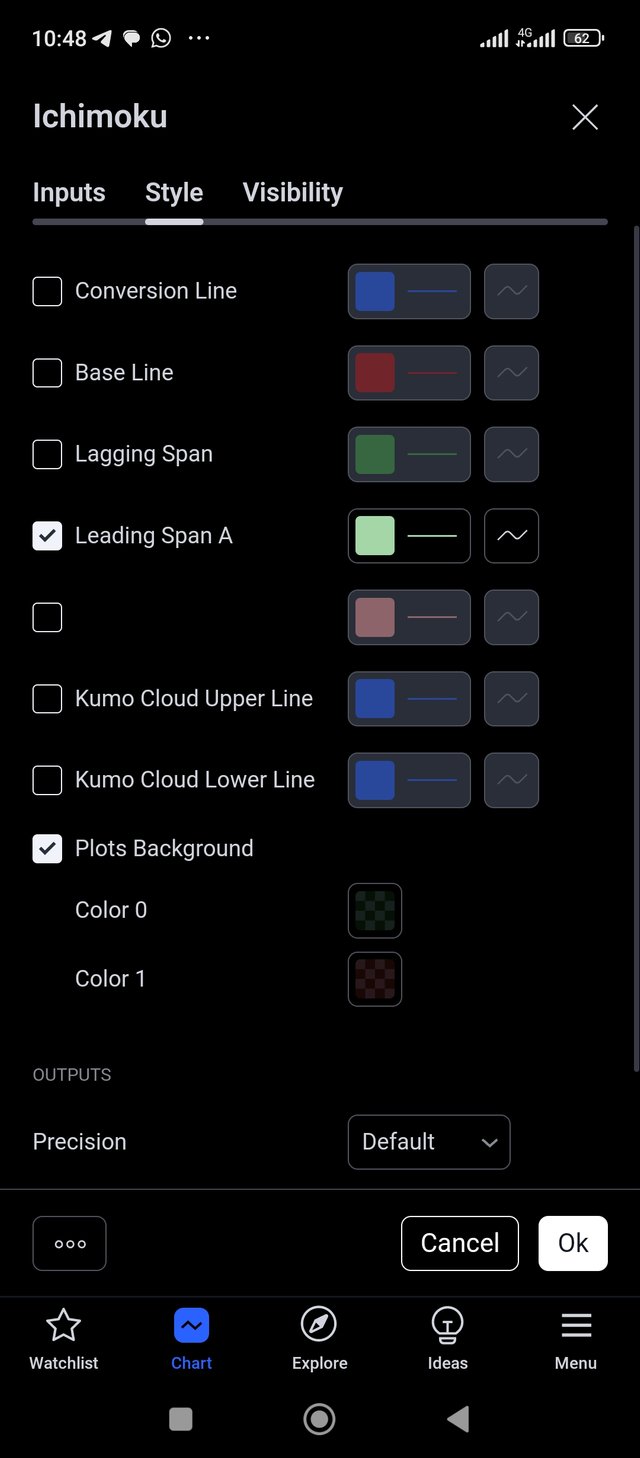
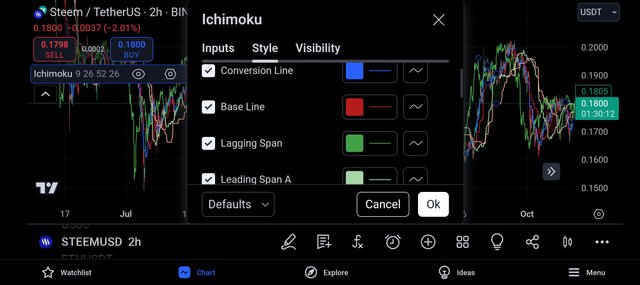
Then I moved to the settings and removed the conversion line and the base line, which leaves me with the leading span A and the lagging span of the ichimoku cloud indicator.
The screenshot below shows me unticking the base line and the conversion line.
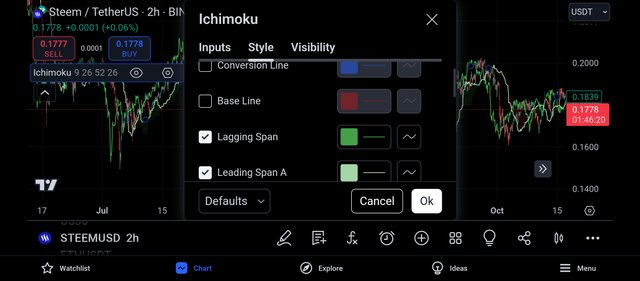
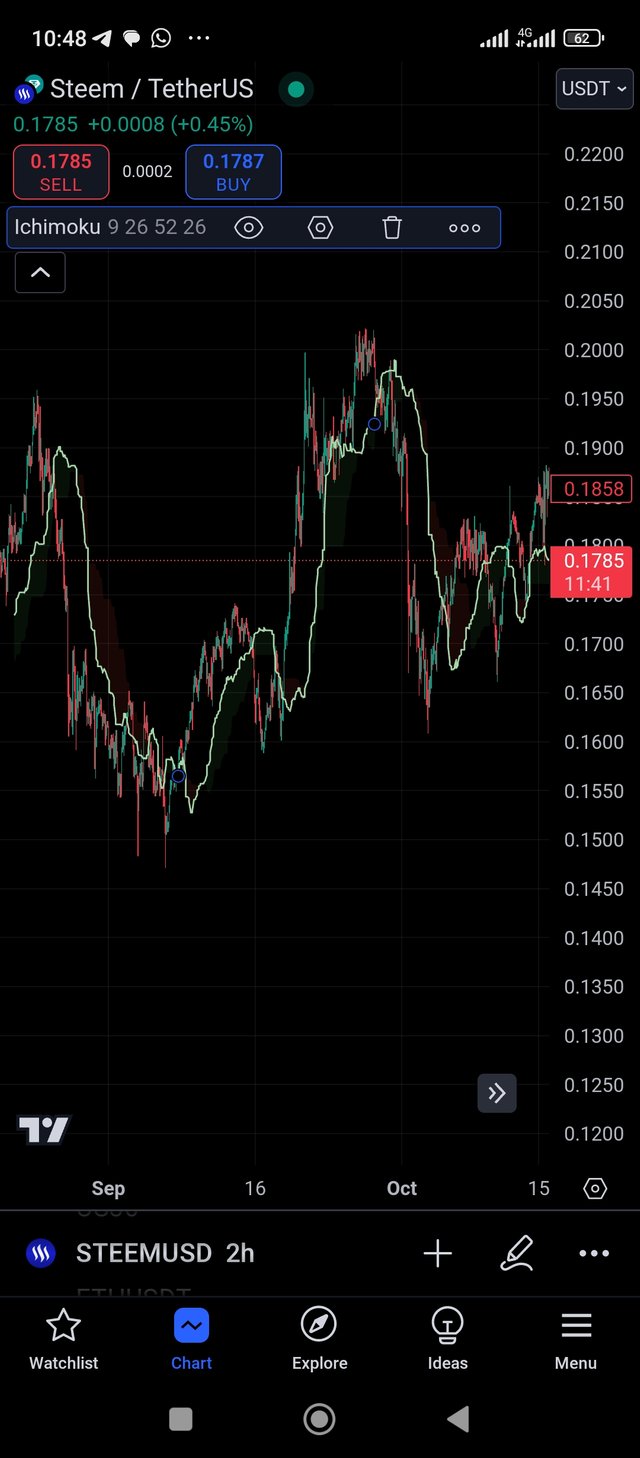
And then only the leading span A and the lagging span of the ichimoku cloud indicator is shown.
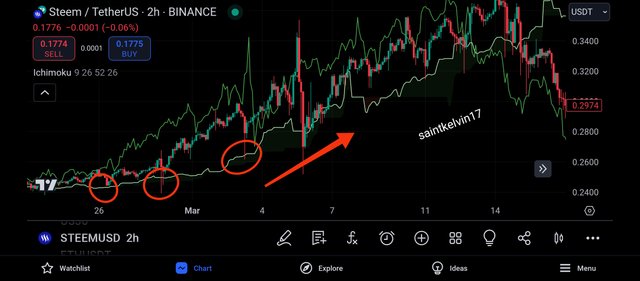
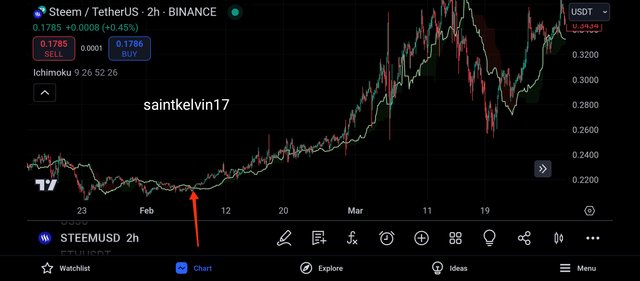
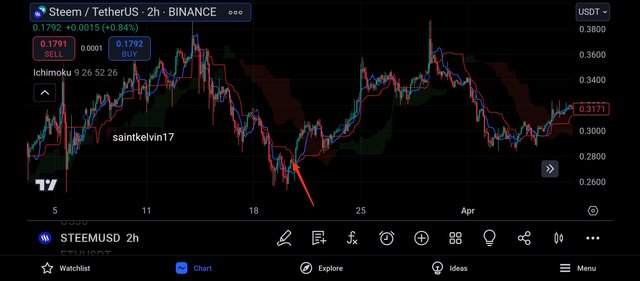
From the above screenshot, we can see that the leading span A is doing a very good job functioning as a support level.
We can see that it held the market severally, and whenever the market touched it, the market gets rejected.
And we can also see the market forming higher highs and higher lows as it keeps getting rejected by the leading span A.
- RESISTANCE LEVEL:
The resistance level is functioning as the exact opposite of the support level and it is believed that there are lots of sellers on this level.
The resistance level is a level that attracts lots of sellers to it, because it is a level with so much buyers and the sellers inturn will want to take their profit from this level.
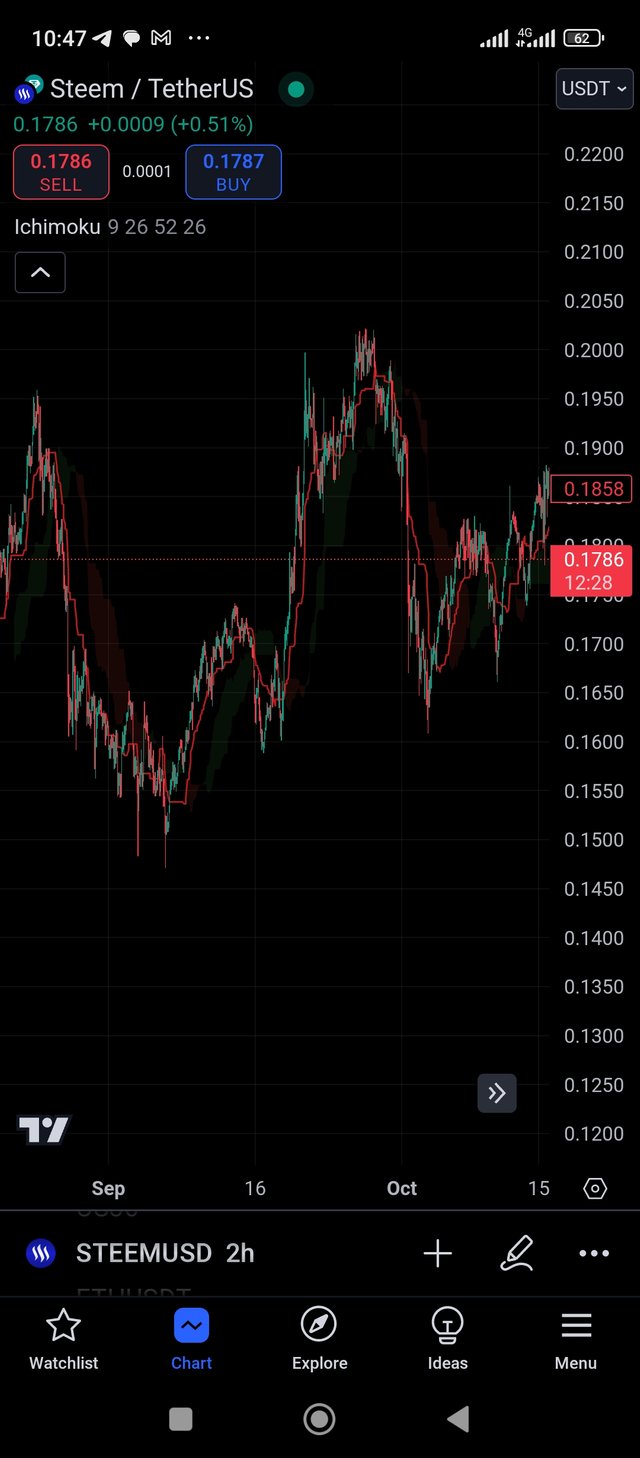
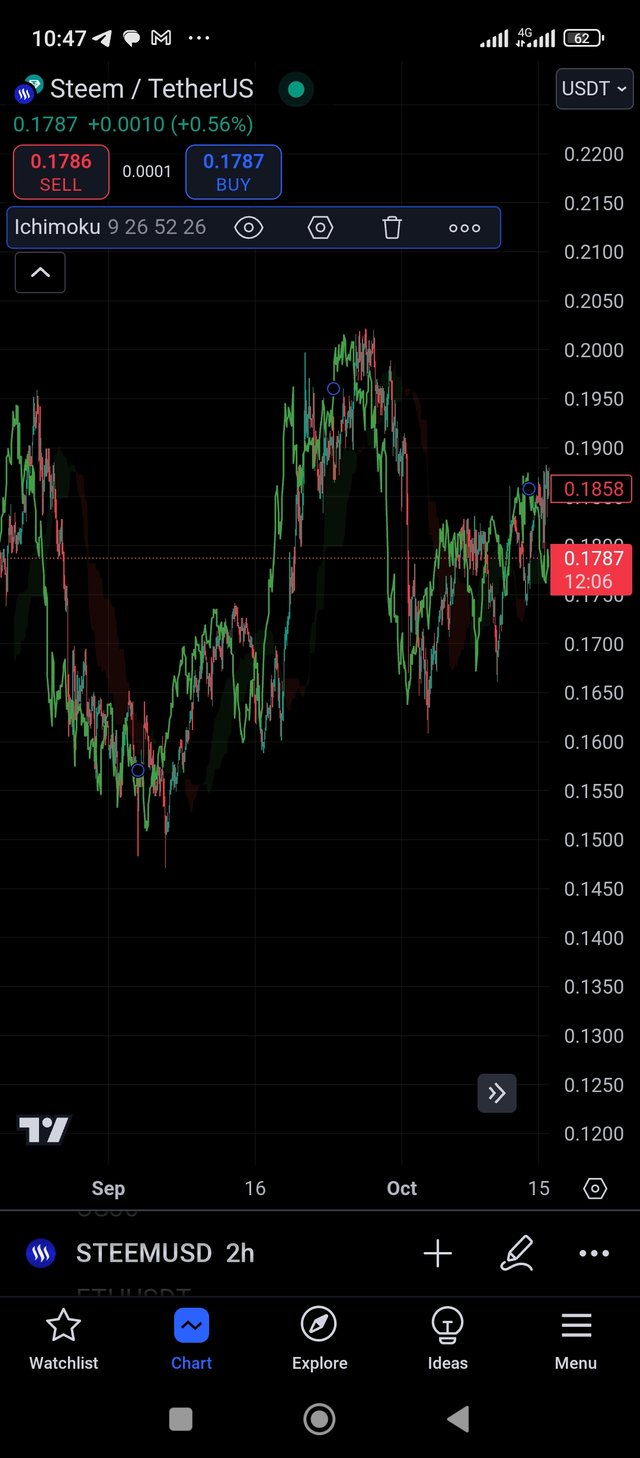
And to search for my resistance level in the market, I decided to make use of the conversion and base line to do so.
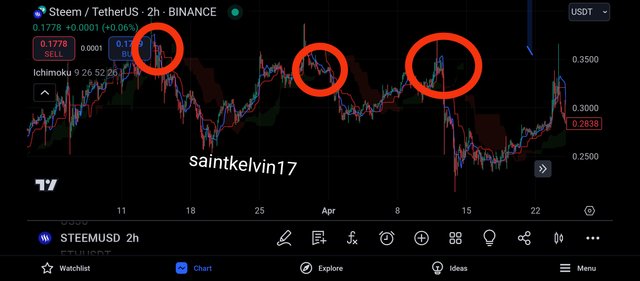
From the above screenshot, we can see that the conversion and base line is doing a very great job as a resistance level to the price chart.
We can see that the price chart has made several touches on this conversion line and has been unable to break above it, rather, it gets rejected whenever it touched this level.
And as such, we can proceed to place our entry when we see rejection from this resistance and support levels using the ichimoku cloud indicator.
Question 4: Trading with the Ichimoku Cloud
This section requires me to develop a trading strategy using the conversion and base line of the ichimoku cloud indicator and I will do accordingly.
The conversion line of the ichimoku cloud indicator which is known as Tenkan-sen can form a very unique signal when it crosses over the base line which we know to be kijun-sen.
In one of our academy assignment, we learnt about the crossover of moving averages to give the death cross and th golden cross, in a similar way, when there is a cross over of Tenkan-sen and kijun-sen, we can get a death cross and a golden cross.
BEARISH ENTRY:
The blue line on the chart shown above is the conversion line which we know to be Tenkan-sen and the red line is the base line which we know to be kijun-sen.
And when the Tenkan-sen crosses below kijun-sen, the market can be said to give a death cross signal in comparison to the use of moving average crossover.
As seen above, when Tenkan-sen crosses below kijun-sen, we can see see how the market kept forming lower lows and lower highs.
To take my entry from the death cross signal of the ichimoku cloud indicator, I will take few things into consideration and they are:
- RISK MANAGEMENT:
Risk management is very important when trading the crypto market with or without the use of trading indicator.
To apply my risk management effectively, I will ensure to risk only 20% of my trading capital, this implies that if my account worth is $1000, I will only be risking $200 in a trade.
And this gives me the opportunity to encounter a streak of 5losses before my account will be blown.
- RISK TO REWARD:
Before placing my trade, I will ensure that I will be getting a risk to reward ratio of 1:3, this means, if I $20 and the trade goes in my favour, I will be going with a profit of $60.
- ENTRY CRITERIA:
I will enter my trade immediately I notice that the Tenkan-sen has crossed below the kijun-sen and this is accompanied by the formation of bearish candles
BULLISH ENTRY
And to detect a golden cross using the ichimoku cloud indicator, we will be making use of the Tenkan-sen and kijun-sen lines.
And when the Tenkan-sen crosses above the kijun-sen, we can expect to see a bullish move in the market, or we can place our buy entry when this is formed.
To take my entry from the golden cross signal of the ichimoku cloud indicator, I will take few things into consideration and they are:
- RISK MANAGEMENT:
Risk management is very important when trading the crypto market with or without the use of trading indicator.
To apply my risk management effectively, I will ensure to risk only 20% of my trading capital, this implies that if my account worth is $1000, I will only be risking $200 in a trade.
And this gives me the opportunity to encounter a streak of 5losses before my account will be blown.
- RISK TO REWARD:
Before placing my trade, I will ensure that I will be getting a risk to reward ratio of 1:3, this means, if I $20 and the trade goes in my favour, I will be going with a profit of $60.
- ENTRY CRITERIA:
I will enter my trade immediately I notice that the Tenkan-sen has crossed above the kijun-sen and this is accompanied by the formation of bullish candles
Question 5: Forecasting Future Price Movements Using the Ichimoku Cloud
First, to give a forecast of the future price movements of steem token, it would be very important that we identify the prevailing trend of the market, as the market trend is always very important when carrying out analysis.
And for me to understand the market trend, I always love to make use of the leading span A and the lagging span.
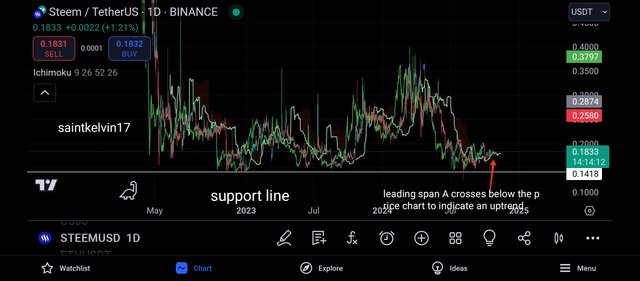
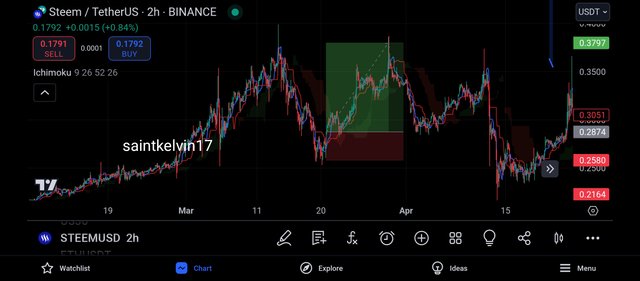
The above screenshot shows the daily chart of STEEMUSDT, and the first thing I did was to add the ichimoku cloud indicator to the price chart.
And then I proceeded to identify the horizontal support line which would act as a confluence to the analysis I get from the ichimoku cloud.
From the ichimoku cloud, I realised that the leading span A has crossed below the price chart and this is an indication that the market is about to be bullish.
And coupled with the rejection the market got from its horizontal support line which confluences to a bullish move.
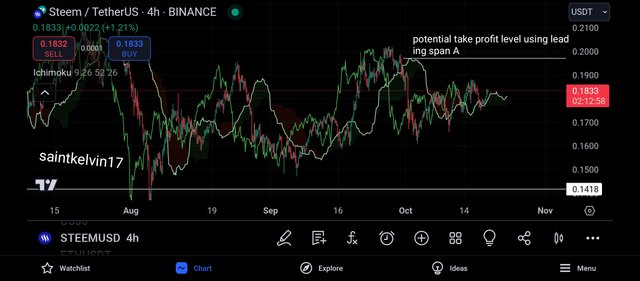
And the next thing I did was to identify my potential take profit region, and I made use of the leading span A to identify this level, and it confluences with the closest high made by the price chart.
And to identify my potential support and resistance level, I decided to make use of the Tenkan-sen and kijun-sen indicator.
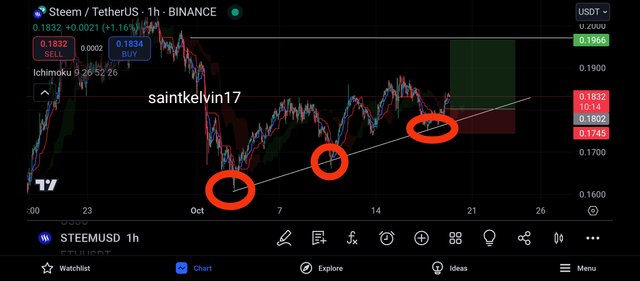
From the above screenshot, we can see that the market made several touches on this indicator to show it acting as a support level to the market.
And then, I placed my entry on the Tenkan-sen indicator, as I expect it to act as a support level again to the price chart.
And I placed my take profit in a way that I got a risk to reward ratio of 1:3.
Discuss the cloud’s forecast capabilities, particularly the Senkou Span A and Senkou Span B, and how they project potential support and resistance areas.
Among the good features of the Ichimoku Cloud based on forecasting is the prediction of price trends with the use of two leading spans, Senkou Span A and Span B. The use of these two spans makes it possible to see the “cloud”, Kumo, a formation which serves as a graphical form of determining areas of support and resistance as well as predicting probable future price direction. The senkou span A which is considered as the foremost leading span is the mathematical average of the conversion and the baseline that is plotted 26 periods to the future. This span is taken to include the current trend direction of the market hence is more volatile than the rest spanning simply because it employs shorter moving averages. It provides support in the bullish market whenever it is rising and whenever it is declining, it offers resistance in the bearish market. This forecast capability is relied on for the estimation of possible levels at which reversal or price stabilization might a few days hence occur, making senkou span A an important tool for entry and exit tactics in the trading scenes.
Senkou Span B on the other hand which is the second span of the cloud diagrams is calculated by taking an average of the highest high set and lowest low set, and like Span A it +is plotted 26 periods ahead. This makes Senkou Span B a relatively slower moving span that is focused on long-term analysis of the market. Due to the method of calculation, Senkou Span B tends to show some constancy and is therefore proffered as a more reliable level of support and resistance. For instance, when the market price is higher than Senkou Span B, it carries implications of reasonable support in the future; when the opposite is true, the price is low and one prices out, it means resistance at that price. Cloud thickness is also expressed as the distance between Senkou Span A and Senkou Span B; that is why a thick cloud also means higher spikes and a thinner one mean adherences to strong directional trends. Thus this difference in the sigmoid function allows traders to estimate how strong is the momentum of the underlying trend, or how well the reversal will take place, thus enhancing the prediction capabilities of the Ichimoku Cloud as a whole.
In particular, Senkou Span A and Senkau Span B get along very well as they provide traders with an ability to view market conditions in advance, in particular, the level of price movement where there are likely to be support or resistance. In doing so, these levels are clearly extended into the future, and this is highly advantageous when one is trading in a fast-paced and turbulent environment as this one in the case of cryptocurrency. The relationship between these two spans is very important especially during the time price breaching the clouds. Crossing of both spans by prices upwards is an eventuality which normally signals the establishment of strong buying forces within the market and crossing below the two spans identifies the market being highly bearish. The congruence between the ability of the spans to indicate strong support and resistance levels and the changing thickness of the cloud itself enhances the advantages of the Ichimoku system in predicting future market trends over other systems.
CONCLUSION
This is a very educative content from the Steemit crypto academy and I am glad to submit my entry as shown above.
Twitter share
https://twitter.com/Saintkelvin18/status/1847678492030210254?s=19
Upvoted. Thank You for sending some of your rewards to @null. It will make Steem stronger.