SEC S18-W5 || Mastering Trading with Stochastics and Parabolic SAR.
|
|---|
Hope you all are doing well and good and enjoying the best days of your life. This is me @shahid2030 from Pakistan and you are here reading my post. You all are welcome here from the core of my heart.
This is my participation in a contest Mastering Trading with Stochastics and Parabolic SAR organized in SteemitCryptoAcademy by @crypto-academy.
Explain the components of the Stochastic Oscillator. How does it help in identifying overbought and oversold conditions in the market? |
|---|
The Stochastic Oscillator is a momentum finding indicator used in technical analysis for the comparision of a particular closing price of a security to a range of its prices over a certain period. We use it to find the overbought and oversold conditions in market. Let's find it's main components and explain how does it work.
Components of the Stochastic Oscillator
%K Line:
Calculation: %K = 100 * ((Current Close - Lowest Low) / (Highest High - Lowest Low))
Current Close: It's the most recent closing price.
Lowest Low: As it's name indicates, it's the lowest price over a given number of periods (often 14).
Highest High: It's the highest price over the same number of periods.
We call the the %K line is the most important line of the stochastic oscillator and it moves between 0 and 100.
%D Line:
Calculation: It calculation is very simple: %D = 3-period moving average of %K.
Our %D line is a moving average of the %K line, which works to smooths out the %K values, and also make it easier to identify trends and turning points.
Identifying Overbought and Oversold Conditions
It's very easy to to identify both overbought and oversold conditions of the market. Let me explain both these one by one.
Overbought Condition
It happens, when the oscillator reading is above 80.
It gives us indication that the security might be trading at a higher price level than its near past, and we can expect a price reversal or pullback may be imminent. This is a signal for us that the security might have been over-purchased, buyers have done their job, which increase the risk of a downward correction. They might sell their assets at this point.
Oversold Condition:
It occurs when the oscillator reading is below 20.
It's a kind of Buying signal for us. This indicates that the security might be trading at a lower price level than its recent past, and we can highly expect an upward reversal or bounce back. In short , it tells us that the security might have been excessively sold off, the traders might close their short position here and we might see a potential upward correction.
It's Practical Use
Crossovers:
%K crossing above %D:It's a buying signal, indicting a potential buying opportunity, we can expect a possible uptrend.
%K crossing below %D: It's the vice versa of the above one. It signals a potential selling opportunity, indicating a possible downtrend.
Divergence
If the price makes a new high or low, which isn't confirmed by the stochastic oscillator, it might signal a potential reversal. For example, if the price of a security makes a new high but the oscillator give us a lower high, this bearish divergence could indicate an upcoming downtrend.
Trend Confirmation:
We use the stochastic oscillator data to confirm the strength of a trend. If the readings stay within the these two levels; overbought or oversold levels for an extended period, it might indicate a strong trend.
Example Scenario
Suppose a we have stock and it's price is fluctuating between $50 and $60 over a 14-day period. If today is last day and it's closing price is $55, the lowest price in the past 14 days, let suppose was $50, and the highest price we take $60, the %K would be calculated as follows:
%K = 100 * ((55 - 50) / (60 - 50)) = 100 * (5 / 10) = 50
What we understand from this example? Here if the %K value continues to rise and crosses above 80, It's a short position place, traders might start to watch for overbought signals and prepare for a potential sell-off. On the other hand, if %K drops below 20, they might look for oversold signals and consider buying.
Describe the Parabolic SAR indicator and its application in identifying the trend direction. How is it interpreted differently in an uptrend compared to a downtrend? |
|---|
The Parabolic SAR (Stop and Reverse) is a famous and commonly using technical analysis indicator developed by J. Welles Wilder Jr. We use it to find the direction of an asset's momentum and potential points where the trend might reverse.The indicator is plotted on a price chart in the form of a series of dots that appear either above or below the price.
Calculation and Plotting
We calculate the Parabolic SAR by using the following formula:
a) Uptrend (SAR below the price)
SARnew = SAR current + α × (EP−SAR
current)
SAR: The Current SAR value
EP (Extreme Point): Highest high of the current or continue trend.
α (Acceleration Factor): It starts at 0.02 and increases by 0.02 with each new high coming in the uptrend, up to a maximum of 0.20.
b) Downtrend (SAR above the price)
SAR new = SAR current −α × (SAR current − EP)
EP: Here EP is lowest low in the current trend
α: Same as in uptrend it starts here at 0.02 and increases by 0.02, but the difference is, it is added with each new low in the downtrend, up to a maximum of 0.20.
Interpretation
Uptrend: Identifying trends through Parabolic SAR is quite easy. When the price is above the Parabolic SAR, the dots are plotted below the price, hence it indicates a bullish trend.
Signal: As long as the dots remain below the price, it's a clear cut indication of the uptrend and is considered to be in place. When the price drops below the dots, we can seea potential reversal here, mean a signal to a downtrend.
Downtrend: In downtrend the scenerio is quite opposite to that of uptrend. Here when then the price is below the Parabolic SAR, and the dots are plotted above the price. This indicates a bearish trend.
Signal: As long as the dots remain above the price, it's a sign of downtrend. A trend reversal will happen, if the price rises above the dots.
Application
Trend Identification: The first and far most function of Parabolic SAR is to identify trend. Dots below the price suggests an uptrend, while dots above the price suggests a downtrend.
Entry and Exit Points: The Parabolic SAR also give us best entry points, as we can easily identify up or down trend. In uptrend we go for long and in down we go for short.
Stop Loss Placement: We have clear cut levels in parabolic which help us identifying the best stoploss places.In an uptrend, the SAR value can act as a trailing stop below the current price. In a downtrend, it can serve as a trailing stop above the current price.
Differences in Interpretation
| In an Uptrend | In a downtrend |
|---|---|
| The Parabolic SAR dots are below the price. | Here the Parabolic SAR dots are above the price. |
| It suggests bullish market sentiments. | It indicates bearish market sentiments. |
| A potential reversal to a downtrend is suggested at a break below the SAR. | A break above the SAR suggests a potential reversal to an uptrend. |
How can the combination of the Stochastic Oscillator and Parabolic SAR be used to create a robust trading strategy? Provide a detailed explanation. |
|---|
In market analysis, no matter what market it is, the best strategy is using many technical indicators in a combination. In crypto it is must to see many indicators in parallel with each other. So now combining the Stochastic Oscillator and the Parabolic SAR (Stop and Reverse) can create a robust trading strategy by leveraging their complementary strengths. Let me explan, how to use these two indicators together.
Understanding the Indicators
Stochastic Oscillator
It measures the location of the current price relative to the high-low range over a specified period.
It ranges from 0 to 100.
It consists of two lines; %K (fast line) and %D (slow line, typically a moving average of %K).
We have two key levels here: 20 (oversold) and 80 (overbought).
Parabolic SAR:
Using parabolic helps tracking price trends and indicates potential reversal points.
Our main concern is with Plots dots above or below the price. Above is for a downtrend and below for an uptrend.
When the dots move closer to the price as the trend extends, it signals a trend reversal.
Creating the Trading Strategy
Entry Signals
Long (Buy) Entry:
Stochastic Confirmation: We have indication of an oversold condition and potential upward momentum, if %K line cross above the %D line from below 20.
Parabolic SAR Confirmation: Our entry will be for long, if the Parabolic SAR dot has moved below the price. It the confirmation of the start of an upward trend.
Short (Sell) Entry:
Stochastic Confirmation: Look at the %K line, if crossing below the %D line from above 80 (indicating an overbought condition and potential downward momentum).
Parabolic SAR Confirmation: If the Parabolic SAR dot has moved above the price, it indicates the start of a downward trend.
Exit Signals:
Long (Buy) Exit:
Stochastic Overbought: If the Stochastic Oscillator moves above 80 level, consider it profit taking zone. Get exist from here.
Parabolic SAR Reversal: When the Parabolic SAR dots move above the price, it's a clear cut indicating of a potential trend reversal.
Short (Sell) Exit:
Stochastic Oversold: If the Stochastic Oscillator moves below 20, get it as profit taking zone.
Parabolic SAR Reversal: If the Parabolic SAR dots move below the price, this is a potential trend reversal with us.
Using historical data, analyze a trading scenario for the STEEM/USDT pair where the Stochastic Oscillator indicated an oversold condition. How would you use this information along with the Parabolic SAR to make a trading decision? |
|---|
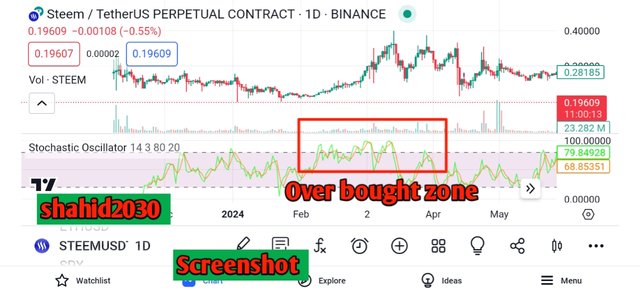
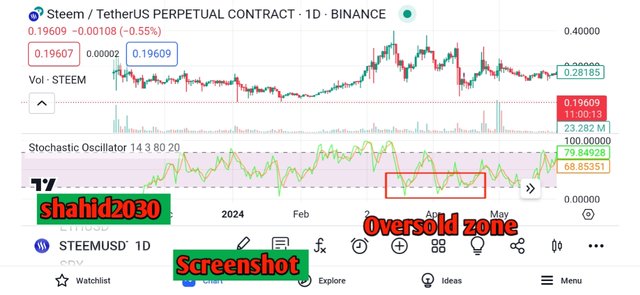
This is one day chart of STEEM/USDT pair, here we can see so many spots, where Steem is at oversold region. All the time after oversold condition, we see a huge upward movement in STEEM's price. Currently Steem is ranging near oversold region and it's a good opportunity for buying or going for long position.
Parabolic SAR and Stochastic Oscillator in combination mostly give us good signal in combination. They often respect each other's analysis. Multiple times we can see if Stochastic Oscillator shows us oversold reason, there the dots are made above the price and price is going down, or dumping. Same is the case with overbought condition, it is following Stochastic Oscillator.
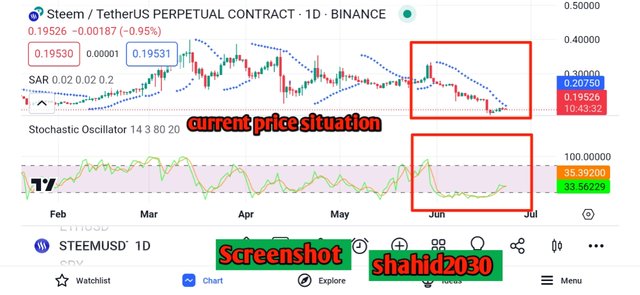
Currently we are at oversold condition in Stochastic Oscillator, and Parabolic SAR also shows us a down trend or selling pressure, so we can say it's a good opportunity for going long. It's the perfect depth we can catch and get enter at this point for long and then take exit at overbought position.
Perform a technical analysis on the current STEEM/USDT pair using both the Stochastic Oscillator and Parabolic SAR. Based on your analysis, what would be your trading recommendation? |
|---|
I want to perform technical analysis using these two important technical indicators on various charts ( One day chart, four hours and fifteen minutes time frame chart). It will help us know about STEEM's analysis for short term, mid term and long. First I will start with short term, which is fifteen minutes time frame.
15 Minutes Time frame
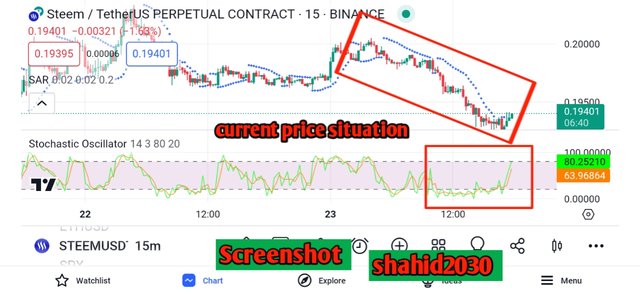
If we look upon history of steem on 15 minutes time frame, we see so many overbought and oversold zones. Currently it's near overbought zone at 80% level. On Parabolic SAR we see the price is ranging above the dots, which shows moment shifts in hand of buyers.
So according to my analysis, for short term it's the best time to go for short position, because both the indicators are giving us short signals. Overbought and price above parabolic dots tells us price may go in downtrend from this position.
4 Hours Time frame
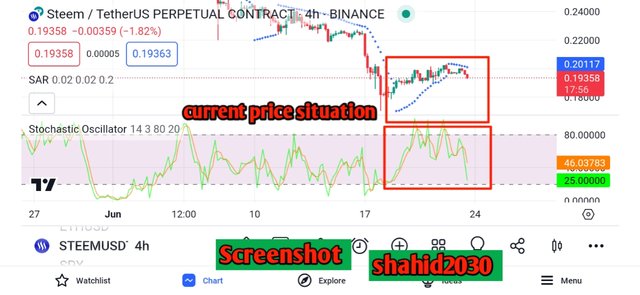
On Hours Time frame we see STEEM is in downward position. It has recently got rejection from the 80% stochastic level, which is an indication of future dump. Parabolic SAR has made few dots above steem price, we can expect more, so the price is giving negative inductions here too.
On mid term we can say that Steem is in down trend, we should avoid long or go for short. Both the indicators are in favour of short.
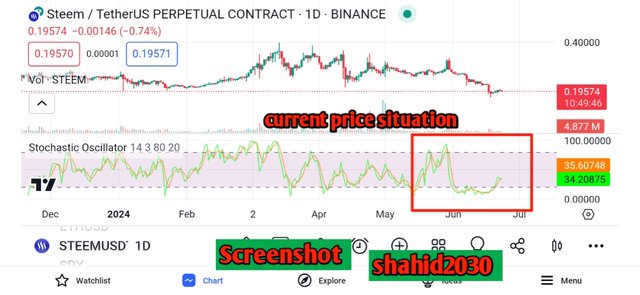
1 Day Time frame
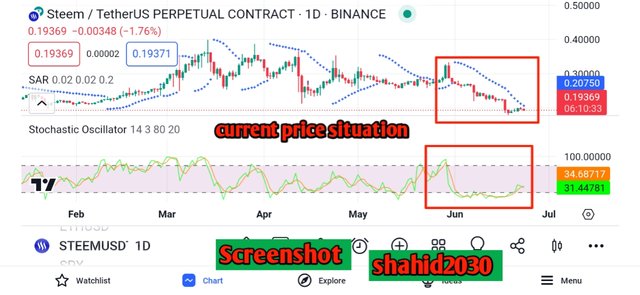
On one day time frame we see STEEM is near oversold region, plus parabolic dots are above steem price too, so we can say that on long term Steem is giving positive signals.
We can go for long position or close our short position here. STEEM is in oversold zone, which is best for buying or taking long position.
This is all about my blog for today, hope you guys have enjoyed reading it. See you soon with a new amazing and interesting topic, till take care.

| I would like to invite: @goodybest, @ripon0630, @beemengine, @tommyl33, @nushrat, @emsonic, @mile16, @pelon53, @solaymann @waterjoe to participate in this Contest |
|---|
Your presence here means alot
Thanks for being here
Regard shahid2030

Thank you, friend!


I'm @steem.history, who is steem witness.
Thank you for witnessvoting for me.
please click it!
(Go to https://steemit.com/~witnesses and type fbslo at the bottom of the page)
The weight is reduced because of the lack of Voting Power. If you vote for me as a witness, you can get my little vote.
Upvoted. Thank You for sending some of your rewards to @null. It will make Steem stronger.
To determine an oversold or overold market trend, the Stochastic indicator must pass the 20/80 level and the Parabolic SAR point must be above the downtrend and the point must be below the candles.
These two indicators also really help us in trading, especially as they have formulas and we can use them well.
Making decisions based on trading knowledge will minimize losses...
Good luck in this contest...
👍
Thank you so much dear for your most beautiful comment here, keep blessing dear.
You are welcome 👍
good analyse At this stage, we can definitely exit steem for the long term.
Your post has been successfully curated by our team via @steemdoctor1 at 35%.
Thank you for your committed efforts, we urge you to do more and keep posting high-quality content for a chance to earn valuable upvotes from our team of curators and why not be selected for an additional upvote later this week in our top selection.