[ Crypto Trading with Moving Average ]-Steemit Crypto Academy | S6W2 | Homework Post for @shemul21
.png)
Cover Image - https://www.canva.com/

1- Explain Your Understanding of Moving Average.
2- What Are The Different Types of Moving Average? Differentiate Between Them.
3- Identify Entry and Exit Points Using Moving Average. (Demonstrate with Screenshots)
4- What do you understand by Crossover? Explain in Your Own Words.
5- Explain The Limitations of Moving Average.
6- Conclusion.

This is the Source of above image.
Moving Averages are a type of technical indicator which are used to predict the price movement of an asset. Moving average reduces the noise and gives a smooth and accurate price analysis. The noise reduction helps the traders to identify the price where it goes potentially. The moving averages cannot predict the future performance, thus they demonstrate the present situation of the price. When applying the moving averages to the price charts we can change the time frame into a low time frame or high time frame. That helps to get a clear idea about the price action. There are formulas to calculate the Moving averages according to their type. Moving averages are used by most professionals to predict the price action and the current situation. They also use moving averages in combination with other simple indicators. The professional traders combine indicators with moving averages in order to find accurate trade entry and exit points. The moving averages are calculated in a similar manner. For example, a 20MA is taken by dividing the 20 periods by 20.
There are various types of moving averages. I will explain the types of different moving averages with some common differences.
👉 The simple Moving average
The simple moving average is a smoothly calculated sum using the closing prices given within a period. If a trader needs to get the SMA of 14 period, the closing price of 14 candles are summed up and divided by 14. So it gives the 14 period SMA value. SMA is strong as a long-term indicator.
👉 Weighted Moving Average
The weighted moving average is a line that gives more weight to last periods. The WMA line is faster than the SMA line. Each period in WMA carries a weight. If there are 4 periods then the calculation will be as follows. The WMA is strong as an intermediate-term indicator.
- [(1 x $40) + (2 x $45) + (3 x $30) + (4 x $25)]
- The sum of the periods is 1+2+3+4 = 10
- Then we have (40 + 90 + 90+100) / 10 = 32 as a 4 WMA
👉 Exponential Moving Average
The exponential moving average gives more weight to the most recent prices. This is good as a short term indicator. In the EMA calculation, a multiplier is applied to get the smoothest result.
There is a calculation to calculate the multiplier.
- [2 ÷ (number of periods + 1)]
For example if we consider a 4 day example,
- Multiplier = [2 ÷ (4 + 1)] = 2.5
Then, we can calculate the EMA: Closing price x 2.5 + EMA (previous day) x (1 – 2.5).
For example:
Imagine the first previous EMA is 60
- 1 EMA = 60(1) = 60
- 2 EMA = 2.5 * 45 + (1 – 2.5) * 60 = 22.5
- 3 EMA = 2.5 * 50 + (1 – 2.5) * 22.5 =91.25
- 4 EMA = 2.5 * 55 + (1 – 2.5) * 91.25= 0.62 is our 3 EMA
| Simple Moving Average | Weighted moving Average | Exponential Moving Average |
|---|---|---|
| Calculated on the closing price | Salculates the last periods | Salculates the recent periods |
| Speed is low | Speed in medium | Speed is high |
| Good as a long term indicator | Good as an intermediate-term indicator | Good as a short term indicator |
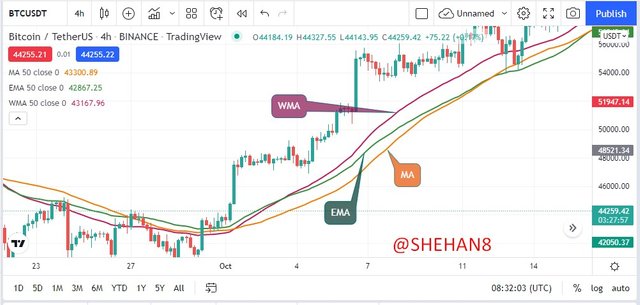
I will demonstrate the above key differences using all three indicators included in a price chart.
Screenshot - https://www.tradingview.com/chart/
👉 Buy Order
Screenshot - https://www.tradingview.com/chart/
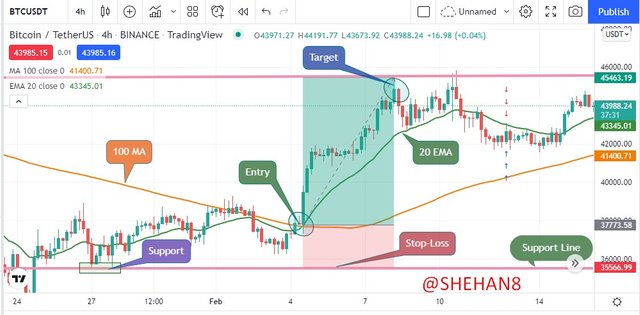
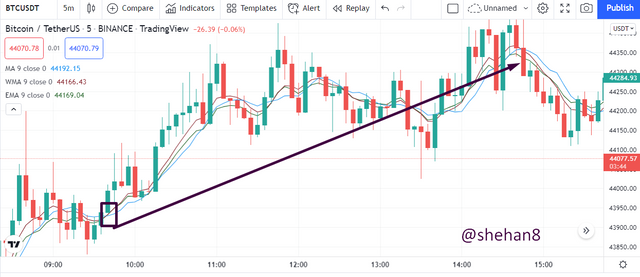
Here I have used the BTC/USDT cryptocurrency pair to perform a buy order. I have used a 20 EMA line and a 100MA line. I have taken the entry point at the crossover point where the 20 EMA line and 100MA line crosses. The stop-loss is identified at the support level to manage the risk. I have placed the take profit at the resistance line that I have identified.
👉 Sell Order
Screenshot - https://www.tradingview.com/chart/
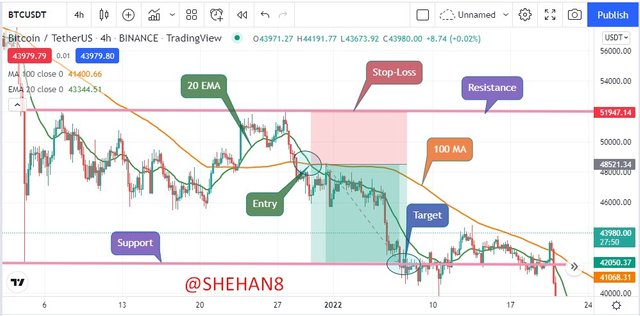
I have used the BTC/USDT cryptocurrency pair in a 4-hour chart to perform a demo of a sell short order. I have used the 20EMA line with a 100MA line. I identified the cross-over of the two lines. That crossover point is marked as my entry point. The target is set at the support line. The stop-loss is marked at the resistance level.
Screenshot - https://www.tradingview.com/chart/
As you can see in the screenshot above, the moving average cross-over means the meet-up of MA lines at a point on the price chart. The crossover signals a huge change in the prevailing trend.
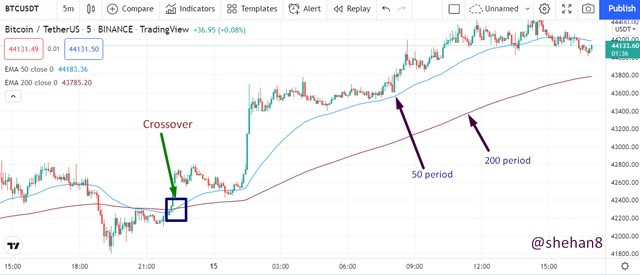
To identify the crossover we can use a faster and a slower moving average together. For example, we can use a 50-period exponential moving average and a 200-period moving average together in a chart and examine the crossover. Let’s see that now.
Screenshot - https://www.tradingview.com/chart/
In the image above, I have taken the 50 period EMA which is as a blue line, and the 200 periods EMA as a brown line. Both the lines meet up and cross at the highlighted point. This higher EMA and lower EMA intersect and signal a trend breakout. As you can see exactly the bearish trend which was continuing till the crossover has changed to a bullish trend and started the bullish movement.
There are benefits and limitations in every indicator used in crypto trading. So there are limitations and drawbacks in moving averages too.
The data outside the period is neglected by the moving average.
Moving average should be accurately used, otherwise, the moving average can mislead traders in trading.
The moving average method uses a large number of data records from the past which is not much necessary as the moving averages only present the current data.
There are many different assets with different frequencies in the market, so 100% accuracy cannot be expected from the MAs.
When the new data is added, the revisions occur in both the average value and the predicted value.
There are no any specified guidelines to apply a moving average, so most beginners fail when using MA s in trading. They should use their own ways and learn through experience.
As professor @shemul21 explained in the lesson moving averages are important to learn as traders. Beginner traders should practice its usage and calculation well before entering into a trade. MAs are used in combination with other technical indicators to get the maximum benefit. Thank you professor for this clear explanation about MA s which is useful for us in future trading.
This is all about my homework post and I thank you to professor @shemul21 such a valuable topic that was really very educational.
I think you forgot to change your cover page.
Thank you very much. I change it 👌