TRADING STRATEGY WITH RSI + ICHIMOKU - Steemit Crypto Academy |S6W2| - Homework Post for Professor @abdu.navi03
.png)
Cover Image - https://www.canva.com/

1-Put your understanding into words about the RSI+ichimoku strategy
2-Explain the flaws of RSI and Ichimoku cloud when worked individually
3-Explain trend identification by using this strategy (screenshots are required)
4-Explain the usage of MA with this strategy and what lengths can be good regarding this strategy (screenshots required)
5-Explain support and resistance with this strategy (screenshots required)
6-In your opinion, can this strategy be a good strategy for intraday traders?
7-Open two demo trades, one of buying and another one of selling, by using this strategy

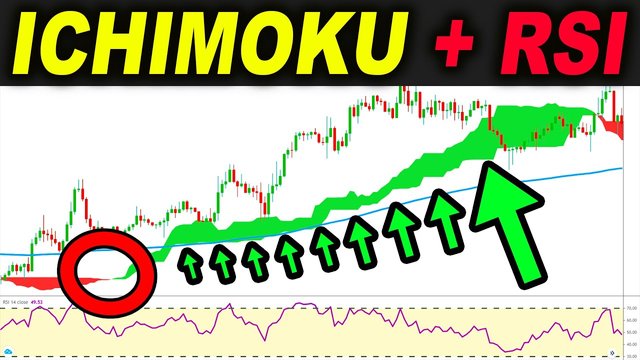
This is the Source of above image.
At present, both RSI and Ichimoku Cloud indicators are very popular indicators among all Crypto Traders. Because those are highly profitable Trading indicators as stand-alone indicators. It means, we have a certain level of possibility to use those indicators without getting support from other indicators to predict the future behavior of the market. However, if we combine both these indicators as a strategy, it will be very highly profitable. Therefore, first of all, I will briefly explain those indicators individually.
👉 Brief Introduction of Relative Strength Index (RSI)
RSI is simply an indicator that you can get a good idea of market behavior. If we are able to be familiar with this RSI indicator, we have a higher possibility to increase our winning rate.
The RSI indicator can be also considered as an oscillator that measures the range of recent changes in the value of a considered price or asset. The most important thing is that with the support of this indicator, we can determine whether an asset is overbought or oversold considering 70 above level and 30 below level.
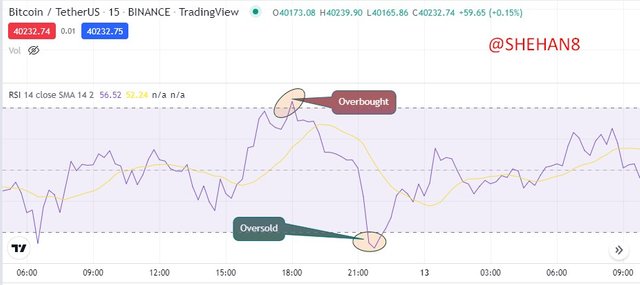
Screenshot - https://www.tradingview.com/chart/
Actually, if the RSI measurement shows its indication above the 70 levels, it denotes that the Present Market is overvalued or the present price is more than its standard level. So in such cases, if we invest in an asset, we may be paying more for it at this time. At the same time, if the RSI measurement shows its indication below the 30 levels it denotes that the Present Market is undervalued or the present price is less than its standard level. So in such a case, if we are investing in an asset, at this point we may be paying the right value or the most profitable value.
👉 Brief Introduction of Ichimoku Cloud Indicator
Ichimoku Cloud is a very useful indicator that we can use to identify specific entry points or exits to the market. Simply put, this indicator can be charted in the shape of a cloud. With the support of these clouds, we have the possibility to identify supports, resistances levels, and as well as present Trends of the Market.
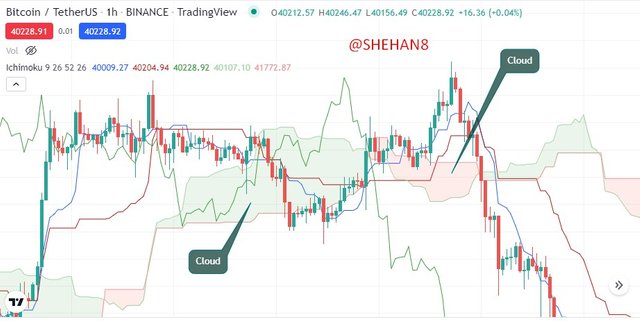
Screenshot - https://www.tradingview.com/chart/
Often ordinary indicators only show us the decisions that can be made at that time. But with this Ichimoku Cloud Indicator, we have the ability to predict market behavior in addition to the decisions we can make then.
So considering all the above, we can assume that if we can create a single trading setup using both above-mentioned indicators, we can get a very high winning rate as compared to individual indicators.
So, The RSI + Ichimoku strategy can be a good combination. Because the RSI tells exact Market oversold and overbought levels. In addition to that, the Ichimoku cloud indicator indicates the exact supports and resistances levels of the Market. And also, the Ichimoku cloud indicator helps to identify the exact trend of the market by filtering out unnecessary price movements.
👉 Flaws of the RSI Indicator
As I said earlier, the RSI indicator is a good indicator for identifying price divergences. For example, if the RSI line moves higher as the price level of the chart moves lower, it means that a good price rejection can come as an increase. Such instances are called hidden bullish divergences and are used to make entry points for buy long positions.
However, we can confirm by chart analysis that this does not always happen. In such cases, the price level moves unexpectedly and the data from the RSI indicator shows that it is incorrect. I will demonstrate a Fake hidden bullish divergence through a price chart.
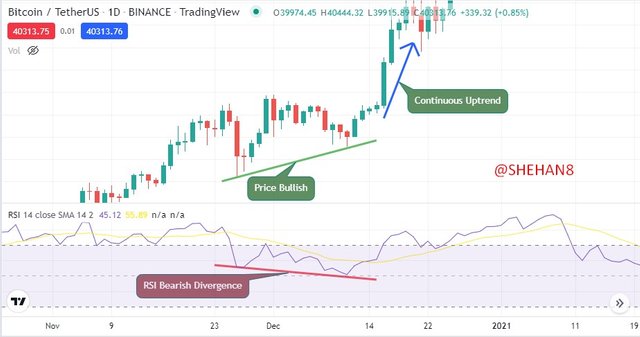
Screenshot - https://www.tradingview.com/chart/
Above I have clearly mentioned a clear fake Bearish Divergence. In this case, we can see the price level is increasing rapidly while the RSI indicator indicates a clear Bearish divergence. So in such cases, many people think that the price level can also go down. So they are tempted to take a sell position. But when the price level continues to rise unexpectedly, the stop loss hits those who enter the sell position.
👉 Flaws of the Ichimoku Cloud Indicator
As I said earlier, the Ichimoku Cloud Indicator is a good indicator for identifying supports, resistance levels, and as well as present Trends of the Market. As an example, when the Ichimoku Cloud Indicator appears as Green clouds, then it tightly works as support zones. At the same time, when the Ichimoku Cloud Indicator appears as Red clouds, then it tightly works as resistance zones.
However, same like RSI Flaws, we can confirm by chart analysis that this Green and Cloud prediction does not always happen. In such cases, the price level moves unexpectedly and the data from the Ichimoku Cloud indicator shows that it is incorrect. I will demonstrate such incidences through a price chart.
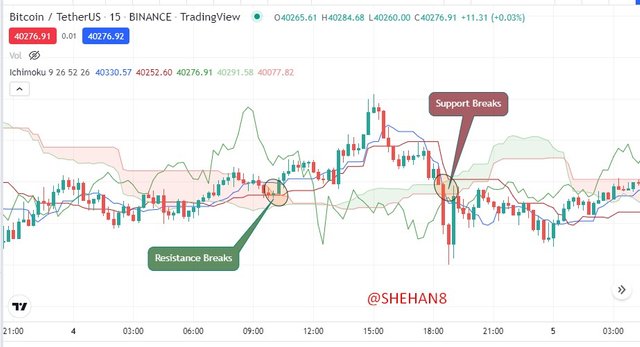
Screenshot - https://www.tradingview.com/chart/
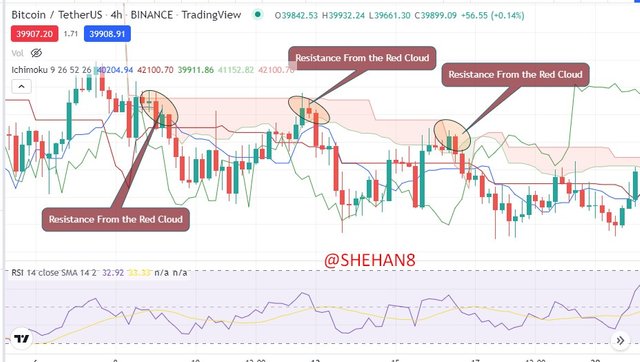
Above I have clearly mentioned clear incidences that failed to work as correct support and resistance levels. In this case, we can see the Ichimoku Cloud indicator will not provide the same benefits in Range markets. So you can see that a lot of crypto traders are making huge losses in such cases. This is because this indicator cannot predict the beginning of a new trend in time, since it is a lagging indicator.
👉 Uptrend Identification
Below you can see a good example for my trend identification using the above explained RSI + Ichimoku cloud strategy. In this case, I have considered an Uptrend using BTC/USDT daily chart.
Here the value of the RSI has reached above 80 levels and it denotes that the price of the asset is in the overbought zone. However, we already know it is also a good zone which has a strong buying pressure.
However, after confirming the signal which indicates from the Ichimoku cloud indicator, it provides a better opportunity for taking buy long positions. It means the price level can be continued even the RSI shows it as an overbought region.
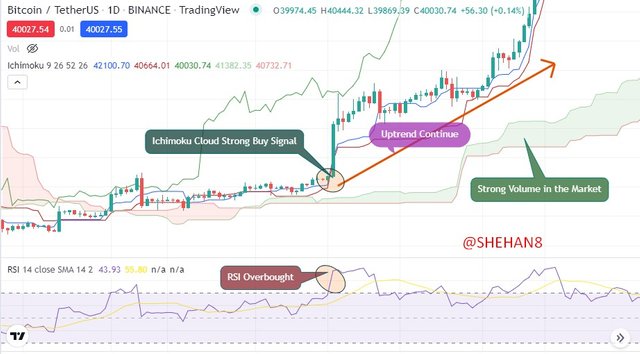
Screenshot - https://www.tradingview.com/chart/
Finally, same as we thought, the price has been continued as an Uptrend which means that this strategy is highly profitable to find the exact trends of the market. And also, the size of the Green cloud denotes the extreme volume of the Market which is a good signal for a clear Uptrend in the Market. Next, I will move to a downtrend identification.
👉 Downtrend Identification
Below you can see another good example for my trend identification using the above explained RSI + Ichimoku cloud strategy. In this case, I have considered a Downtrend using BTC/USDT daily chart.
Here the value of the RSI has reached near the 30 levels and it denotes that the price of the asset is in the oversold zone. However, we already know it is also a good selling which has a strong selling pressure.
However, after confirming the signal which indicates from the Ichimoku cloud indicator, it provides a better opportunity for taking sell short positions due to its cloud positions. It means the price level can be continued to a downtrend even the RSI shows it as an oversold region.
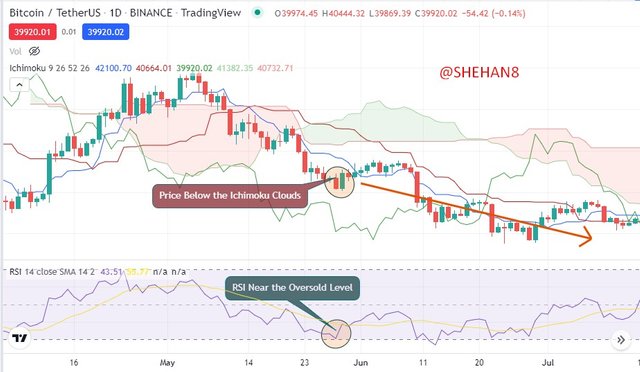
Screenshot - https://www.tradingview.com/chart/
Finally, same as we thought, the price has been continued as a Downtrend which means that this strategy is again highly profitable to find the exact trends of the market. And also, the size of the Red cloud denotes the extreme sell volume of the Market which is a good signal for a clear Downtrend in the Market.
This is the Source of above image.
Moving Averages are a lot popular as strategy support indicators among Crypto Traders. It means, Moving Averages can be used with many strategies to increase the winning rate of those strategies. It also increases the effectiveness of the results that are generated in the charts.
However, the Ichimoku cloud indicator also consists of Major versions of Moving Averages, But we can add some extra Moving averages to analyze our charts by reaching beyond its limitations.
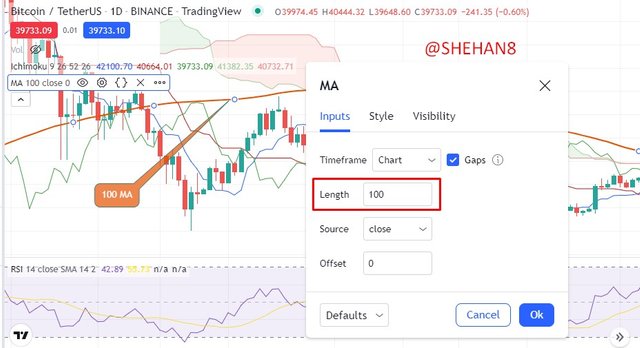
Here I wish to use the 100-period Moving Average indicator as a combined indicator with this strategy and below I have included a screenshot that I have taken while adding this 100-period MA to my chart.
Screenshot - https://www.tradingview.com/chart/
Now I will use the complete strategy using 100-period Moving Average and RSI + Ichimoku Cloud indicators. Especially the reason for choosing this Higher period Moving average is that this Ichimoku Cloud indicator already has a lower period Moving Average. Therefore, it will not be an advantage if we include lower period MA again.
Screenshot - https://www.tradingview.com/chart/
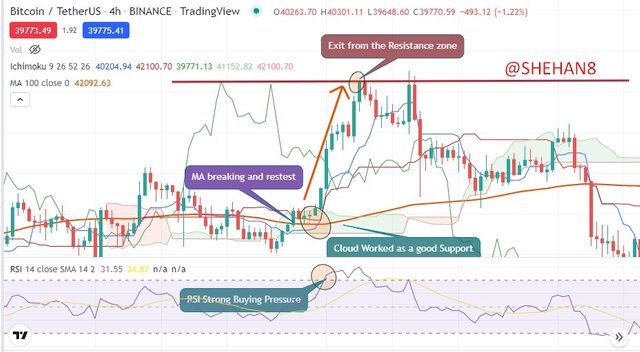
According to the above screenshot, we can clearly see that the price level has sharply broken the MA line and started a good Uptrend. At this point, we can clearly confirm the RSI signal and the Ichimoku Cloud Signal. Here the RSI indicator has reached a good buying pressure region and the Ichimoku Green cloud has supported the price to maintain its level.
As I said before, the Ichimoku cloud indicator is a very cooperative indicator for identifying both support and resistance levels. Therefore, The RSI + Ichimoku strategy can be a good combination. Because the RSI tells exact Market oversold and overbought levels. In addition to that, the Ichimoku cloud indicator indicates the exact supports and resistances levels of the Market. And also, the Ichimoku cloud indicator helps to identify the exact trend of the market by filtering out unnecessary price movements. So, let's identify both support and resistance levels in a Trending Market and as well a sideways market.
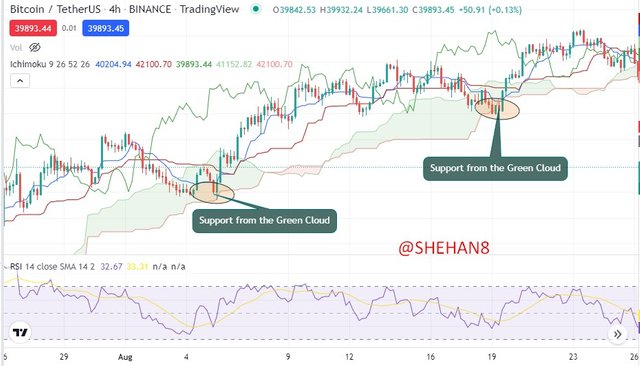
👉 This strategy in a Trending Market
According to my analysis, the RSI+ichimoku strategy works very well in a Trending Market as compared to Sideways Market. If I explain it further, when the Ichimoku Cloud Indicator appears as Green clouds, then it tightly works as support zones. At the same time, when the Ichimoku Cloud Indicator appears as Red clouds, then it tightly works as resistance zones. Let's look at some examples through charts.
Screenshot - https://www.tradingview.com/chart/
Screenshot - https://www.tradingview.com/chart/
👉 This strategy in a Sideways Market
As I said before, we can't expect accurate signals from the Ichimoku Cloud indicator alone in a Sideways Market. This is because we should consider the RSI indicator to find exact support and resistance zones. That's why we have combined RSI with the Ichimoku Cloud indicator to create this profitable strategy. So, let's look at some examples through charts.
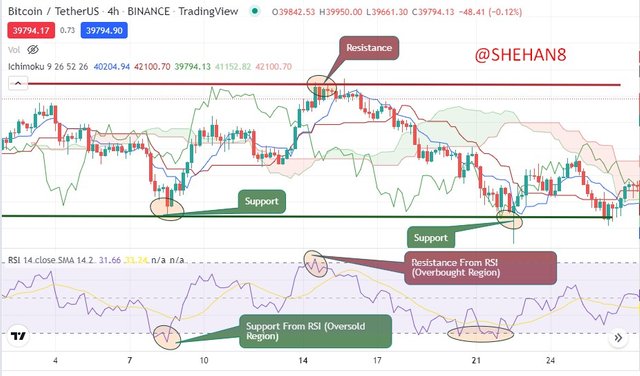
Screenshot - https://www.tradingview.com/chart/
According to my analysis, I can surely say that this RSI + Ichimoku strategy is a very useful and profitable indicator for intraday traders. Because the combination of the RSI and Ichimoku indicators act as fully completed trading setups for giving higher winning rates in 1h and 4h time frames.
With the help of this Strategy, we have the possibility to identify overbought and oversold zones in a very effective manner. It means, in addition to selling assets at an overbought level traditionally, we can still analyze the market by using the Ichimoku Clouds indicator. Then, we can realize that the market can still continue its trend even if the RSI shows an overbought level.
In addition to that, we can find exact support and resistance zone using both RSI and Ichimoku Clouds. So, when both RSI and Ichimoku Cloud Indicators confirm a resistance or support level, that entry point will be highly accurate as compared to individual indicator signal entries.
However, we should have the ability to understand both indicator signals and we should manage our entry points following the exact trend in the market. For that, we can use a higher period Moving Average to get support.
Finally, even the both RSI and Ichimoku Cloud indicators confirm an entry or exit point, we should mage our risk by placing the right Stop loss point after analyzing the price chart. In this way, we can profitably use this indicator as intraday traders.
👉 Buy Enty using this Strategy
First of all, I have to analyze the chart carefully considering both RSI and Ichimoku cloud indicators. here I will demonstrate my Buy entry using CELR/USDT chart. Let's move to my chart analysis and demo trade.
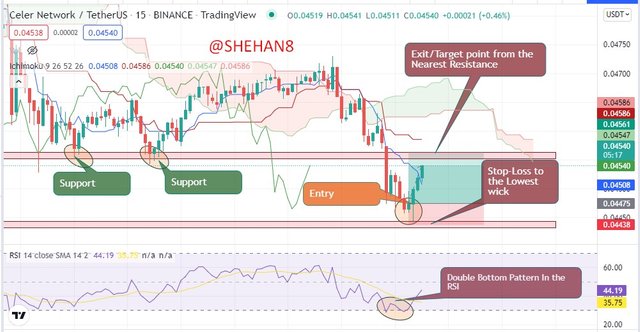
Screenshot - https://www.tradingview.com/chart/
In the above-attached screenshot, we can clearly see RSI shows a good oversold region as well as a good double bottom pattern formation. So, we already know that the double top pattern is a good bullish sign for the price movement. In addition to that, I can see a good green cloud has formed above the price chart. Also, it has a considerable bullish volume.
Finally, I have taken my entry at the exactly highlighted point in the chart. Below we can see the progress of my Buy demo trade.
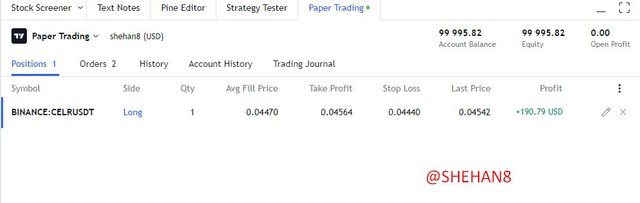
Screenshot - https://www.tradingview.com/chart/
👉 Sell Enty using this Strategy
Same as the previous Buy entry, here I have to analyze the chart carefully considering both RSI and Ichimoku cloud indicators. here I will demonstrate my Sell entry using XEC/USDT chart. Let's move to my chart analysis and demo trade.
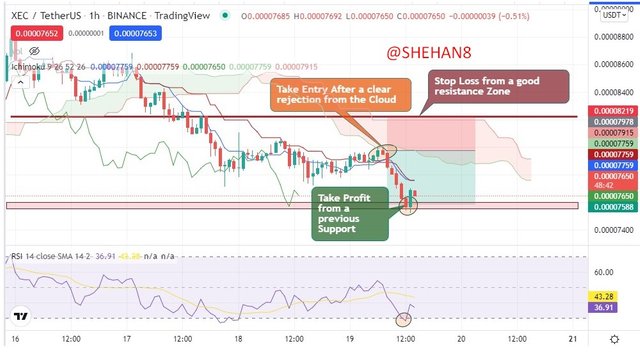
Screenshot - https://www.tradingview.com/chart/
In the above-attached screenshot, we can clearly see the price level has sharply rejected from the Ichimuko Red cloud. However, we already know that the Ichimoku Red cloud means a strong resistance zone and these zones will work as good price rejection areas. So, same as I thought, the price level has clearly reached until the RSI shows a good oversold region. In addition to that, I can see a good support zone near this level and I think it is the best point to close my sell position.
Finally, I have taken my entry at the exactly highlighted point in the chart. Below we can see the progress of my Sell demo trade.
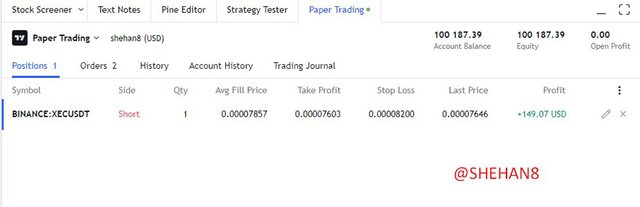
Screenshot - https://www.tradingview.com/chart/
This is all about my homework post and I thank you to professor @abdu.navi03 for such a valuable topic that was really very educational.