Advanced Breakout Strategies with Volume Profile and VWAP
Greetings my fellow traders,
It's the second week of the Steemit Learning Challenge for season 21 and I'm delighted to join this week's competition which is titled Advanced Breakout Strategies with Volume Profile and VWAP. I will be attempting the questions given below as part of my entry for the contest.
| Question 1: Explain the Concepts of Volume Profile and VWAP |
|---|
Define Volume Profile and VWAP and discuss how each tool provides unique insights into market dynamics. Explain their role in identifying potential breakouts.
In trading, some of the major indicators used to analyse price as well as volume data in a more effective way is the Volume Profile and the Volume Weighted Average Price (VWAP) indicator. Both of the above mentioned indicator helps traders to know when there will be breakout in the market also it helps to understand the market movement at any point and time.
I will want to discuss them one after the other, discussing their definition, unique insights and their various roles in identifying breakouts in the market. So let's go ahead to explain them.
Volume Profile
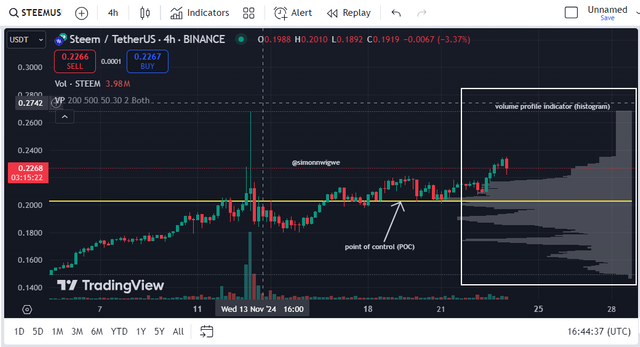
The volume profile indicator is a technical analysis tool which shows the distribution of trading volume in a histogram format in a horizontal axis i.e, directly opposite to the price of the asset as you can see from the screenshot below. This display differentiate it from the view of the original volume bar which is usually found below the price chart.
From the above screenshot, you will notice that the trading volume at different levels are well represented by the histogram chart and this varies with time. The chart display is a 4H timeframe chart of STEEMUSDT.
Unique Insights
There are many unique insights to this indicator and I will be discussing them one after the other below. So let's go through it together.
Price Levels with High Volume: Places of high volume as identify by the indicator are places where we see support and resistance as the prices always bounces back or breakthrough when this levels are reached.
Value Area: The area called the value areas are areas where traders are mostly very active. They are mostly the upper band or lower band area where we see overbought and oversold.
Point of Control (POC): The point of control is the chart area with the highest trading volume. In a chart, when you use the volume profile indicator then these area is always highlighted with a line and it serves as key resistance or support area.
Role in Identifying Breakouts
Breakout can be identified using this indicator when the prices of the asset moves from a high volume side to a low volume area which is also called low volume node. When this happens we see congestion of price which may lead to breakout or tells traders that a new trend is about to start.
VWAP (Volume Weighted Average Price)
As the name suggests Volume Weighted Average Price it is an indicator that is used to determine the volume of asset traded at each price for the day. So this means that traders uses this indicator to determine if the price of the asset for the day is trading below or above its average price.
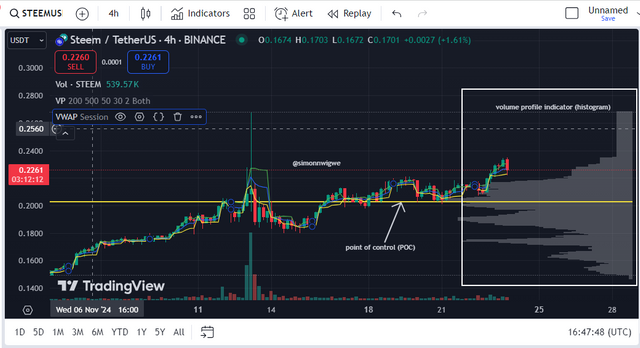
From the screenshot above you will notice that I have added the VWAP indicator to the price chart along side the initial added volume profile indicator. The VWAP indicator is made up of 3 lines which are blue, green and yellow.
The blue is seen as the VWAP line whereas the green is the upper band line and the yellow is the lower band line.
Unique Insights
Average Price Context: The VWAP indicator provides an average price that has been paid for the asset within the day which tells traders wheather or not there was an increase or decrease in the price of the asset.
Institutional Benchmark: Institutional traders use this Technical tools mostly when they wish to make an order as it helps to minimise the impact in the market when they are selling or buying an asset. This means that the indicator helps them to sell asset in a price not too low and also to buy an asset in price not too high.
Role in Identifying Breakouts
Above VWAP: As explained above the VWAP line is the blue line so if price moves above this line, it implies that the market is very bullish and further upside in the market is expected.
Below VWAP: As explained above the VWAP line is the blue line so if price moves below this line, it implies that the market is very bearish and further downward in the market is expected.
VWAP Crosses: When there is a breakout above or below the VWAP it implies that there are possibilities of trend change to the direction it has broken. So a break above indicates upward movement whereas a break below indicates downward movement.
Comparison and Use Together
Volume Profile indicator as explained earlier provide level where trading has been carried out much which also act as key support and resistance level. On the other hand VWAP gives the average price of the asset for the day.
| Question 2: Identifying Breakout Zones with Volume Profile |
|---|
Use historical charts of Steem/USDT to show how Volume Profile identifies areas of strong support/resistance and low-volume zones where breakouts are likely to occur.
In other to identify areas of strong support/resistance and low-volume zones where breakouts are likely to occur the steps below will serve as a guide to those reading through this post.
Steps to Analyze Steem/USDT with Volume Profile
This guide I'm sharing with us is a theoretical guide which will help those reading through this post to perform the task on their own. We are still going to look at the practical as well for more clarification.
Firstly, load the chart using TradingView and select a pair of STEEMUSDT on atleast 4H timeframe.
Go to indicator and add the volume profile indicator
Identify the key levels of support and resistance
hich are the High-Volume Nodes (HVNs) with much trading activity & the Low-Volume Nodes (LVNs) with minimal trading activities.Check for historical price action where HVNs shows reversal or LVNs indicates a breakthrough or continuation of the trend.
Example with Steem/USDT
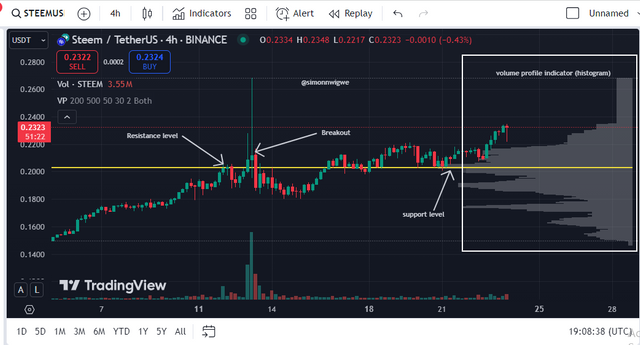
From the below screenshot, I have added the volume profile (VP) indicator to the chart and the Point of Control (POC) line also is clearly seen which helped me to identify key resistance and support points in the market.
The levels of the high-volume node (HVN) is seen at the support support level also you can see that another HVN acted as resistance. So level $0.2 is a strong support level as indicated by the VP indicator.
We saw a low-volume node (LVN) between $0.20 and 0.21 as you can see from the chart, anytime price enters this zone a sharp move is seen as in the above chart. So that level is a level with little resistance which aid breakout.
Based on the data we have guided you will notice that historically when the price break above the $0.21 which is the resistance level and there is an increase in volume it implies that there is bullish momentum in the market. In thesame way, if the price breakdown below the $0.20 which is the support level then it implies that the market has a strong bearish momentum.
| Question 3: Validating Breakouts with VWAP |
|---|
Discuss how VWAP is used to confirm breakout strength by analyzing its interaction with price movements. Provide examples of price-action behavior near VWAP during Steem’s bull run.
Volume Weighted Average Price (VWAP) is a tool that is used to confirm breakout strength when checking price of the asset in relation to the average price per day. This tool helps traders to know if the market is trending or if it is consolidating also it helps traders to assertain breakout when the price moves around the VWAP. Let's look at a few points on how one can confirm breakout strength using this indicator.
How VWAP Confirms Breakout Strength
Price Above VWAP: When price of the asset is seen above the VWAP, it indicates that the market is bullish. If the price breakout and continue to move above it it implies that the breakout is a strong one and that the uptrend movement of the asset may continue.
Price Below VWAP: When price of the asset is seen below the VWAP, it indicates that the market is bearish. If the price breakout and continue to move below it it implies that the breakout is a strong one and that the downtrend movement of the asset may continue.
VWAP as Dynamic Support/Resistance: The VWAP always acts as dynamic support and resistance in a strong trending market. If the price is seen above the VWAP for a while and there is a pull back, the pull back can be seen as a buying opportunity. Also in the bearish market, when price moves to the VWAP, the VWAP can act as a dynamic resistance.
VWAP Crossovers: When there is cross above or below the VWAP it is consider a breakout and if for any reason the volume during the breakout is strong then the breakout is consider a strong breakout.
Examples of Price-Action Behavior Near VWAP During Steem's Bull Run
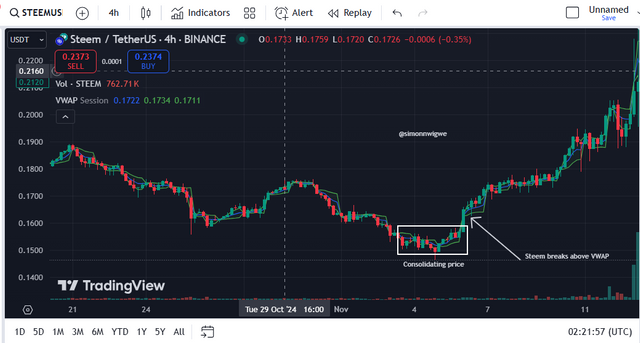
Lets consider the screenshot below as we look at bullish breakout confirmation using the VWAP indicator during Steem Bull Run. Here I will discuss the ore-breakout, VWAP Crossover and Price Holding Above VWAP.
Frome the above screenshot, you can see that at the Pre-Breakout Steem was consolidating and the area where this is done has been marked in the above chart. Consolidation indicates indecision in the market as both buyers and sellers are competing who has the market.
Suddenly we saw price breaking above the VWAP which also comes with an increase volume as seen from the volume chart below the said asset. The price as you see continue to move above the VWAP which shows that the buying pressure is much. Now seeing this traders will go ahead to conclude that the breakout is real as the asset continue to move upward.
Also, seeing that the price remained above the VWAP, when it retraced back to the VWAP we saw the VWAP acting as a dynamic support level. So this confirms that the breakout is strong and the strength of the breakout is confirmed from here since it doesn't go below the VWAP again.
| Question 4: Developing a Breakout Strategy |
|---|
Create a step-by-step breakout trading strategy for the Steem/USDT pair. Integrate Volume Profile and VWAP to define entry points, stop-loss levels, and profit targets.
To create a step-by-step breakout trading strategy for the Steem/USDT pair using the Volume Profile and the VWAP indicator showing clear entry points, stop-loss levels, and profit targets, let's consider the below steps.
Analyze the Price in Relation to VP
Identify Key Support and Resistance Zones Using Volume Profile (use a timeframe of atleast 4H).
Make use of visible or fixed range volume profile to determine HVNs & LVNs. Recall that areas of HVNs are areas of strong support and resistance level where price reverses or consolidate whereas LVNs are areas of weak support and resistance level where price price moves quickly making them a breakout point.
Search for areas of LVNs since the resistance is not strong here and the volume is also not much meaning there are tendencies for price to breakout.
Analyze the Price in Relation to VWAP
Add the VWAP to your chart. This will give you the averaged weighted price by volume in the current timeframe.
If the price is seen above the VWAP it implies that breakout to the upward direction is imminent.
If the price is seen below the VWAP it implies that breakout to the downward direction is imminent.
When there is a cross either upward or downward of price with strong volume then we can say a breakout has occurred and it is a strong one.
Define Entry Points
Bullish Breakout (Above HVNs)
If the price breaks above HVN and the price is above the VWAP it implies a bullish breakout. Check the volume to be sure it increase as well for confirmation that the breakout is strong (strength of the breakout).
If price breaks above the key resistance level, enter a long position. Ensure that price hold above the VWAP before entering the long as it tells you how strong the trend is.
Bearish Breakout (Below HVNs)
If the price breaks below HVN and the price is below the VWAP it implies a bearish breakout. Check the volume to be sure it increase as well for confirmation that the breakout is strong (strength of the breakout).
If price breaks below the key support level, enter a short position. Ensure that price hold below the VWAP before entering the short as it tells you how strong the trend is.
Set Stop-Loss Levels
For bullish step up, place your stop loss below the breakout level or below the VWAP, this is to help keep you in the market and to minimise your loss incase the market goes against you.
For bearish set up, you can as well place your stop loss above the breakout level or above the VWAP. This is also to help keep you in the market and to minimise your loss incase the market goes against you.
Set Profit Targets
For bullish, your profit target area should be the next HVN which can be spotted using the volume profile indicator and the next target area should be LVNs due to price sharp movement to that direction.
For bearish, your profit target area should be the next HVN which can be spotted using the volume profile indicator and the next target area should be LVNs due to price sharp movement to that direction.
Monitor and Adjust the Trade
You may consider using the Trailing stop here in your trade to minimise loss and maximise profit. You are to monitor the market here and if the asset goes as predicted, you adjust the stop loss to lock the profit made so that the sharp moves don't get you kicked out from the market without any locked profit.
You must always look carefully at the volume and be sure that there is enough volume before any breakout for your confirmation purpose.
Example Scenario for Steem/USDT
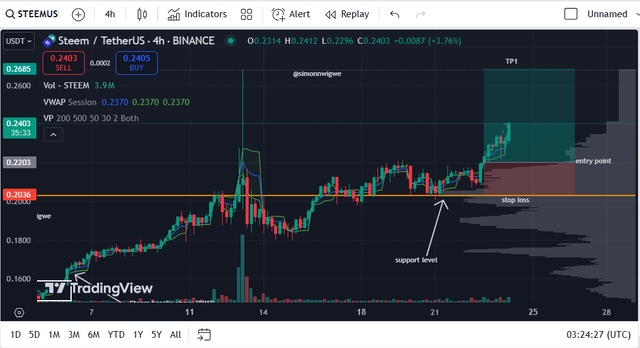
From the chart below you can see that I have add the volume profile and the VWAP indicator. The volume profile indicator helped me to spot key support level as you can see from the chart.
The break of Steem above the High-Volume Node where price was around $0.20 and the price above the VWAP and continuous upward movement is what made me believe that the trend is a strong one.
I allow the market to move and then retrace before entering it. When the market retraced and the price was moving upward back again I saw the volume as well and then entered at the point I have marked above.
My stop loss as you can see is kept in the key support zone. I didn't keep too much tight stop loss so that I can stay in the market for a longer time. I'm also confident that the market will continue upward seeing the strength of the volume and the price above the VWAP.
My target area as you can see is the next resistance area in the chart which is around $0.26 which is the next HVN from the volume profile indicator even as explained previously.
As the price continue to go upward, I will use the trailing stop method to adjust and lock the profit made so that any rally within the market won't take away all that I have made from the market.
| Question 5: Avoiding False Breakouts |
|---|
Highlight common risks in breakout trading, such as false breaks, and explain how Volume Profile and VWAP can mitigate these risks. Provide practical tips for enhancing breakout reliability.
There are some risk associated with breakout trading especially the false or fakouts where price pretends to move in a certain direction only to see it reverse immediately to another direction. Though tools like the Volume Profile and VWAP are basic tools which can be used to mitigate this false breakout. Some of the common risk in breakout strategy include;
False Breakouts (Fakeouts): If a price breaks through a key support or resistance level but at some point it fails to continue the upward movement, then such moves may likely reverse which will lead to traders losing money especially those who have entered the trade.
Low Volume Breakouts: When you notice a breakout in a low volume, you must be careful because it shows that the momentum pushing the price is not strong enough and that implies likely reversal.
Overextension of the Move: Overextension of the move is another issues we see, when price break this level it overextend the move and traders won't know it is a fakeout only to see it reverse with speed and then they get trapped in the market.
Market Noise: You see noise in the market mostly in a choppy market and during this period traders can enter or exit the market prematurely because of the fluctuations in the market.
How Volume Profile and VWAP Help Mitigate These Risks
There are many ways which the Volume Profile and VWAP Help Mitigate this risk and I will discussing them below.
Volume Profile
The Volume Profile as you already know has a major duty of identifying where major transaction is done via the significant volume increase and where minor transaction is done via the significant volume decrease. A breakout in a place with LVN indicates low market strength and a breakout in a place with HVN indicates high market strength.
So for better breakup confirmation, ensure that the breakout occurs in a place with HVN as that shows how strong the trend is and likely will continue in the breakout direction.
Also the volume profile tells traders that the LVNs are places that the price can breakout fastly and return so they need to be careful as well in this points. Also using the POC line you can identify key support and resistance level which you can serve as stop loss and take profit position of your trade.
VWAP
As explained initially, if the price is seen above the VWAP it suggests that the market is in an uptrend (bullish) and if it is seen below it suggest that the market is in a downtrend (bearish). So here you must ensure that the price break above VWAP before entering long and breaks below VWAP to enter short.
VWAP also acts as dynamic support and resistance level. In the bull market the VWAP acts as dynamic support as price are seen below the VWAP indicator and in the bear market VWAP acts as dynamic resistance as it stops price movement. So if price breaks through and then retest, watch if the VWAP holds it to act as dynamic support if it does then you know that it is a bullish market movement I e., bullish breakout and verse varsa.
Practical Tips to Enhance Breakout Reliability
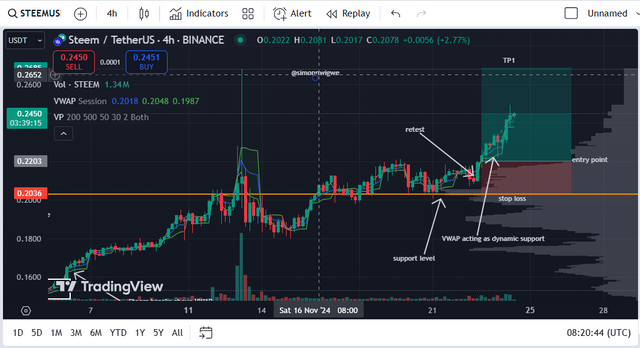
From the screenshot below let's consider the example chart which enable us to see breakout and then apply the above knowledge to be sure that it is not a fakeout. So here we look at Volume Confirmation, Breakout and Retest, Monitor the Price Relative to VWAP and more.
From the chart you will notice that the breakout level has an increase volume in both the normal volume indicator below price chart and the volume profile indicator we have added to the chart.
I didn't enter the market immediately after the breakout, I waited for the retest to be sure that the said breakout is not fake even when I confirmed from the volume. Since the break out was above the POC it implies an uptrend movement. I used the VWAP to confirm by checking to see that it acted as dynamic support to the price.
The stop loss as you can see is placed in the support level. This is done to keep me in the market for sometime incase there is a pull back or reversal also I used the combination of the both indicators to confirm the trend. In cases where the volume profile indicator doesn't agree with the VWAP then you will have to wait for more confirmation before taking such trade.
Finally, I want to invite @suboohi, @josepha, and @ripon0630 to also join the contest and share with us their thoughts on Advanced Breakout Strategies with Volume Profile and VWAP.
NB: All images except otherwise stated are mine and are gotten from the TradingView website


Upvoted! Thank you for supporting witness @jswit.