Advanced Technical Analysis with Divergence Trading
Greetings my fellow traders,
It's the second week of the Steemit Learning Challenge for season 21 and I'm delighted to join this week's competition which is titled Advanced Technical Analysis with Divergence Trading. I will be attempting the questions given below as part of my entry for the contest.
| Question 1: Explain the Concept of Divergence in Trading |
|---|
Describe what divergence is and the types of divergences (e.g., regular and hidden). Discuss the significance of each type and how they relate to potential reversals or trend continuations.
In trading, using technical analysis, the term divergence means a situation where the price of the asset is moving in an opposite direction from the technical indicators used on the chart of the said asset. Momentum based indicators such Relative Strength Index (RSI), Moving Average Convergence Divergence (MACD) or others may be seen going in a separate way from the price of the chart.
Example if the price of an asset on the chart shows that the market is in an uptrend whereas the indicator used is showing that the market is in a downtrend then we can say that is a divergence. Basically, divergence are used by traders to determine trend reversal or continuation. This means that when we notice divergence there are possibilities that the market is about to reverse or continue.
Types of Divergence
There are two major types of Divergence in trading and they are the regular divergence and hidden divergence. I will give detail explanation of each of them below as well as it significant.
Regular Divergence: When the price of the asset is seen making either a higher high or lower low, whereas the indicator doesn't capture this movement of the asset meaning it doesn't move upward when it was making the higher high moves and it doesn't move downward when it was making the lower low movement then we can conclude that the indicator is opposing the movement of the asset or the trend and this implies that there are possibilities of potential reversal to an opposite direction of the trend.
Bullish Regular Divergence: In the bullish regular Divergence, we see the price of the asset making a lower low whereas indicators like the RSI, Moving average or MACD is making a higher low. When we see that, the trend suggest that the downward momentum of the price movement is weak and this means that there possibilities that the price trend will shortly move in an upward direction.
Bearish Regular Divergence: In the beariah regular Divergence, we see the price of the asset making a higher high whereas indicators like the RSI, Moving average or MACD is making a lower high. When we see that, the trend suggest that the upward momentum of the price movement is weak and this means that there possibilities that the price trend will shortly move in a downward direction.
Significance: The major significant of this type of divergence is that it tells traders that there is going to be a trend reversal. When it shows up in a chart, the traders immediately notice that the current trend is getting weak and possibly trend reversal is about to happen. Though, traders needs additional confirmation before making any decision hence the can use the candle stick pattern, support and resistance or other confirmation tools to support their analysis and then make their decision.
Hidden Divergence: On the other hand, we see the hidden Divergence in a situation where the indicator is making making a higher high or lower low, and the price is instead making a lower high or higher low which means that the trend has a potential to continue in its current trend direction. Let's explain more in the bullish and bearish hidden Divergence below for a clearer understanding.
Bullish Hidden Divergence: If the indicator is making a lower low and the price of the asset is making a higher low then we can conclude that the momentum is currently building towards same direction as the trend and that implies that there possibilities of the trend continuing in same direction.
Bearish Hidden Divergence: If the indicator is making a higher high and the price of the asset is making a lower high then we can conclude that the momentum is currently building towards same direction as the trend and that implies that there possibilities of the trend continuing in same direction.
Significance: The major significant of this type of divergence is that it tells traders that there is going to be a trend continuation. When it shows up in a chart, the traders immediately notice that the current trend may persist. Though, traders needs additional confirmation before making any decision hence the can use the candle stick pattern, support and resistance or other confirmation tools to support their analysis and then make their decision.
Conclusion
Regular Divergence is used by traders to identify trend reversal when the indicator is seen moving in a complete opposite direction from the price. Similarly, Hidden Divergence as explained above talks about trend continuation and we see this when the indicator shows a more stronger trend than the price.
Traders often use divergence along side other tools and indicator to determine the price movement of an asset on a chart and to know if they are to long or short the market.
| Question 2: Identifying Divergence with the RSI or MACD |
|---|
Using a historical chart of Steem/USDT, identify and explain an example of bullish or bearish divergence using the RSI or MACD. Discuss how this divergence could have informed trading decisions.
In this task, I will head up straight to my TradingView website and then look at a historical chart that best describes either a bullish or bearish divergence while applying the RSI or MACD. Without further delay let's check this out.
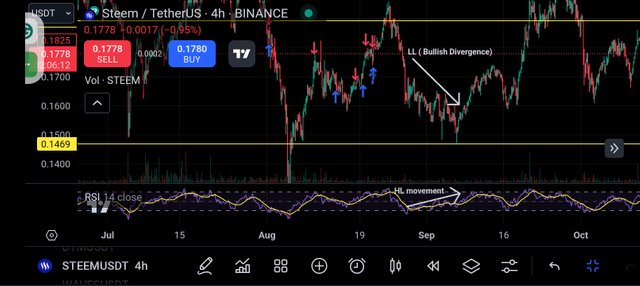
Bullish Divergence Using RSI on Steem/USDT
Considering the screenshot below, we are going to look at the chart pattern, interpretation, trading decisions and lastly potential actions.

Chart Pattern Identification: The above chart is a chart of STEEMUSDT on a 4H timeframe and from the arrow indication you will notice that the market is in a downtrend making lower lows. At the same time, the RSI indicator is seen making a higher lows which implies that a bullish divergence is forming.
Interpretation of Bullish Divergence: Based on the explanation given previously on bullish regular Divergence, you will agree with me that selling pressure is getting weak even as the price continued to go down. So based on the indicator we are expecting a possible trend change in an upward direction.
Trading Decision: Before taking any trading decisions here, the trader must wait for a confirmation to be sure that there is going to be possible trend reversal and not just a fakeout. To do this, trader may want to use the candle pattern formation such as bullish engulfing candle or a hammer candle or better still use the support and resistance pattern.
Potential Actions Based on Bullish Divergence: After confirmation, traders may decide to initiate a long position as they anticipate the current trend to reverse back to the opposite direction. After taking a long position, one may decide to ensure that he or she manages his or her risk by putting a stop loss just below the last low to protect his account incase the market still decide to go downward.
Conclusion
Divergence in RSI as we have seen from the above chart can help traders to identify early trend change and with that one can make an informed decision which he will make a lot of profit from because he joined the movement of the asset at the right time and at the very beginning. Since confirmation are made before entering the market and a proper risk management is also taken.
| Question 3: Combining Divergence with Other Indicators |
|---|
Explain how divergence can be combined with other technical indicators (e.g., moving averages, Bollinger Bands) for a more robust analysis. Provide an example involving the Steem token.
To have a more robust analysis, combining other technical indicators with divergence can give us that effectively. So in this section I will love to combine moving averages or Bollinger Bands, to help in making trading decisions such as entry and the exit point for our trades. Using a pair of STEEMUSDT let's see how this indicator combination with divergence help traders.
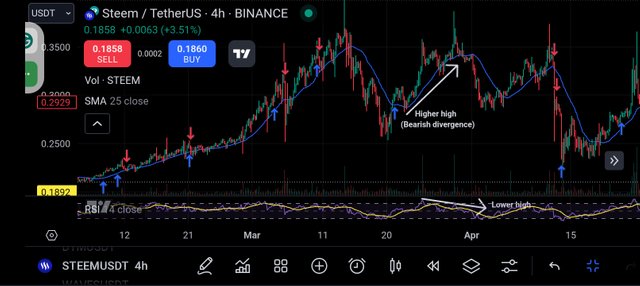
Combining Bearish Divergence with Moving Averages on Steem/USDT

Identifying Divergence: From the above screenshot, you will notice that the price of the asset from the chart is going in an upward direction (uptrend) as it keeps making series of higher highs but looking at the RSI indicator, I noticed that the indicator is making a series of lower highs which confirmed that the divergence is a bearish divergence.
Based on the signal, I knew that the bullish momentum was weak and a possible trend reversal to the opposite direction is possible so to confirm I decided to add another indicator for confirmation.
Adding Moving Averages for Confirmation: For confirmation I added the 25 day moving average indicator which also acted as a resistance as seen from the screenshot above. I was supposed to add another MA indicator to visualise the death cross but since I was working on a free version I couldn't add another MA indicator. So I removed the RSI and added the another MA which shows a death cross confirming the bearish divergence.
Trading Decision: Having seen the death cross and the divergence which was seen in the RSI and the price chart, I confirmed that indeed the asset is likely going to move downward and as a trader, if I'm longing a position at that moment, it is best I exit the trade and consider shorting the market.
Risk Management: To properly manage the risk, the stop loss is placed above the recent high so that if the market fails to obay all the signs that shows that it will be coming down then you can be kicked out of the market with little or no loss.
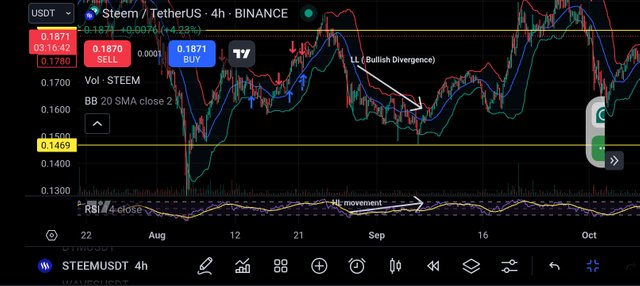
Using Bullish Divergence with Bollinger Bands on Steem/USDT

Identifying Divergence: From the above screenshot, you will notice that the price of the asset from the chart is going in a downward direction (downtrend) as it keeps making series of lower lows but looking at the RSI indicator, I noticed that the indicator is making a series of higher lows which confirmed that the divergence is a bullish divergence.
Based on the signal, I knew that the bearish momentum was weak and a possible trend reversal to the opposite direction is possible so to confirm I decided to add another indicator for confirmation.
Adding Bollinger Bands for Confirmation: The Bollinger bands as you can see from the chart has a 20-day MA and two outer bands with STD value of ±2 i.e the upper band has +2 and the lower band has -2 as you can also see the price of Steem moved below the lower band as we witnessed bullish divergence and that means that the asset is oversold and possible trend reversal is possible.
Trading Decision: Seeing the bullish divergence and the price also seen below the lower band indicates that there is a strong possibility trend reversal to the opposite direction. Here after such confirmation traders may consider longing the market immediately after the oversold and the price breaks above the the MA line confirming the movement.
Risk Management: To protect once account, your stop loss must be placed below the recent low and this is to help save your account from risk incase of the asset decide to continue moving downward. Also you can take your profit above the middle line or in the upper band.
Benefits of Combining Divergence with Other Indicators
The use of multiple indicators on a chart and combining it with divergence helps trades to make a more informed decision on the movement of the asset. As you can see from the sample above we have used the moving averages or Bollinger Bands indicator alongside divergence and we obtained an excellent result. So divergence and other indicators tells traders if the trend will continue or it will reverse to the opposite direction.
| Question 4: Developing a Divergence-Based Trading Strategy |
|---|
Create a trading strategy that utilizes divergence as a primary signal for entry and exit points. Discuss your criteria for confirming divergence signals and potential filters to reduce false signals.
To create a trading strategy that utilizes divergence as a primary signal for entry and exit point I will also be making use of the RSI or MACD divergence along side other indicators for confirmation even as explained in the previous question.
Also aside adding other indicators to filter false signals one may consider using the support and resistance pattern, candlestick pattern and many others to confirm the said trade.
Step 1: Identify Divergence: As explained previously, if the price is making lower low and the RSI or MACD is making higher low (Bullish Divergence) then it implies that the downtrend momentum is weak and a possible upward movement is possible.
Similarly, if the price is making higher high and the RSI or MACD is making lower high (Bearish Divergence) then it implies that the uptrend momentum is weak and a possible downward movement is possible.
Step 2: Confirm Divergence with Additional Indicators
Using MA to confirm movement, the price must be above 50-day MA during divergence (bullish divergence) while for bearish divergence price should be below the 200-day MA after the divergence is seen.
Similarly, using the Bollinger Bands, the price should touch the lower band during a bullish divergence which signifies oversold and in thesame way for the bearish divergence price should be touching the upper band indicating overbought.
Using candlestick you are to look for either a bullish engulfing candle or a hammer in the case of bullish divergence to enter the market. In the case of bearish divergence you are to look for evening star or bearish engulfing candle for your entry.
Using the Support and Resistance Levels, in the case of bullish divergence, ensure that price is above support level before entering the market whereas in the case of bearish divergence ensure that the price is below the resistance level before entering the market.
Step 3: Define Entry and Exit Criteria
For Bullish Divergence Entry
- Long the market
- Confirm it using RSI or MACD
- Additional confirmation using MA, Bollinger Bands or candlestick as earlier explained above.
For Bearish Divergence Entry
- Short the market
- Confirm it using RSI or MACD
- Additional confirmation using MA, Bollinger Bands or candlestick as earlier explained above.
For Bullish Divergence Exit
- Set Take profit at the next resistance
- Set stop loss below the recent low
For Bearish Divergence Exit
- Set Take profit at the next support
- Set stop loss above the recent high
Step 4: Use Filters to Reduce False Signals
Volume Confirmation: Increase volume means that there is a strength in the trend whereas low volume means that the trend is weak.
Divergence Timeframe Consistency: Check for divergence in multiple timeframe to be certain that it is a true divergence and not a fakeout.
Example Trade Using the Strategy
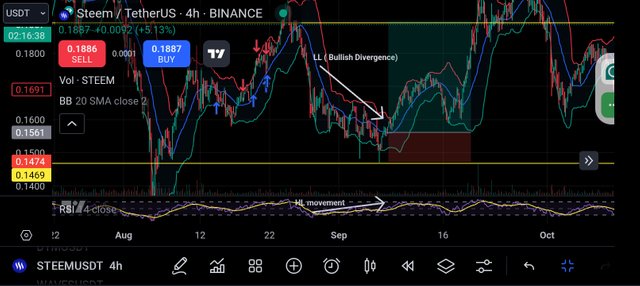
Based on the lay down strategy I have given above, let's consider taking a trade where I will be introducing my buy logo after witnessing a Bullish divergence.

The above screenshot is a pair of STEEMUSDT on a 4H timeframe and I used the Bollinger Bands indicator for my confirmation along side the Bullish engulfing candle. Which confirms that the price will be going in an upward direction.
The take profit is set to the next resistance level and the stop loss on the other hand is placed at the support level as indicated by the two horizontal lines on the chart.
The strategy as you can see yielded a very good result because the market went as predicted. So if it were a live market, then I would have made a good profit from the market.
| Question 5: Limitations and Best Practices of Divergence Trading |
|---|
Discuss the limitations of divergence trading and how traders can avoid common pitfalls. Include best practices for using divergence as part of a comprehensive trading plan.
There are lots of limitations associated to divergence trading and their solutions and today I wish to share with you all a few of these limitations and solutions.
Timing of Signals: Since the divergence signal comes before the continuation or reversal of the trend, there are possibilities that it can mislead traders into entering a trade they are not supposed to enter as it may be a fakeout.
Solution: To avoid the above, combine divergence with other techniyindicator such as MA, Bollinger bands or support and resistance as well as candle pattern.
False Signals in Strong Trends: There are situations of a strong trend where we see divergence but price doesn't acknowledge it because of how strong the trend is. So in this place divergence can be misleading.
Solution: To avoid counter trading you must use divergence carefully and ensure you get confirmation from other indicators before entering the market.
Variability of Divergence Interpretation: When we don't interpret the divergence well then a small shift can mislead us into thinking that a divergence has happened.
Solution: Ensure you see a clear divergence before making any trading decisions as many fakeout will mislead you.
Overuse of Divergence Across Timeframes: Checking through multiple timeframe for confirmation of divergence can be misleading so one must be very careful.
Solution: Always check for divergence in at least two timeframe such as 1H and 4H and once it is confirmed within both time frame the go ahead to enter the trade.
Common Pitfalls and How to Avoid Them
Entering Without Confirmation: Divergence alone is not enough for traders to make decisions as they need more confirmation. Hence use other indicators such as moving averages, Bollinger Bands for confirmation.
Setting Inappropriate Stop-Loss Levels: Setting an inappropriate stop loss can lead to traders been kicked out of the market before the market finally moves in their direction. So always set stop loss based on the support and resistance level and the highs and lows of the asset.
Neglecting Risk Management: Risk management is important and mustn't be neglected as neglecting it can lead to your account been liquidated. So to avoid liquidation ensure you have good risk management, and also use just atleaset 2-10% of your asset.
Best Practices for Using Divergence in a Comprehensive Trading Plan
Confirm with support and resistance and be sure that divergence are formed near this level before you can validate it as a good divergence to use.
Choosing a good timeframe also matters a lot. You shouldn't always try to use several timeframe instead you can use like 1H or 4H as it gives you a detail of the market overview within a short period.
Volume confirmation is very necessary, so always check that the volume is increasing or decreasing as expected based on the divergence that you are seeing on the chart.
Keep record of the divergence data you are using to trade as it can overtime become a pattern for you since some of the trading pattern often repeat itself.
Finally, I want to invite @suboohi, @josepha, and @ripon0630 to also join the contest and share with us their thoughts on Advanced Technical Analysis with Divergence Trading.
NB: All images except otherwise stated are mine and are gotten from the TradingView website

