SEC S18-W4 || Mastering Liquidity Levels in Trading.
While buying stock or any crypto coin, we all have seen following 3 things (1) its current live price on the exchange platform, (2) at what price the seller is available and (3) buyer is available, the price at buy and sell is a liquidity.
After all the cash used to buy asset and when asset sell, we get cash back, so cash is itself the most liquid asset. In this blog we will explore in details about liquidity in the trading.
Table of Contents.
- Describe the concept of liquidity levels in trading. Why are they important for traders? What indicators or tools are used to identify these levels on a price chart?
- What is a fakeout in the context of liquidity levels? Explain why and how traders are often trapped by fakeouts.
- Describe an effective strategy for trading liquidity levels correctly. What signs or confirmations should traders look for before taking a position based on a liquidity level?
- What are some tips and techniques to avoid fakeouts when using a trading strategy based on liquidity levels? Give a concrete example with detailed steps
- Analyze a chart of a crypto asset of your choice, including the Steem token, to identify liquidity levels. Describe a potential trade based on these levels by explaining your reasoning and the steps you would take to enter and exit the position.
Describes the concept of liquidity levels in trading. Why are they important for traders? What indicators or tools are used to identify these levels on a price chart?
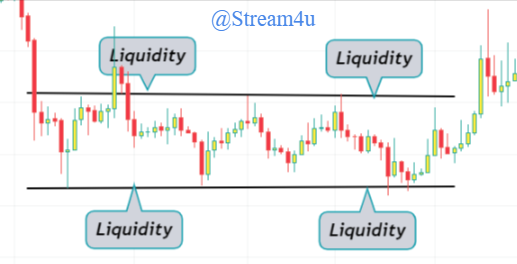
The concept of liquidity levels in trading is simple as its level at which the specific asset can be buy and sell quickly while the asset price is stable around its live price. It is considering how many total buyers and sellers are available at what prices and if trade or transaction can execute faster, easily. The liquidity levels in trading are mainly seen at the Price Consolidation, Support and Resistance, Breakout.
Price Consolidation Liquidity.
Understand the zone where asset price is consolidating for a specific duration is one the method to find a liquidity in an asset. This indicate the buyers and sellers are fighting equally due to which the price of the asset is moved between a specific level. This increases a high volume of trades and according to the liquidity the further price movement take action.
Support and Resistance Liquidity.
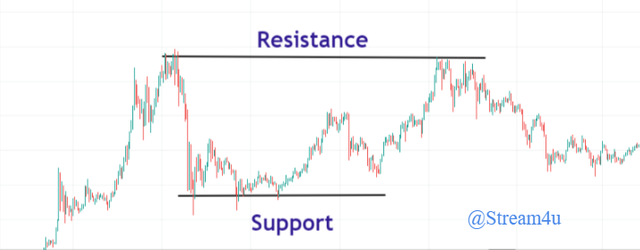
Support is the level from where the asset price can go up and Resistance is the level from where the asset price can go down. These levels can become a liquidity level as many investors and traders monitor such historical levels and trade accordingly in a future when price comes to around these levels.
Importartance Of Liquidity Levels For Traders.
Understanding of liquidity levels is much important ant for traders so that they can plan for their trade accordingly and helps to avoid potential losses. liquidity level are prediction points from where price can move towards the expected levels so it helps for traders to execute their buy and sell orders.
Further, the traders can use the liquidity levels for stoploss so that if market goes against them, they can quickly out from the market which means avoid the losses. Below are some key points which explain the importance of liquidity levels for traders.
Market Prediction - Liquidity levels can help traders to understand future price movements. When an asset price reaches to the liquidity levels, the traders place their orders to benefit from price bounce back or breakout.
Placing Buy-Sell Oder’s - Traders can use the liquidity levels to trade confidently as there are numbers of traders available at the liquidity levels due to which the trader’s entry and exit positions can place and execute faster as liquidity is high.
Avoid Loss - While placing a buy order at the liquidity level, the traders can place the stoploss at around the same level so that if prediction goes against traders means market price react opposite that what it should be then by taking small loss a traders can avoid potential loss due to this market opposite behavior.
What indicators or tools are used to identify these levels on a price chart?
Traders can use indicator according their preference. However, there are couple of indicators available which can help you to identify the liquidity levels. In TradingView if you try to search liquidity indicators, just type word "liquidity level" and you will get hundreds of indicators, some are locked/paid. In below I described couple of indicators that I seems to be easy to understand and have a good accuracy, these indicators are available on the TradingView and can used to identify the liquidity levels on the price chart.
Liquidity Zones[Angel Algo]
The "Liquidity Zones" is one of the indicators that help traders to find high level and low level of liquidity areas. This tool finds the highest and lowest trading activity during the specific time and making the points where that trading activity happened. These liquidity areas are act like key level for Support and Resistance.
How To Use?
After adding indicator “Liquidity Zones[Angel Algo]" on a price chart, this will draw low and high liquidity areas, from the additional settings we can adjust the look and behavior. Additional bar settings allow you to see like if a candle close above the zone it colored green and when close below it colored red. Further when candle close above the zone it indicates the potential support level and when it close below it indicates the resistance.
Liquidity Grab Zones.
Liquidity Grab Zones indicate a sell side and buyside liquidity areas. This indicator comes with default retest and breakout labeled.
How To Use?
After adding indicator “Liquidity Grab Zones", it indicates the area of high-volume liquidity wherein the price may reverse from its level and consolidate. The red zone indicates high liquidity in sell side and the green zone indicate the high liquidity in buy side. This level helps trader for entry and exit points.
This indicator automatically generates the retest label where market trend retest which shows that the market continues remain in its current trend. However, when candle close above or below the zone it indicates with the breakout label. Breakout the zone indicates the strong momentum in the market and falling breakout indicate that this zone will act as Support and Resistance.
What is a fakeout in the context of liquidity levels? Explain why and how traders are often trapped by fakeouts.
In simple term the fakeout means false breakout indication. Fakeout generate when asset price extremely moves above or below the liquidity zone but then quickly move into the reverse direction.
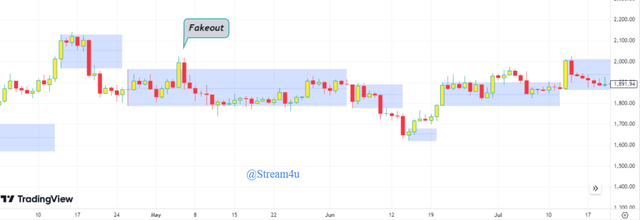
As most traders wait for the breakout point to get a high momentum in price action and get a good return in short term, As shows in the above chart example, we can see how the price reacts to the liquidity zone and accordingly move between Support and Resistance levels.
When price crosses these support and resistance levels, there is higher chances that big price movement is going to happen, so traders mostly place there buy and short potions at this level. However, we should also understand that market is not always move as per what we see. Hence, when suddenly price move in reverse direction after breaking the support or resistance level means fakeout the trader’s positions goes in opposite direction means loss wherein the trapped gets trapped frequently.
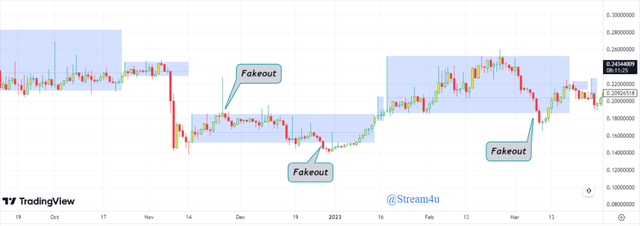
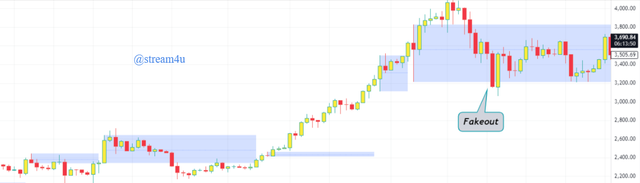
In the above price chart, we can see few price movements where it was moving reverse after breakout to the liquidity zone. In the first fakeout we see the candle has given breakout to the liquidity zone and crosses the resistance level, many traders may place buy orders as soon as breakout happen, we can also see how the candle was big, but the end was, the same candle came down making big shadow and then next price started moving opposite direction means down side.
Similarly, the second fakeout, we see how the price crosses the liquidity zone support level indicating price will go down, many traders may have exit or short trader place their short position assuming price will now go down. Then next movement we see the price moved opposite direction means up side. Here how the traders can frequently get trapped by fakeout.
Describe an effective strategy for trading liquidity levels correctly. What signs or confirmations should traders look for before taking a position based on a liquidity level?
The strategies and indicators are not always 100% accurate. However, you can do some workaround with the strategies to get comfortable with it based on how it is accurate and its success rate.
Discussing on effective strategy for trading liquidity levels, so I will suggest look for a small range liquidity levels means the liquidity levels support and resistance should not be so far from each other.
Another strategy is making a mindset whether you wanted to trade between the liquidity levels or breakouts of liquidity levels. If you want to trade between the liquidity levels, then you should respect the support and resistance levels of liquidity means buy when price is at support liquidity level and sell when price reach to the resistance liquidity level.
The sign that trader should look before taking position. For buying at the support level of liquidity zone, wait for the price touches to the support line, once that is touched wait for its closing. If candle close inside the zone means above support level and next candle appeared at the same level, you can place buy order and the stoploss will be the resistance level (Note, as mentioned above look for a small range between support and resistance).
For breakout trading, the sign will be when price give breakout to the support or resistance level, wait for the candle closing. If candle close above the support level and next candle start from the above support level and close, this can be confirmation that high movement can see in upside so buy order can place and stop loss will be below the support level.
What are some tips and techniques to avoid fakeouts when using a trading strategy based on liquidity levels? Give a concrete example with detailed steps.
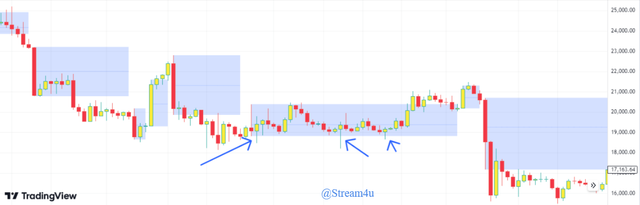
To avoid fakeout, the simple techniques as per my suggestion you can use is do not place orders right after when a candle breaks the support or resistance level.
As you can see in the above technical charts, the price took reverse after the breakout given and very next candle took a reverse mode. As mentioned above the tips here is to wait for the next candle after breakout candle, if the next candle open can close above the resistance level or the support level then you can place your trades. The more tips and techniques to avoid fakeout on liquidity levels are as follows.
Look at Volume: Take a look at the volume fluctuation at the liquidity levels. The higher volume indicates strong involvement of other traders and can give a valid breakout or reversal.
Candlestick Pattern: Analyze the pattern of candlestick close to the liquidity levels like hammer candlestick pattern indicate the reversal trend and flag indicate the continuation trend. Such candlestick pattern gives us a market overall sentiment.
Trade After Confirmation: Should not enter trade directly at the liquidity levels. Wait till we get a confirmation signals like candle close above or below the liquidity levels which also avoid fakeout.
Confirm with Other indicator: Do not take decision based on single indicator, use additional indicators like RSI, Pivots with liquidity levels to avoid false indication. If liquidity levels and most of other indicators pointing same direction then price action can be confirmed.
Strict Stop Loss: After taking trade, always place a stop loss after the liquidity levels. This stops loss will save potential loss if market moves against unexpectedly.
Analyze a chart of a crypto asset of your choice, including the Steem token, to identify liquidity levels. Describe a potential trade based on these levels by explaining your reasoning and the steps you would take to enter and exit the position.
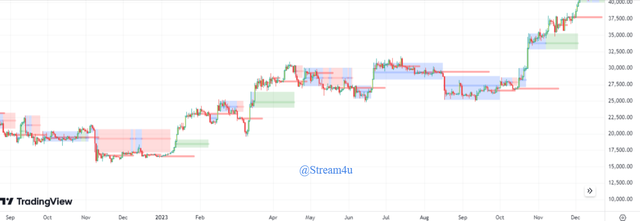
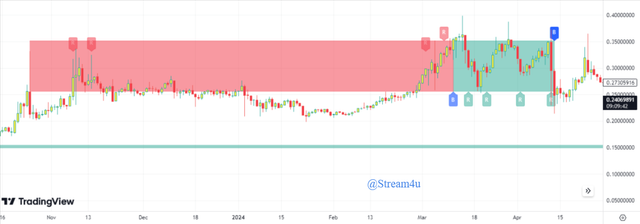
Here, I will analyze the Ethereum chart and will explain liquidity levels and trades by exploring the reasons. Please see the below Ethereum Technical chart.
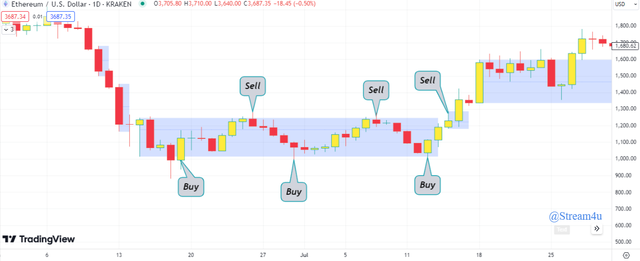
In the above technical chat with the liquidity zone, I can see the levels support and resistance. I can see the price touch the below level and then go towards the upper level and then again go towards the below level. Here I can determine that below is the support level where buyers are available who can pull back the price up and upper is the resistance level where sellers are available who due to which the price getting down.
Due to the above observation and reason, I will place buy trade when price at the lower level, at the same time I will also place stop loss after the lower level. Now when price reaches to the upper level, I will place sell trade and book the profit. If price did not move up and goes against me, my stop loss will hit and I will book the small loss if market goes against my prediction. Another trade I will like to describe, please see below technical chart.
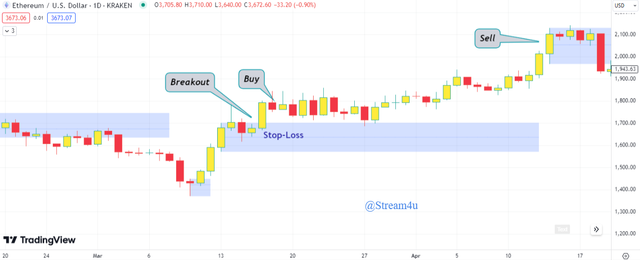
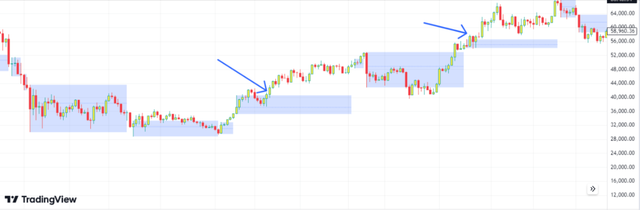
The above technical chart is representing the breakout liquidity levels. As mentioned above we should not trade right after in running breakout candle, we should wait till the next candle open and close above the resistance level. According to this, can candle breaks the liquidity levels above means break the resistance level, I keep watch the volume fluctuation, candlestick pattern and wait till the candle close above the resistance level and next candle also close the above resistance level to confirm the breakout.
Once next candle close above the resistance level that confirms the resistance breakout and indicate price will move up, I will place the buy order and the same time my stoploss will the candle low point which breaks and close above the resistance level. Now when next liquidity levels appear, that indicate me increasing in volume, as a safe trade I will sell my position and book the profit. In this trade if price did not go up and take reverse till the candle low point which breaks and close above the resistance level, my stoploss will hit and I will book a small loss if market goes against my assumption.
Conclusion about Liquidity levels.
Liquidity levels is one of the important concepts that provide valuable information of market movement and the price levels. Liquidity levels used traders and investor to find key areas to trade execution. However, in Liquidity levels it is also most important to check the price of buy and price of sell to avoid unnecessary losses. While using indicator for Liquidity levels, you should not depend the independent tool, and with this you can use other indication also to confirm the price trend direction. Understanding liquidity levels can give smooth trading experience to traders and investors.
Disclaimer: The information provided in this blog is for educational and informational purposes only. It should not be construed as investment advice or a recommendation to buy or sell any securities mentioned. Investing in the stock and crypto market involves risks, including the potential loss of principal. Readers are encouraged to conduct their own research and consult with a qualified financial advisor before making any investment decisions. The author of this blog is not liable for any losses or damages arising from the use of the information provided herein.
Author,
@steam4u
If you like this blog, you can join me in the comment section of this blog.
Your breakdown of how trading liquidity works and the strategies tied to it is like having a roadmap that's easy to follow, clear, and really helpful in understanding the whole trading scene. You've made it simple to grasp the concepts - awesome work.
Thank you for your kind words. I am glad that you found this information is helpful.
Determining liquidity based on indicators is very helpful for beginner traders like me.
When I first tried to buy assets on TradingView, I saw this and was then able to easily predict the movement of the market direction, even though sometimes it didn't reverse direction and was still in the green or red zone.
This is where I am very enthusiastic about learning trading because trading is not only smart and "lucky", but you also have to understand the strategy in it.
You have given a detailed presentation on the theme of liquidity, thank you very much for this knowledge and good luck and success... 👍👍👍
Thank you for your kind word. Yes, stratergies is must needed, atleast we should have confidence on one of the chart pattern or one of the technical indicator which giving good success rate. Support and Resistance are my favourite pattern, with any indicator I look their Support and Resistance levels.
You are welcome sir, I will learn more about this, time is running out... 🙂
You have discussed so well about the given topic of liquidity. It has been a long I posted in the Steemit Crypto Academy, because of how busy I am this day. I enjoyed your post sir. Good luck to you.
Thank you for your kind word. I was too busy last year, but then somehow managing the time.
@stream4u I appreciate how you have detailed the importance of these levels and the tools used to identify them. The sections on fakeouts and strategie to avoid them are particularly helpful. The examples with technical chart make the concept easy to understand. Thanks for sharing such valuable insights into trading liquidity. Good luck with the contest
Thank you for your kind word. Glad that you found this blog informative and helpful.
Este contenido esta muy bien explicado y sustentado. Me agrada encontrar información valiosa que aporte y enriquezca nuestro conocimiento.
La tarea de un traders es algo difícil, es un asunto de aprender con la experiencia propia y ajena. El mercado tiene sentimiento y es algo con lo que hay que lidiar permanentemente.
Existen herramientas muy versátiles para determinar las falsas rupturas, los soportes y resistencias rápidamente en el Trading View. No las conocías hasta leer tu post.
¡Gracias por compartir, te mereces el éxito!
Thank you for your kind word. Glad to know that you found this information is supportive.
¡Feliz día!
@tipu curate
;) Holisss...
--
This is a manual curation from the @tipU Curation Project.
Upvoted 👌 (Mana: 2/8) Get profit votes with @tipU :)
@stream4u Amazing.
Wishing you best of the luck.
Stay blessed.
Thank you for your kind words.
Upvoted! Thank you for supporting witness @jswit.
Upvoted. Thank You for sending some of your rewards to @null. It will make Steem stronger.