Steemit Crypto Academy | Course 2 By @stream4u| How To Read Candlestick Charts In Different Time Frame & Information about Buy-Sell(Support & Resistance).


Hello All,
Hope you all are doing well. My self @stream4u, I am from India and one of your crypto professors, welcome you all to my class.
This is my second lecture and through this one, I will be explaining how to read the candle in a different time frame and some basic information about buying-selling zones.

IMPORTANT
Before I start this lecture, I would like to discuss one thing that I feel very important; it is related to one of the topic which I have given in the last lecture, below one is the same.
- Uptrend or downtrend, which one is good for buy a coin, explain why?
On this topic, the majority of answered received for the downtrend is good to buy.
So first let me tell you, I was expecting a very basic answer that is Uptrend and I got this answer from few posts.
I am not saying that Downtrend is wrong, your this answer might be from a different point of view or maybe according to the information that you have. So, here I would like to point you to the one thing and you also think according to it.
| Those who think a downtrend is good to buy, please note this one, it is one of the key points in trading. "Never think against/opposite to the market direction." |
So, If we buy in the downtrend by assuming we will sell when it will up and book profit then;
- Do we know, when the downtrend will end?
- Are we sure that after a downtrend it will come up to the level of buying?
- Are we going to hold for 4-5 years?
- Even after holding 4-5 year when it comes up to the level of the buy point, cant it goes down again because it came up after 4-5 years, here if it goes down again then are you holding more 4-5 years.
- After holding such a duration what return you achieved?
In these, most of the people sell their coins at a loss when money needs or people sell their coins at no loss and no profit after big holding when price come to the buying level.
While investing or trading into the market, never think opposite to the market direction. Once you have enough knowledge then you can think the opposite at the right time which means 1 step before the uptrend start.
I do understand that, according to your point of view that do not buy in an uptrend because according to you after an uptrend the downtrend will start(as a normal market behavior).
Now for this, we will move to the next level and see at which point/levels we should buy and sell Cryptos.
I hope the above information will clear your view, buy in the uptrend is a basic(beginner level) answer which I have expected in the first topic. But, now we will see where we can think exactly to buy.
Let's begin our 2nd class.
Before understanding how to read Candlestick Charts, we need to know what kind of trader we are?
There are few types of peoples/traders we can see in the market like short term, long term, and scalping.
Short Term Traders:- Trade within a day and book their profit/loss. Entry & exit anytime within 24 hours
Long Term Traders:- Hold the position for a week, month, or year. (My view: According to the increased manipulation in the market, if you hold a position successfully for a month in profit is a very big thing. Manipulation means the group of people who put huge money and creates uncertain volatility in one of the coin or in the market, in this a normal person like you and me gets attract from looking at the increasing price and then gets trapped, losses).
Scalping:- In this, the trader did not wait to complete a day, even did not wait for to complete a minute. they took a trade and within a few seconds Square off position with some positive points like $0.05. In this way, they do multiple trades. It requires huge money to get a good profit in $0.05 points.
Different time of candlestick chart represent the different positions, if you are a long term trader, you can't predict the market direction by looking at the short time candlestick chart.
In the last topic, we learn how a single candle represents, below is the same.
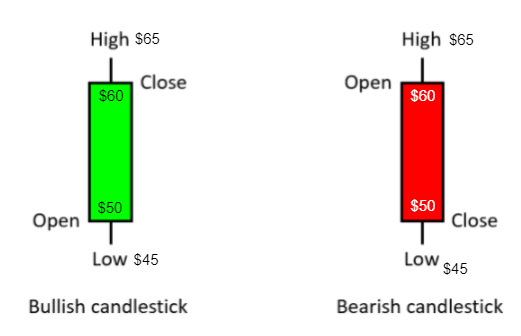
Light/Green Candle: Coin Price open at $50, made low $45, made high $65 and closed at $60.
Dark/Red Candle: Coin Price open at $60, made high $65, made low $45, and closed at $50.

In this picture, you can see that candles can be set in a different time frame like 1 min, 5 min, 15 min, 1 day, etc.
By selecting a specific time, a candle shows how it was open, made a low-high point, and closed.
In this, you can also try to change candle time to see if a common trend/direction which will be the strongest.
Different time of candle chart, a combination of multiple green and red candles shows different upsides and downsides.
While trading with the help of a candle chart, you have to be with a specific duration of a candle.
Let's see now how the different time of candle shows charts.
Below are the Ethereum charts at the same time but with a different time frame of candle chart.
I prefer a technical candlestick chart from TradingView.
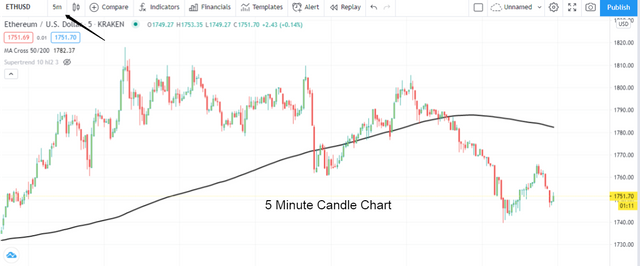

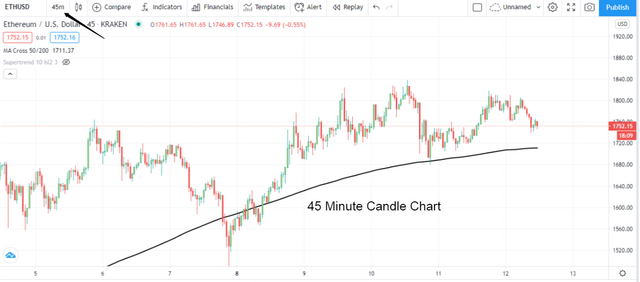

In the above charts, you can see the Ethereum price at the same time looks in a different direction in the different candle time frame.
The uptrend/buy indication shown in 5 minute or 15 minutes candle is maybe not for buy according to the 45 minutes or a 1 day candle, here if you are a short term trader then you need to select the accurate target and not to greed if the target achieved, once it achieved you have to square off.
The downtrend/sell indication shown in 5 minutes, 15 minutes, or 30 minute candle chart is maybe not a downtrend/sell according to the 45 minutes or a 1 day candle(long term traders), here if you are a long term trader then need to maintain patience and not to hurry, don't be panic as you following the technical concept and took the trade at right time then wait for the target.
It depends upon us, as I mentioned about we should know first which type of trader we are, some of maybe short time trader, some are long term.
Good Candle Time Frames according to the different type of traders
Short Term Traders(Day traders): This type of trader follows the 5 minutes, 15 Minutes, and 30-45 Minutes, accordingly find their buy/sell positions. Not to greed if the target achieved, once it achieved you have to square off or lease slowly slowly you will lose the profit too.
Long Term Traders(Holding Traders): This type of trader follows 1 Day or a Weekly candle. Not to greed if the target achieved, once it achieved you have to square off or else coins start coming down slowly slowly and you still expecting that it will go and in this your holding efforts, study, and time gets wasted.
Scalping Traders: This type of traders mostly do not follow any time frame of candle chart, they just take benefits from the quick price movement.
In Trading, We Trade On What We See & Not What We Think.
Our next topics will be completely on how to identify the buying and selling zones, how the candle chart indicates buy and sell, what are the candle chart patterns for buying and selling, then next level we will see some technical indicator and understand how they show buy and sell points in a volatile market. But, before that let's understand the basics about the buy and sell zone.
Not sure how this example will look :) :)
If there is a match playing between two teams, in one team there is only one player and the other team has 12 players. Who will win? obviously, the team which has 12 players,(only in movie life 1 player can try to beat 12).
Trading is in real life and real money, why I am giving this example?
If you are one trader and trying to buy a coin in a downtrend wherein 100 peoples are selling and pulling the price down. How you will survive by buying against 100 sellers?
Hence, you need to find a buy zone to buy the coin so that with you there will a 100 more people are available to buy the coin and can able to pull the price upside. Buy zone known as Support. on a technical chart.
Same in the opposite way you will have to sell the assets when others are selling, Sell Zone known as Resistance.
Let me draw a diagram and explain this same.

Support:- It is a level from which the price of the asset went UP last time and possible that it may go up from this same level. This should be the BUY point.
Resistance:- It is a level from which the price of the asset went DOWN last time and possible that it may go down from this same level. This should be the SELL point.
Support and Resistance can be seen in from 5 minutes of candle chart To 1 day, 1 week candle chart.
**Support and Resistance can be found according to the assets history movement.
Support and Resistance found in a specific time frame of the candle chart, let's say 15 min candle chart, then entry and exit will be ideal for that time frame of chart only until there is no spike occur. Hence Entry and Exit have to be executed according to the candle chart time frame and buy, sell zones.
Below is the most recent history of EOS Coin. Look at the arrows.
In this we will see when and where we should go for a buy order in Crypto.
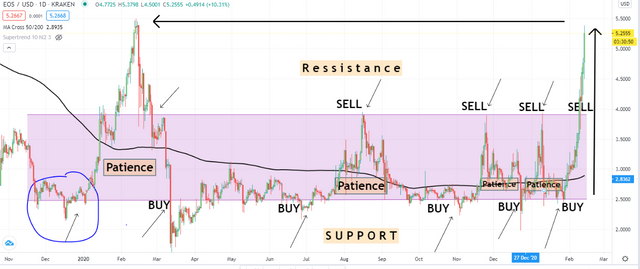
In this above chart, by looking at the circle and the first arrow we can see it was the level from which the EOS price was spiked, so no issue let it go up.
When you find any coin spiked, here, we need to maintain our PATIENCE and wait for as much as we can till the price comes down to the same level from which it was spiked.
Next, we can see the price of the assets came down again to the same level from which it was spiked, then monitor closely for the next couple of days,s and see if the coin trying to sustain, if yes go for BUY. You can see from this same level it spiked multiple times and gave an opportunity for buy multiple times, at the end, it gave a big spiked from this same level.
PATIENCE
Patience is one of the most important part of the market. Yes as a human tendency we get attracted from the increasing or decreasing of the assets price and then enter in somewhere. NEVER DO THIS.
If you see any asset price is going up, then mark the level from which it went up and wait till it comes down again at the same level.
Below is another example of the DASH coin chart, the most recent, and look at today's movement(13th Feb 2021), look at the arrows.
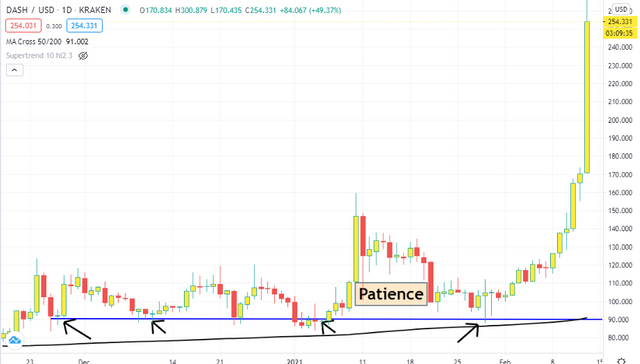
We can clearly see the levels from which the coin price spiked, draw a line so that you will know the level where to buy when it comes down again. Go for buy at this level. Today on 13th Feb 2021, you can see what spike can be achieved from this same level.
The height of the previous spike can be any small or big, but we have to maintain patience and wait for the correct level.
It is fine that after spike the coin keeps moving up, noted down the level, and wait till it comes down, till that time you can try to look for other assets that are coming to the support levels.
Support and Resistance look like a wave.
Support and Resistance can be found in any time frame of the Candle chart, mostly preferred for 5 to 15 minutes candle chart for short term and 1 day candle chart for long term.
In the Downtrend OR when the price of assets is falling............ Wait And Watch(Patience)............... Look at which level the price of assets is pulled back........Note Down OR Mark that Level.........Again Wait And Watch(Patience)............ When you see that the price of assets come down again to the same level where you have marked or noted down, here you can place for Buy order or invest your capital.
We will stop here, I am sure your interest in technical concepts may increasing now. If you have any concerns, doubts, questions on this first topic, you can ask me in the comment section, and don't forget to make a comment below on what type of trader you are.
Apart from Support and Resistance, there are more concepts for buy and sell which I will be going to cover in my upcoming topics in Crypto Academy.
In this topic, I have covered how to set the candle chart in the different time frames, why it is needed, what are possibilities if we broke the rules, how to find Support and Resistance, when and where the place to buy.
If you really like to go further from here then I would like to give you a Homework Task based on this topic and you need to make a post on this task.
Homework Task.
It's a humble request to read the homework task 2 to 3 times and make a homework task post only on the topics which are asked.
From the first homework task, I find some post which has quite different details mentioned which not given in topics.
The post is not limited to 300 words but try to express more about what you understood and explain in your own way, so that others or we all may learn something different from your post.
The subject and points/topics for this homework task are given below. The given all points/topics need to covered in the homework task. However, the homework task post is not limited to only given points/topics, you can add more but make sure it's relevant to this topic.
Homework Task Subject: Steemit Crypto Academy | Course 2 | How To Read Candlestick Charts In Different Time Frame & Information about Buy-Sell(Support & Resistance).
Explain what is the meaning of the Green and Red candle and how to read the Green and Red candle, with candles image.(Screenshot Needed)
Explain with Candle Chart, what are the time frames available that we can set into the chart, and why it needs to change the candle time frame? (Screenshot Needed)
Show any particular asset candle chart in a different time frame and explain in short what you see in the chart, like which trend we see, what are the price levels. (Screenshot Needed)
What type of traders available in the market, explain how they work?
In trading or investing in assets, what is the importance of Support and Resistance, explain how they work?
How we can find the Support in the candle chart, explain with one of the asset Candle charts with screenshot and point the levels. (Screenshot Needed)
After finding Support, when and where we need to place a buy order, explain with a chart screenshot? (Screenshot Needed)
In this homework task, it will be good if all screenshots of the candlestick chart should be taken on your own, and as we are discussing on the Cadle chart so make sure to explain with only the candlestick chart.
Read the Subject and required topics 2-3 times make a homework task post on this same, include all topic in the post. You can add different topics but it has to be related to this subject and the information provided in this post.
IMPORTANT:- All homework posts should be posted in the Crypto-Academy community.
Greetings are done in the first topic, hence it will be good if this entire post is on this homework task.
Because of this new topic of Support and Resistance, we have added SR in a previous tag, hence add #technicalcryptosr in the first 2 tags, your country tags like #india, then you can add other tags that you want.
Post needs a minimum of 300 words, it is a minimum requirement but you can also express more in detail as much as possible.
Try to make a homework task post in your own words, because you are providing the information that you see in the charts.
Screenshots of the Candlestick Charts should be taken on your own.
Kindly submit your homework task before 21st-Feb'2021.
For any concerns, doubts, questions on this topic, you can ask me in the comment section below.
Thank You.
@stream4u
Crypto Professors : Steemit Crypto Academy
This Post and My Comments are Set For 100% Power Up.
This Post Shared On Twitter
Thank You.
@stream4u
Crypto Professors : Steemit Crypto Academy
#india
Hello. Here's my post:
https://steemit.com/hive-108451/@alegnita/crypto-academy-week-2-homework-post-for-stream4u-or-how-to-read-candlestick-charts-in-different-time-frame-and-information-about
I might say I'm doing a bit of the three types of trading, depending of the case. As a beginner one I'm trying to learn from probable mistakes I could have. But because I'm not so experienced, I must go on long to get any profit without being too much worried. 🤣 Thanks for your Post and receive my regards from Latin America 🌎 Cheers 👍🏼 #venezuela #affable
I still think that the best time to buy is when market had dipped maybe because I am a long term trader when it comes to spot trading. But for futures, I majorly work with support and resistance levels because I do scalping.
Best regards, I am leaving my Assignment 2, I will continue studying.
My link:
https://steemit.com/hive-108451/@slwzl/steemit-crypto-academy-or-course-2-by-stream4u-or-how-to-read-candlestick-charts-in-different-time-frame-and-information-about
Thank you
https://steemit.com/hive-108451/@maykit55/steemit-crypto-academy-or-course-2-by-stream4u-or-how-to-read-ckit55andlestick-charts-in-different-time-frame-and-information
Dear @stream4u,
My Submission: Homework-Topic 2
Thank You.
I am not a trader till now, but I am learning well from here and I can tell you that once I start trading I will be a short-term trader. By the way, the course was very informative and I really enjoyed it.
@stream4u,
Here is my Homework Submittion
Дорогой профессор @stream4u, спасибо за ваш подробный пост, он добавляет мне больше понимания как правильно организовать мою собственную торговлю на бирже. Восхищена вашим объяснением, все очень-очень понятно.
По поводу того, что многие в прошлой домашней работе написали,что покупать надо на нисходящем тренде... Я написала именно так, но не к привязке того, что надо ждать много времени 1-2года для лучшего времени для инвестиций, а имелось в виду именно на нисходящей вниз в точке поддержке покупать надо. И сейчас вы все четко объяснили это, спасибо большое. Мы учимся с вами и уверена, что мы сможем улучшить наши знания от ваших публикаций.
Теперь именно так я и буду делать, согласно вашего совета в этой теме. Уже понимаю, что многие ордера были поставлены мною не совсем правильно.
Да, и мне бы хотелось попросить вас, оставлять ваши краткие замечания к моему посту, если вы видите, что я не совсем правильно ответила на ваши вопросы по теме. Спасибо.
Hi @vipnata
Thank you and I am happy that you see that the information in this post is valid.
Regarding homework task, so from the experience of few homework tasks, I will suggest using the topic heading and then and then provide your details so that at the end of your post you will also come to know whether all points/topics have covered in the homework task or not before publishing(There are 7 topics).
Once you made a post, share the post link here. I will review that.
Thank You.
@stream4u
Crypto Professors : Steemit Crypto Academy
#india #affable
my entry, please @stream4u :
hive-108451/@vipnata/homework-task-2-ii-how-to-read-candlestick-charts-in-different-time-frame-and-information-about-buy-sell-support-and-resistance
Really I totally agree with you that the best time to buy is at the support level because of the uncertainty of the the point of resistance. For me @davchi all my tradings dated has been on a short term, not more than 15min. Thanks for the privilege of gaining more from you @stream4u soon expect the submission of my home work.
Hi @davchi,
Thank you and I am happy that you see that the information in this post is valid.
Regarding homework task, so from the experience of few homework tasks, I will suggest using the topic heading and then and then provide your details so that at the end of your post you will also come to know whether all points/topics have covered in the homework task or not before publishing(There are 7 topics).
Thank You.
@stream4u
Crypto Professors : Steemit Crypto Academy
#india #affable
Missed the first task, but great explanations on everything! :)
Here's my fulfillment for this week's homework!