Steemit Crypto Academy Season 5 Week 1 [Beginner's Course] - Understanding Trends: @subconsciousness
A BRIEF INTRODUCTION
We met again in these trainings for the beginning of the first week of the 5th season of Steemit Crypto Academy. Thank you professor @reminiscence01 for this valuable explanation about understanding trends. You can see my homework below.
![Steemit Crypto Academy [Beginners' Level].png](https://steemitimages.com/640x0/https://cdn.steemitimages.com/DQmRBs8v6rpx7kr2Yq2eHckKH2ckFGnsmgdd76SWFuodQC3/Steemit%20Crypto%20Academy%20[Beginners'%20Level].png)

1) a) What do you understand by a Trending market?
In the crypto market, which we are in, the prices of commodities are changing. When we examine these changes on the chart, we can say that the prices in the market move by following approximately the same paths. It can also be an opportunity to predict the future direction of prices following the same path. When thinking about what a trending market means, another thing that comes to mind is to see which direction rising and falling prices tend to go.
What we know from the technical analysis is that price changes usually allow a certain direction to be in the direction of the momentum. In fact, to put it briefly, the direction of the price of a followed cryptocurrency over a period of time is called its trend.
In the cryptocurrency market, the most important factor in trend is the trend of Bitcoin. The market is shaped by the price movements of BTC. The trend of the market is very important and should be followed for those who want to make a profit or do not want to make a loss.
There are basically 3 trends in the market. It is called an uptrend, a downtrend, and a sideways trend. We can also call the sideways trend as a ranging phase. These trends should be well analyzed because there is one more thing as important as the trend. How long will this trend continue?
.png)
1) b) What is a bullish and a bearish trend? (screenshot required)
We hear these terms a lot, so for a little bit of information, let me explain why these names are given as far as I know. Bulls are known to lift everything with their horns when attacking. Bears, on the other hand, neutralize their prey by catching it and dropping it to the ground. They got these names because the direction of prices in the market is identified with these movements.
A bullish trend is a continuous rise in the price of the commodity in the market within imaginary limits. Since the price generally moves up, the risk to the cryptocurrency holder is low. In this trend period, investors are constantly buying. The times when these trends occur are also called the bull season. In a bull market, it is when the demand for the products in the market increases. There will also be an increase in the volume of the relevant commodity.
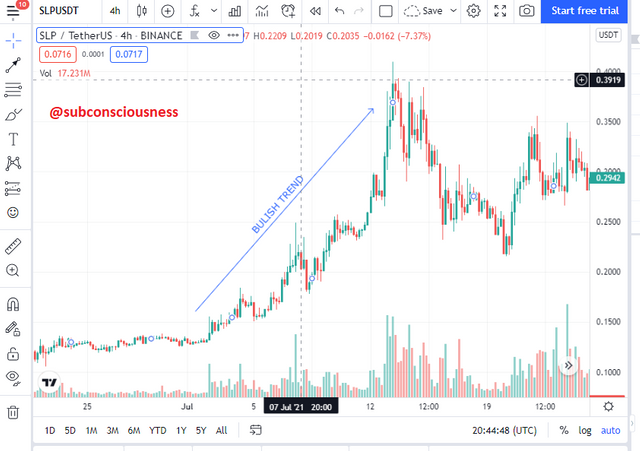 Source: SLP/USDT bullish trend on tradingview
A bear trend indicates a decrease in the market price of a commodity within imaginary limits, unlike a bull trend. A downward trend in price is a huge risk for the commodity holder. It is a period when prices are pessimistic and economic contraction is experienced.
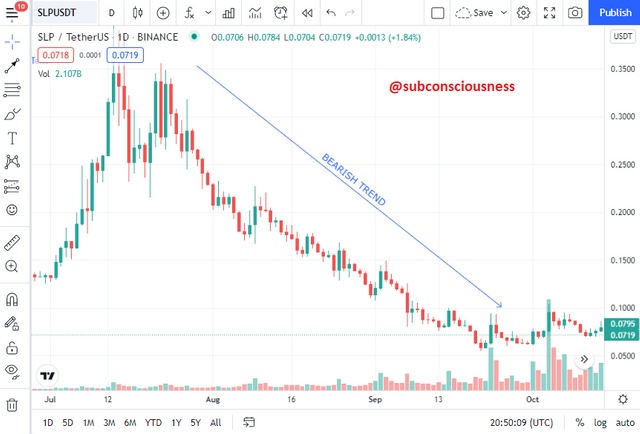 Source: SLP/USDT bearish trend on tradingview
2) Explain the following trend identification and give an example of each of them. (Original screenshot needed from your chart). Do this for a bullish and a bearish trend.
i) Market Structure.
Market structure gives us general information about the state of the market. It will be better understood when examined in detail on the graph. Market structure can tell us whether the market is rising or falling, or in a phase of change between the two.
If we follow the market structure over Bullish Trend. We will see higher-high and higher-low formations. This means that the price is gradually increasing. In other words, it means that the price did not trade below the previous low and also closed above the previous high. Thanks to this formation, the market always aims to go up. As this pattern is formed, each rise becomes a selling opportunity and each fall becomes a buying opportunity.
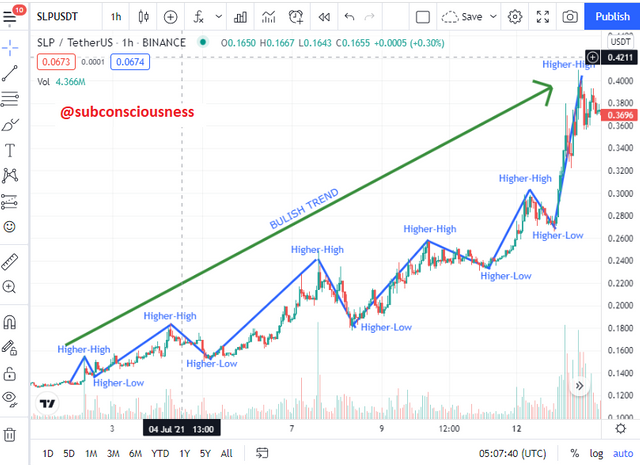 Source: Bullish Trend on SLP/USDT
If we follow the market structure over Bearish Trend. We will see lower high and a lower low patterns. This means that the price is gradually decreasing. In other words, it means that the price did not close above the previous high. Thanks to this formation, the market is on a continuous decline target. As this pattern is formed, every downtrend becomes a buying opportunity and every uptrend becomes a sell opportunity.
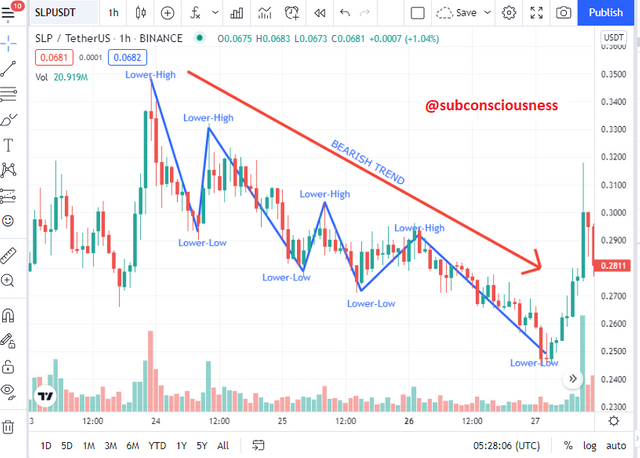 Source: Bearish Trend on SLP/USDT
Market structure sometimes does not happen in downtrends or uptrends. moves horizontally. We can call it the Ranging Market. This means that it rises and falls at support and resistance points. This usually happens before ascension, and there are often times when whales collect goods from small traders. We can show this in graphs as follows.
 Source: Ranging market on SLP/USDT
ii) Trendlines
One of the tools we frequently use in technical analysis is to draw Trend Line. Trend lines are of great importance in determining the direction of the market. We can simply say: For an uptrend, we can combine the 2 low points and consider their extension. Or, for the downtrend, you can combine the 2 high points and take a position according to the extension of the line.
In a commodity that is in an uptrend and whose line is drawn, when the price touches the trend line, it finds support and goes up. For those who buy and sell in the relevant commodity, it is one of the tools that can make the trade profit. Unless the trendline is broken to the downside, the price will constantly bounce and push itself up. When the trend line is broken, it is time to exit the position.
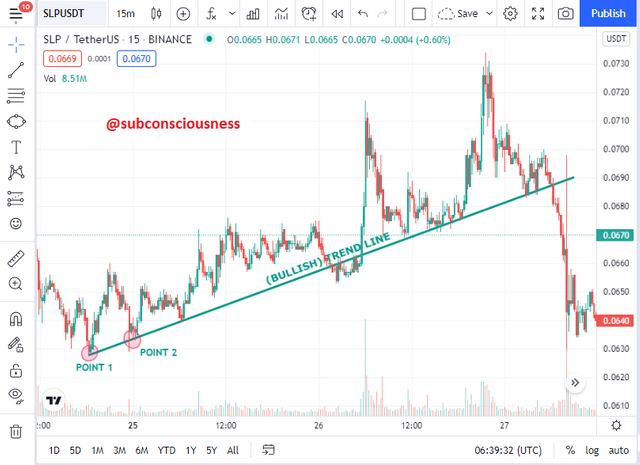 Source: Bullish Trend Line on SLP/USDT
In a commodity that is in a downtrend and whose line is drawn, when the price touches the trend line, it encounters resistance and goes down. For those who buy and sell in the relevant commodity, it is one of the tools that can make the trade profit. As long as the trend line is not broken to the upside, the price will keep coming back and leaving itself down. When the trend line is broken, it can mean a rise and the position can be entered by providing the necessary controls with other technical analysis tools.
 Source: Bearish Trend Line on SLP/USDT
3) Explain trend continuation and how to spot them using market structure and trendlines. (Screenshot needed). Do this for both bullish and bearish trends.
When we think of a trending market, the price must fluctuate and touch the trendline for a trend to occur. In this way, up and down repetitions occur. As long as the trend continues, there will be those who take profits and exit, and there will be those who enter a new position when the price is low. In this way, the continuity of the trend is ensured. There are two important points in both a bull trend and a bear trend.
Bullish trend:
- New high must be higher than previous high.
- New low must be higher than previous low.
Bearish trend:
- New high must be lower than previous high.
- New low must be lower than previous low.
In other words, while the resistances are repeatedly tested and broken in the bullish trend, the supports are broken by being tested again in the bearish trend. If these clauses are violated, it means that the trend is weakening and the trend may tend to change direction. In this case, double top or double bottom formations can be mentioned.
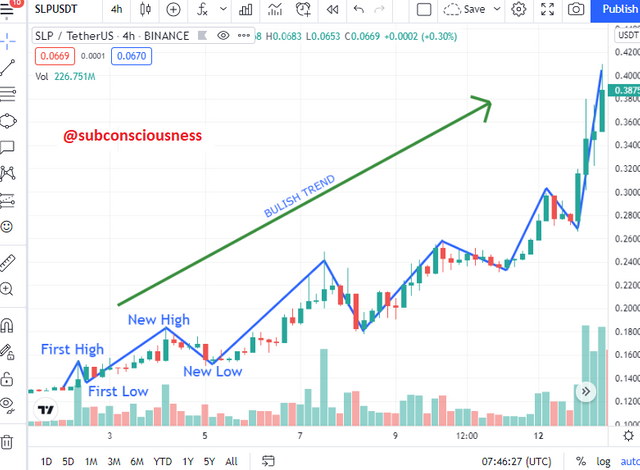 Source: Bullish Trend Continuation on SLP/USDT
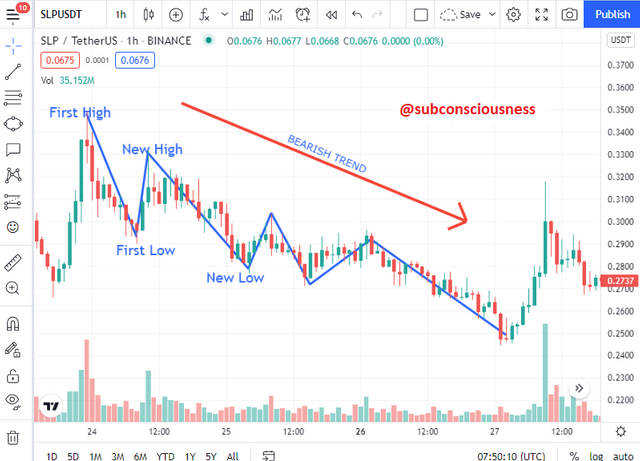 Source: Bearish Trend Continuation on SLP/USDT
While this is the case in terms of Market Structure, the situation in terms of Trend Lines is as follows. Spotting Trend Continuation is valid if the trend line is not broken. If there is a breach that crosses the trendline, it could signal a reversal. Again, in the examples below, it can be seen for both the bull and the bear.
 Source: Bearish Trend Continuation using Trendlines on SLP/USDT
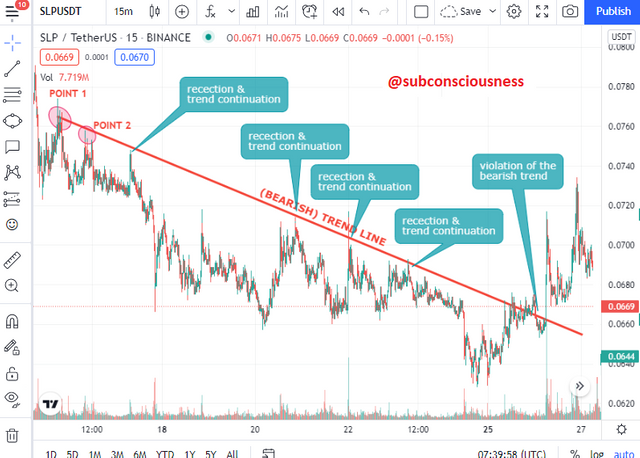 Source: Bearish Trend Continuation using Trendlines on SLP/USDT
4) Pick up any crypto-asset chart and answer the following questions.
i) Is the market trending?
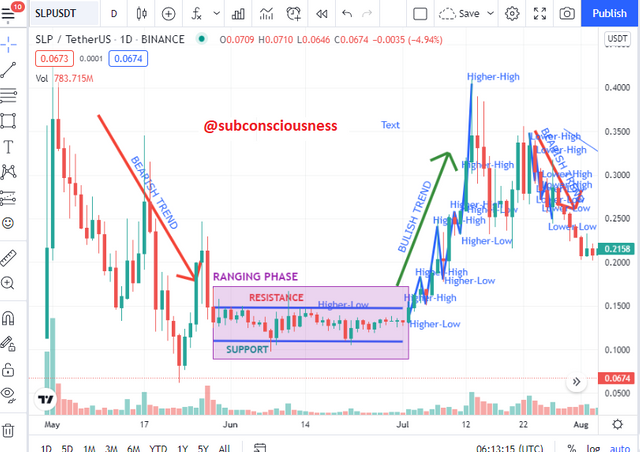
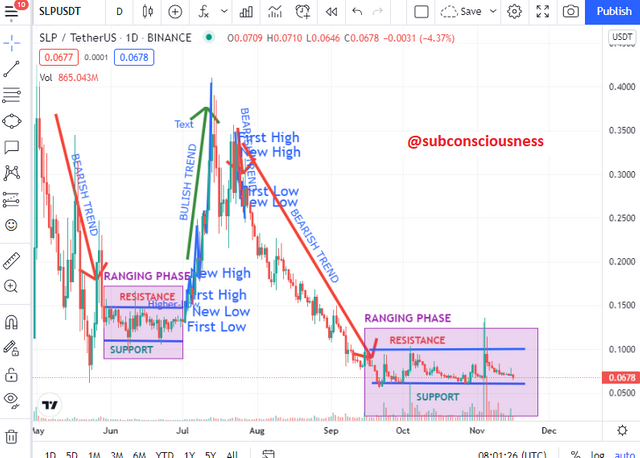
If we choose the SLPUSDT crypto pair. When we get the chart to the daily candle. At the beginning of October, we can see the bearish trend breaking. As of today, it is not in any uptrend or downtrend, it draws a zig-zag between support and resistance in a horizontal position. So there is no trend in the market we chose.
ii) What is the current market trend? (Use the chart to back up your answers).
As we briefly mentioned above and as seen in the graphic below, there is no current trend. Our crypto asset is now visible in Ranging Phase. Although it made a voluminous rise at the beginning of November, it could not stay above the resistance value. and again falling towards the support point. There is a high probability that this is the bottom point. Now it seems that in this commodity, the whales are picking up the holdings of the small investor who has made a loss or is tired of waiting. However, one should not make a decision only with trend analysis. Different technical analysis should also be used to enter a position.
 Source: Identifying the Current Trend on SLP/USDT
5) Conclusion.
Understanding Trends is a very important aspect in all trading environments, not just in the cryptocurrency market. As small investors, we must follow these trends and be aware of them. According to the general trend of the market, the movements of the traded cryptos in the market should be examined in detail, and the position should be entered or exited. It is never necessary to use only one technical analysis tool, it should always be traded after the signal received from a tool is verified with other tools. After this detailed training we received and the homework we prepared, I think we can well detect when the market is in a bullish, bearish trend or ranging phase.
Cc:
@reminiscence01
All screenshots are taken from www.tradingview.com None of the charts or information I have included here are investment advice. They are amateurish assignments that I prepared for educational purposes only. Thus, we have come to the end of our homework by answering all the questions. Thanks in advance for the review, professor.

Thanks for your visit.
💪💪💪Being a member of #club100 has privileged rights.💪💪💪
🙋♂👇Stay Tuned for my Next Post & Stay Well...🙏


Hello @subconsciousness, I’m glad you participated in the 1st week Season 5 of the Beginner’s class at the Steemit Crypto Academy. Your grades in this task are as follows:
Observations:
That's correct. Trendlines serves as dynamic support and resistance for trend continuation.
Recommendation / Feedback:
Thank you for participating in this homework task.
Thank you, professor.😇
I like this post it is so simple that is easier to understand,
I am glad that it was understandable, I put a lot of effort into making it, it is pleasing that their feedback is good.
Thanks for your comment.😇