Altcoins Dominance and Market Trends: A Deep Dive

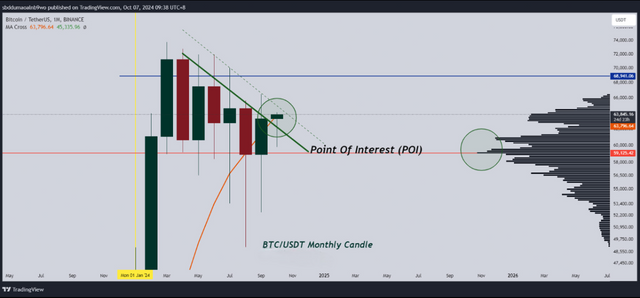
POI (Point of Interest) has been broken
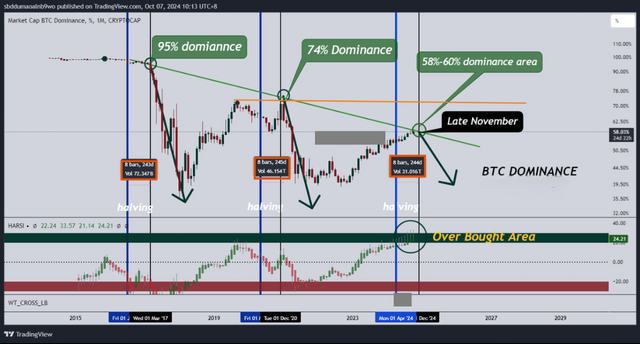
Altcoins Dominance Chart
I'm still betting on a significant move by late November, around +245 days post-halving. Since the approval of the ETF last January, we’ve seen a sharp rise in altcoin dominance, hitting the 58% level—something we expected.
But a dominance level of 60%+? Honestly, let’s hope it doesn’t go that high!
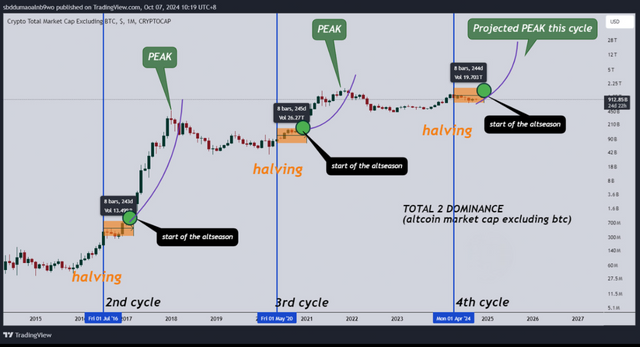
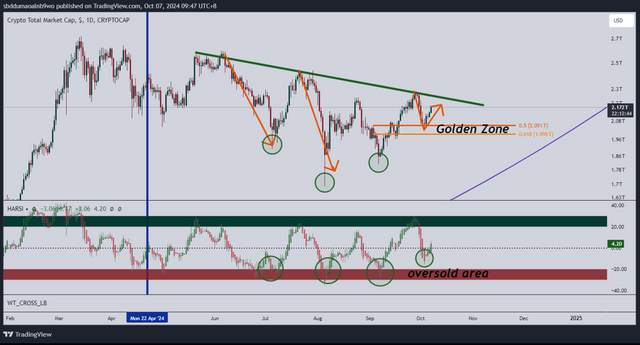
Altcoins Marketcap
The narrative around 245 days after the halving remains strong, and I’m sticking with it for now. The market looks healthy, and Dollar-Cost Averaging (DCA) is still the best strategy—there’s nothing better. Remember, if you can’t HOLD, you won’t be rich! So, HOLD tight! 🚀💎
Market Resistance and Correction
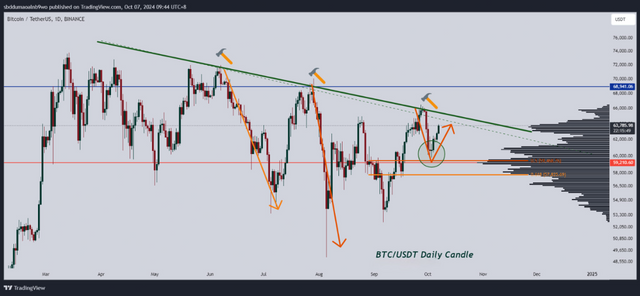
We’re seeing a downsloping resistance at the green line on the chart. Big players are hesitant to buy in that area, which has led to multiple rejections in the past. It’s really that simple—the market psychology at play.
A healthy correction is likely, giving institutions and whales a chance to accumulate at a lower, more attractive price. This shakeout is a way to weed out the weak hands before they dive back in.
Fortunately, during the last correction, buyers stepped in early, and the drop wasn’t as severe. It didn’t even hit oversold levels like in previous corrections. That’s a positive sign of strength.
Pic 3: Bitcoin Daily Chart
Pic 4: Total Crypto Marketcap Chart
Unfortunately, Bitcoin dominance is still at the 58% level. In my opinion, the recovery in altcoins has been too slow—it feels restrained. Anything below the green line remains a 50/50 chance, meaning we’re still in a consolidation phase.
Stay cautious, but keep an eye on the charts. This market is all about patience and smart moves!