Topdown Analysis Of DOGEUSDT Using Support And Resistance Strategy And RSI Indicator As A Confluence
Hello great minds,
It is another great day and I feel honored to come before you all today to share my analysis on Dogeusdt.
I believe you are doing perfectly fine and are enjoying your activities in the community as you actively promote steemit across various social media platform.
Doge coin is not an unpopular cryptocurrency in the cryptospace, it is known to be a meme coin influenced by Elon musk.
I decided to take an analysis on Doge coin today, please tag along.
ANALYSIS USING SUPPORT AND RESISTANCE STRATEGY
My analysis using support and resistance strategy often start from the higher timeframe to the lower timeframe.
On the higher timeframe, my aim is to detect the overall market trend, to check if the market is bearish or bullish overall, as this will play a crucial role in affecting my trading decisions.
And also the monthly timeframe, filters out noise from the chart and this will enable traders to make a more informed trading decision.
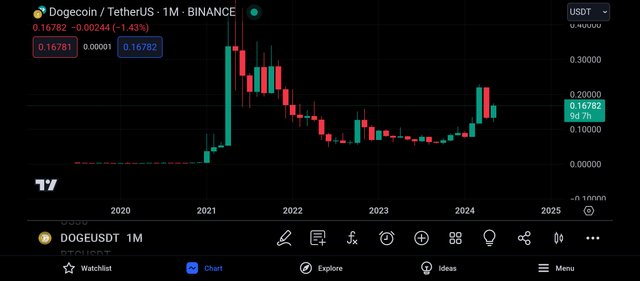
The above screenshot is that of dogeusdt on the monthly timeframe and as seen above there is the formation of bullish and bearish candles.
Also, we can see that there are lesser candles on this timeframe, and it is easier for the market trend to be identified.
And from the above screenshot, we can say that overall the market is still bearish although it's latest leg is being bullish.
And there are lesser noise on this timeframe which makes analysis here easier.
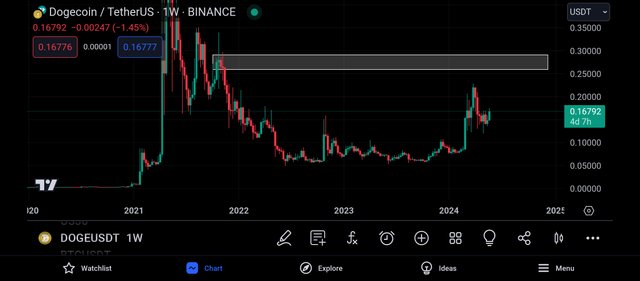
Moving to the weekly timeframe, I could see more market activities, I could see more market candles, and this is because each candle was formed within the time period of 1week.
On this timeframe, I was able to spot a key level, a strong level which is functioning as a resistance level to the market price.
And it is expected that whenever the market gets to this level, it gets rejected to the downside, and from the above screenshot, we can see that the market is gradually approaching the resistance level.
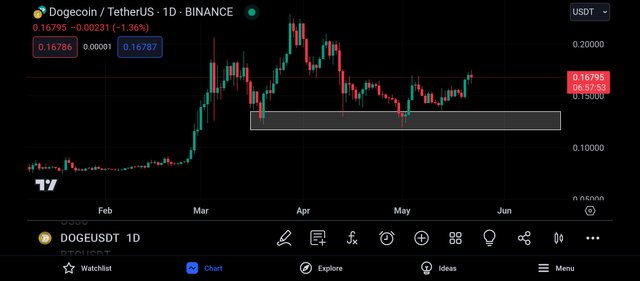
Getting to the daily timeframe, I saw more market activities as expected.
I could see the buyers and sellers struggle to drive price to their preferred direction.
And from this timeframe, I was able to spot a key level which will be functioning as a support level to the market price.
And this level can be said to be a valid level as the market has made several touches on this level and has not been able to break below this level.
It is expected for the market to be rejected again when it trades towards this support level.
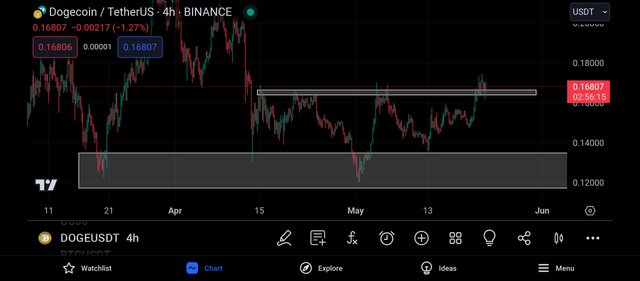
Continuing my analysis on the 4hr timeframe, I could see lots of noise in the market as the struggle between bulls and bears becomes stronger.
Also on this timeframe, I was able to detect a valid resistance level which has recently been broken, and now it is functioning as a support level to the market price.
As expected, the market has retraced to retest this broken level and upon the formation of a bullish candle, I can take my entry into the market.
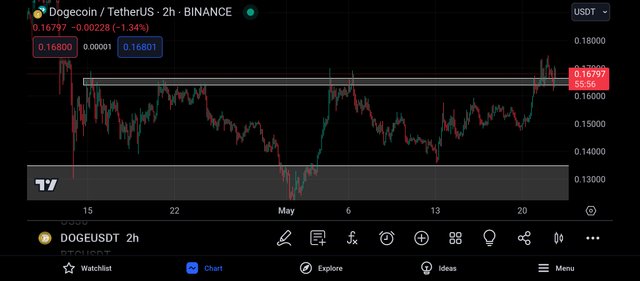
Getting to the 2hr timeframe, I could see the market price more clearly.
And I could see that the market has retested this broken level, and has been rejected already, which gives me a bulllish bias of the market.
And then I decided to add my rsi indicator as a confluence to my trade.
CONFLUENCE USING RELATIVE STRENGTH INDEX INDICATOR
The rsi indicator is a very important technical tool that is used in analysing the cryptomarket.
This Indicator is used to detect overbought and oversold market regions and this inturn influences my trading decisions.
When the market is overbought, it is a bearish trend reversal signal and when the market is oversold, it is a bullish trend reversal signal.
I then decided to apply this Indicator to the monthly timeframe first, before other timeframes.
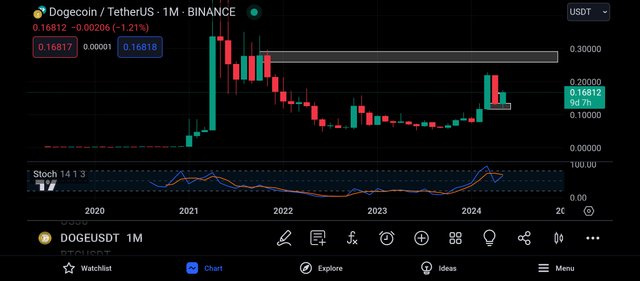
I then applied the rsi to the monthly timeframe for my analysis.
And from the above screenshot, we can see that the rsi has crossed above its 80% line, and this is an indication that the market is about to be bearish.
Whenever the rsi crosses above its 80% level, the market can be said to be overbought and an overbought market signals a bearish trend reversal.
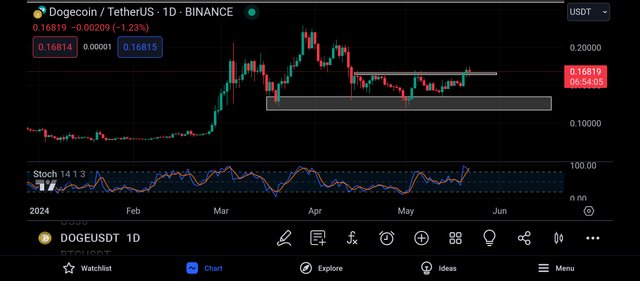
Applying the rsi to the daily timeframe, I noticed that the rsi has approached it's 80% line and as said earlier, this is a bearish trend reversal signal.
Whenever the market becomes overbought, it is expected to be sold, and this is an indication of the bears trying to take control of the market.
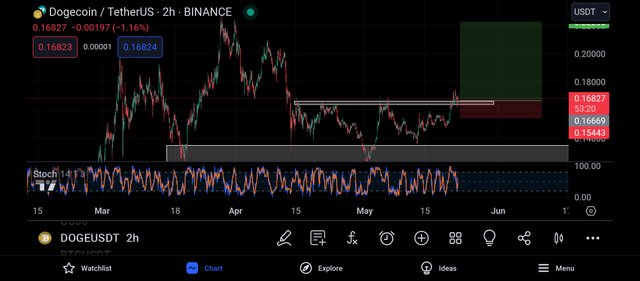
Finally getting to the 2hr timeframe, I noticed that the market has approached it's 20% line, and this is an indication that the market is being oversold.
An oversold market is one signaling a bullish trend reversal, that is the change in power from the bears to the bulls.
And with this, I placed my buy order on the closest support level to the market and my take profit was was placed on the market's closest resistance level, just as seen above.
CONCLUSION
Doge coin is a token with good fundamental, and this can be confirmed from its historical activities.
I have shared my analysis on Dogeusdt, and I don't want it to be taken as a financial advise.
Thank you all for reading my post.
https://x.com/JuecoYoung/status/1793373623077753274
Upvoted! Thank you for supporting witness @jswit.