Know more about Keltner Channels indicator and it's calculation
My friends, its another day to learn something new and today I want to share with all a very unique and important indicator which over time has proven to be very effective for me as a trader. Often, I go around looking for technical indicators that will help me minimise losses and maximise my profit when I apply them on a chart.
Background image Edited on Canvas
When I come in contact with such indicators, I don't just learnt their usage and application on a chart inside I go extra mile to read about their history and the calculation behind their formation and the case of the Keltner Channels indicator is not different.
This means that in this article today, we are going to look at the history of the Keltner Channels indicator and then we look at the arithmetic calculation which the indicators used and possibly an example to show how the formula works. Stay tuned as we go on this journey together.

| History of Keltner Channels indicator |
|---|
The Keltner Channels indicator is a trend based indicator which was introduced as far back as 1960 by Chester Keltner. He named it after his name. This indicator came to limelight when he published one of his books during that period and he titled this book "How To Make Money in Commodities".
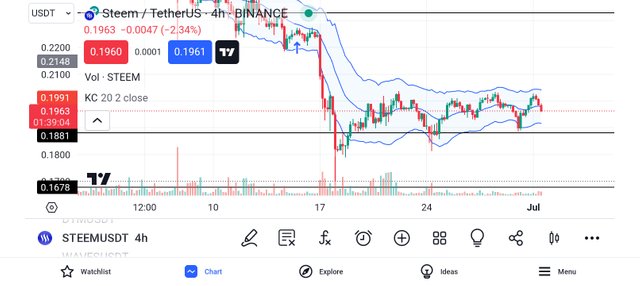
The design of this indicator is done such that it has a moving avearage line in a channel where there is an upper band land and a lower band line with the moving average line in the middle and that is where the channel was added to the name to give it the name Keltner Channels indicator.
As time goes on, there were some lapses in the indicator which needed to be solved to enable the indicator to give a more suitable result but it wasn't possible for Chester Keltner to fix it because he was running out of age and that lapses remind there and the complexity of the indicator and it calculation made a lot of people not to use it.
In 1980s, Linda Raschke revised the technicalities associated with the indicator and made the calculation less difficult by bringing out a few parameters and coming up with a more simpler formula to solve the mathematical issues associated with the Keltner Channels indicator problems. In her simplification, she listed a few components needed for the calculation and they include;
EMA which is the exponential moving average line
ATR which is the average true range (upper and lower band line)
ATR multiple by 2 ( distance from MA to either the upper band or lower band line)
| Formula to calculate the Keltner Channels indicator |
|---|
To calculate the Keltner Channels problems, you have to follow the steps below.
Calculate the EMA
EMA = (Price x (2 / (Length + 1))) + (Previous EMA x (1 - (2 / (Length + 1))))
Where;
Price is the current price of the asset as at when performing the calculation.
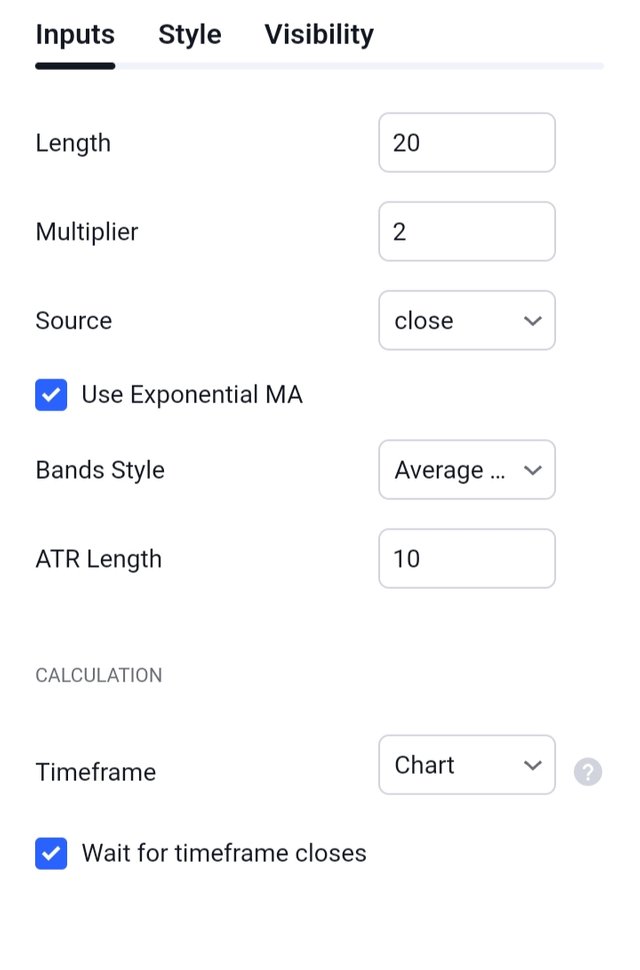
Length is the period of the EMA which is always 20 by default. (You can adjust it to suit your trading pattern)
Previous EMA is the value of the previous EMA. It will be given to you always.
Calculate the ATR
ATR = [(High - Low) + (High - Previous Close) + (Low - Previous Close)] / 3
Where;
High is the current high of the prices of the asset
Low is the current low of the prices of the asset
Previous close is the previous closing price of the asset
Calculate the Upper Channel
Upper Channel = EMA + (ATR x Factor)
Where;
Factor is the multiplier in the indicator and it is usually 2 in value.
Calculate the Lower Channel
Lower Channel = EMA - (ATR x Factor)
 |  |
|---|
| Example problems on calculation of the Keltner Channels indicator. |
|---|
In a chart where you the price of the asset is 200, previous EMA is given to be 210 and the ATR is given to be 10. Calculate the upper channel and the lower channel in the chart.
Solution
Given
Price = 200
EMA = 210
ATR = 10
Length = ? (20 by default)
Factor = ? (2 by default)
In cases where the Length and the factor is not given in the question, it is recommended you make use of the default values which is 20 and 2 respectively. So let's use the upper channel and the lower channel formula to calculate the Keltner Channels indicator.
Upper Channel = EMA + (ATR x Factor)
Where;
EMA = 210 (previous EMA)
ATR = 10
Factor = 2
Putting the values in the formula will result to
Upper channel = 210 + (10 * 2)
Upper channel = 210 + 20
Upper channel = 230
Lower Channel = EMA - (ATR x Factor)
Where;
EMA = 210 (previous EMA)
ATR = 10
Factor = 2
Putting the values in the formula will result to
Lower Channel = 210 - (10 * 2)
Lower Channel = 210 - 20
Lower channel = 190
So if the previous EMA on a Keltner Channels indicator is 210, the upper and the lower channel of the indicator will be 230 and 190 respectively.
Keltner Channels indicator is trend based indicator which is made up of a moving average line and also an upper band and lower band line which makes up a channel. The length and the factor of the indicator are defaultly 20 and 2 respectively but these can be adjusted to suit the traders strategy and pattern of trade.
Calculating the Keltner Channels indicator requires the calculation of the upper and the lower channel respectively. Your EMA will always be given but if not given then you can use the formula we have above to get it.
When the price is above the upper channel, it means a very strong uptrend in the market and if it is below the lower channel it indicates a very strong downtrend. Also when the price is at the center with the moving average it indicates a range movement in the market.
Finally, I want to thank you all for reading through my post today. If you have any questions or contributions, please do well to use the comment section of this post. See you all in my next publication.
Disclaimer: This post is made as an education and not investment advice. Digital asset prices are subject to change. All forms of crypto investment have a high risk. I am not a financial advisor, before jumping to any conclusions in this matter please do your research and consult a financial advisor.
NB: All images except otherwise stated are mine and taken from the TradingView website.
https://x.com/xavierf14044615/status/1807788630078873710?t=qmf9gXhATrPjhUiM8mOTag&s=19
Note:- ✅
Regards,
@theentertainer