SEC | S20W4 | Google Sheets features and functionality (Creating Forms & Sheets)

I understand Google Sheets as a worksheet that is operated online, This Google product provides services that help users in compiling reports, editing, and sharing files online to other users according to the authority given. Users can run it together, in real time according to their needs.
Below I will show some features of Google sheet.
| 1. Real-time collaboration |
|---|
The online-based working principle of Google Sheets makes it easy for users to get real-time data updates, every account that has an access link to the account will be able to see updates and can also make edits if they have the authority. Usually authority is obtained when the owner of the link provider gives access permission in the form of editing, or just as a viewer.
I will give an example on the worksheet below with two different Google accounts, pay attention to the two sides shown below, when the owner account has completed the data changes and is entered, the worksheet will change its appearance.
| 2. Sharing files |
|---|
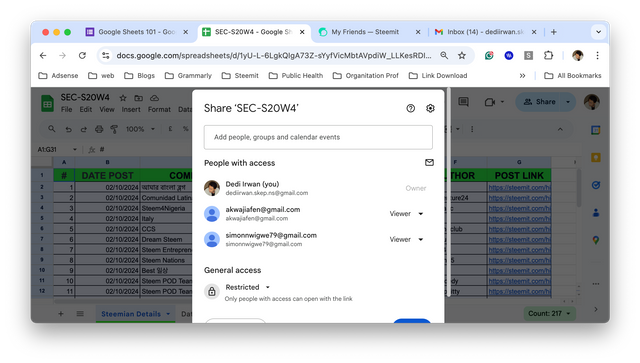
Another advantage of Google Sheet is that it makes it easy for users to share files, you can set users who have access to links from the worksheet by adding emails from other users, then you can also take advantage of other sharing features by making settings: share ⮕ anyone with the link ⮕ editor, viewer or comment.
Pay attention to the practical example in gif format
| 3. Creating Graphs |
|---|
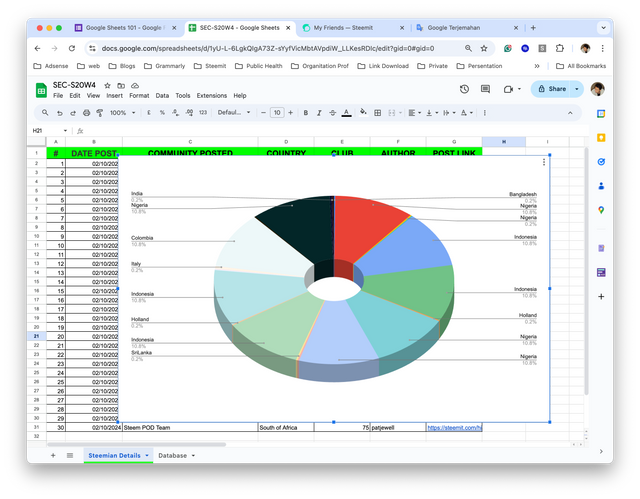
Like excel, google sheet also provides facilities in processing data into graphs or any data needed, pay attention to the display below, I display data from several steemit users randomly, give scores, then display them in the form of bar graphs and donut diagrams.
| 4. Conditional Formatting |
|---|
This function makes it easy for users to determine data according to the specified classification, I will give an example of its use below.
From the gif file below I show that for a value of 90 it will be labeled green, a value of 60 is labeled red. For the guide as follows:
- Prepare the data to be used
- Block the data to be conditionally formatted
- Right-click select Conditional Formatting, if it does not appear in the submenu, select view more cell action
- Select single color or color scale. I give an example in the form of single color.
- In the rule format select text contains, enter the formula in the form of numbers, for example 90. in the format style section select the color you want.
- Add other coloring formats according to the value you want.
The system will change the label color according to the command you entered earlier.
| 5. Pivot Table |
|---|
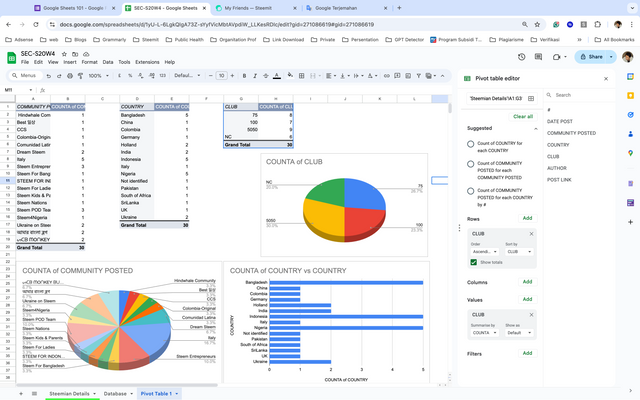
This function will make it easier for users to summarize a large number of worksheets, imagine if you have thousands of cells to summarize, the table privot will make it easier for you to make your work easier.
I will give an example of one of Team 1's spreadsheets that I have compiled on the end-of-week worksheet in September.
Saya hanya memberikan 5 contoh dari fitur google sheet, namun masih banyak fitur lainnya yang dapat dimanfaatkan untuk membantu memudahkan pekerjaan.
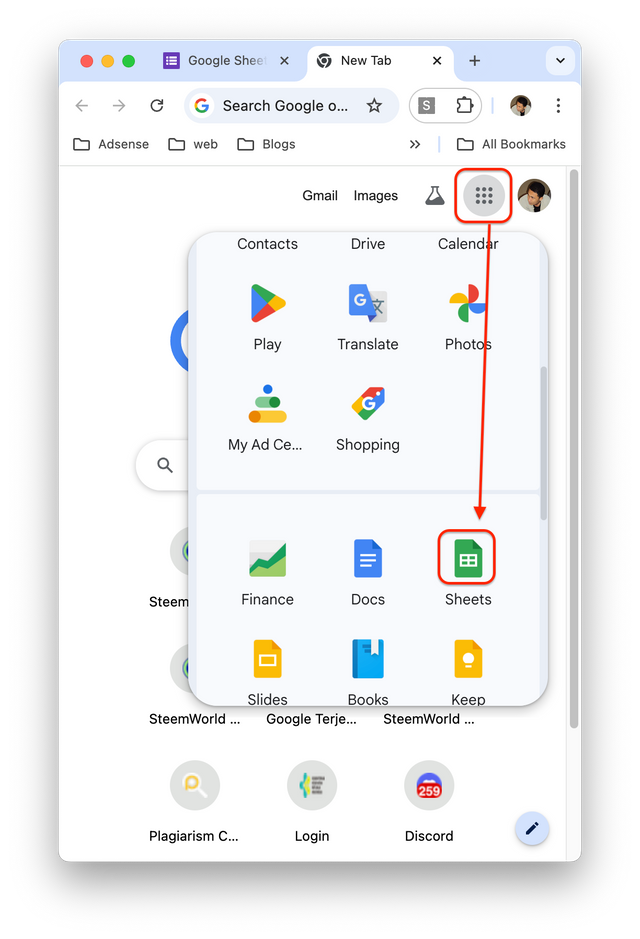
Create Form
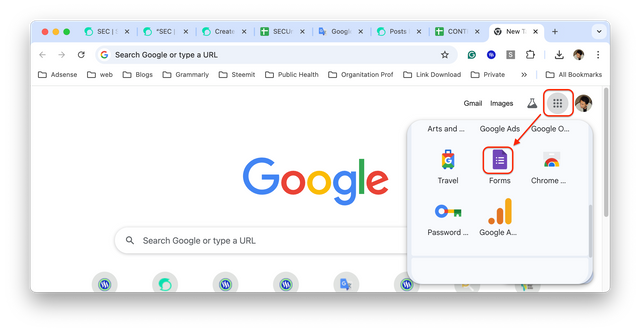
The first step in creating a form is to open the Google page, then select the Google app located next to the Google account image/icon. Scroll down and find the form application and click, then a new form sheet will appear. Pay attention to the image on the side.
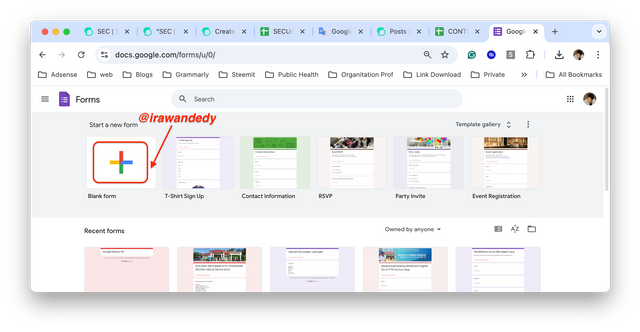
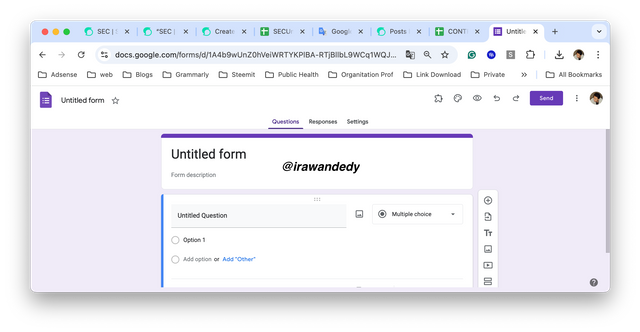
To create a new worksheet, press blank form as in figure 1 and you will see the form that you will use to design the form according to your needs as in figure 2.
 |  |
|---|---|
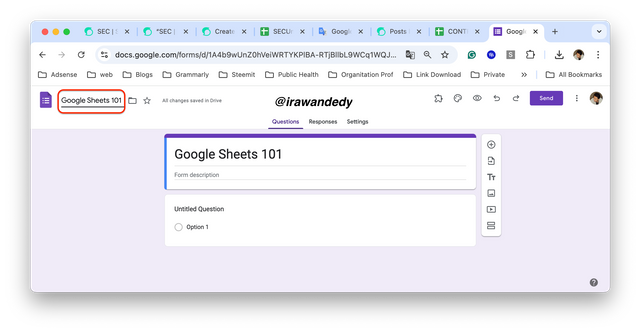
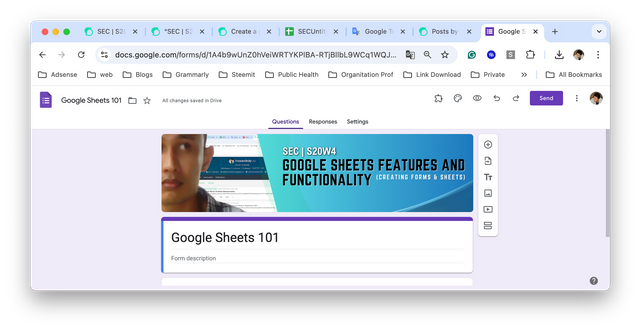
Change the name of the form sheet according to your needs, I give an example of the file name according to the instructions, namely adding the file name to Google Sheets 101
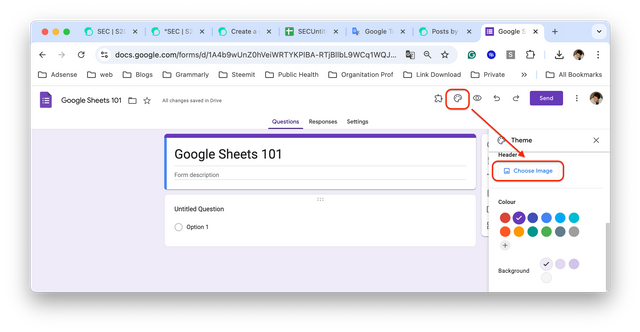
Before starting to design the form, I will create a header for the form, here's how:
- Prepare the header image to be uploaded
- Select customize theme, then choose image, follow the steps as shown in the image on the side.
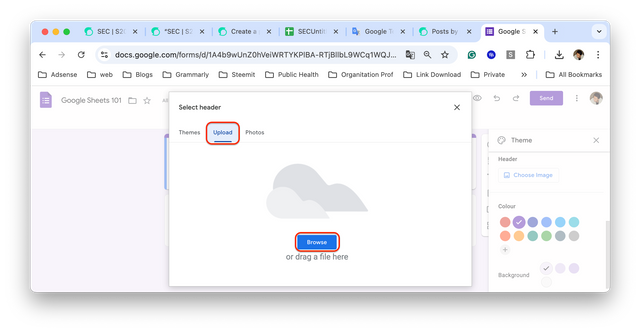
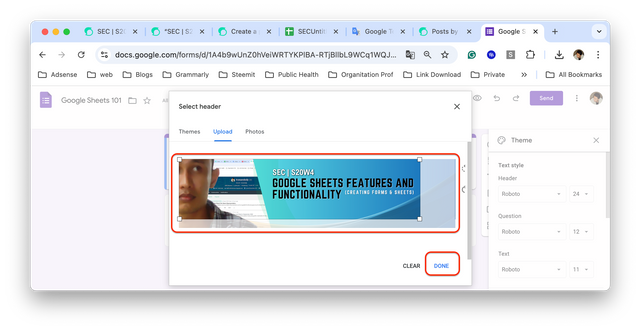
Select upload, and browse the location of the header image that has been saved on your offline or online device, or you can also use an existing header image. I'm giving an example of a header image that I have designed specifically for this topic.
 |  |
|---|
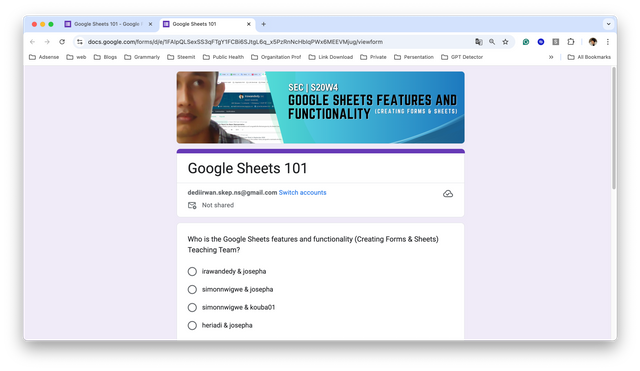
After uploading the image that has been prepared for the Google Form header, press Done and you will see the updated form header.
 |  |
|---|---|
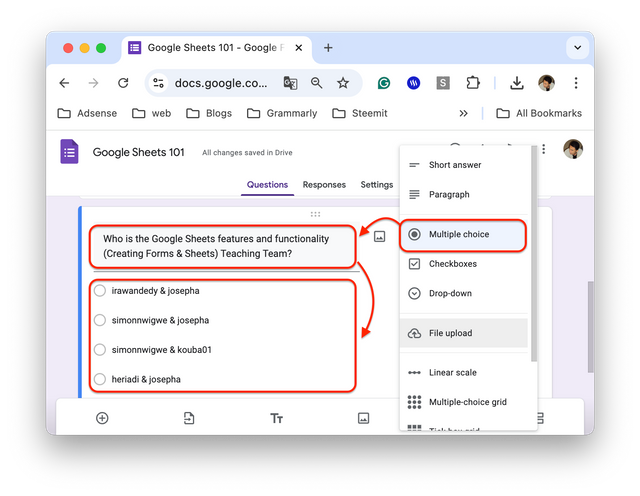
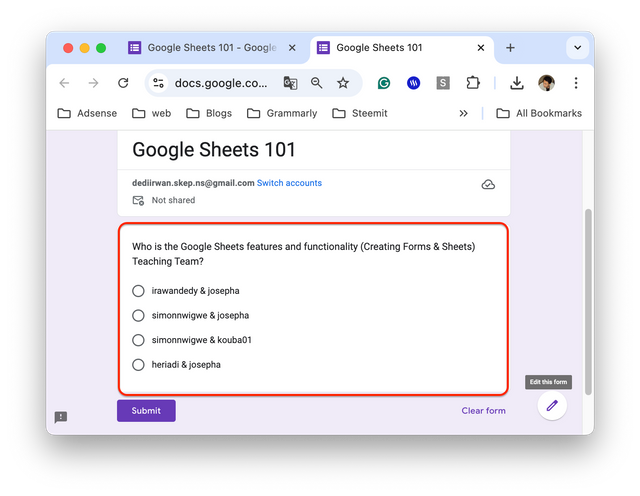
To start designing multiple choice questions, you can start by add question select multiply choice format. Then enter the question you want and determine some desired answer choices. Look at picture 1. and for the results see picture 2.
 |  |
|---|---|
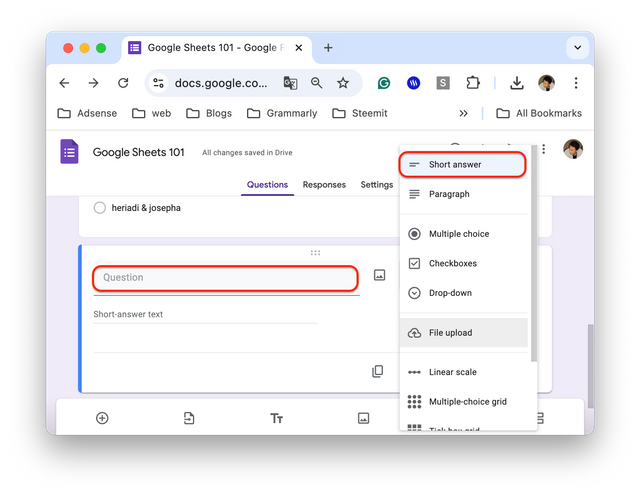
Repeat the steps as before by starting to add a new question, select the type of question you want, at this point I will give an example of `short answer, enter the question as in image 1 and pay attention to the results in image 2.
 |  |
|---|---|
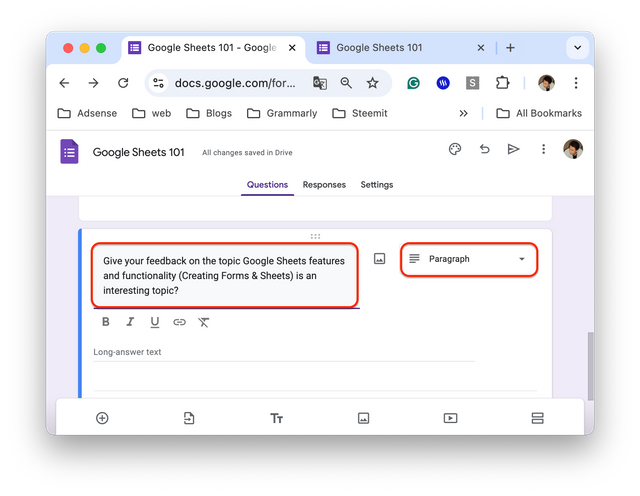
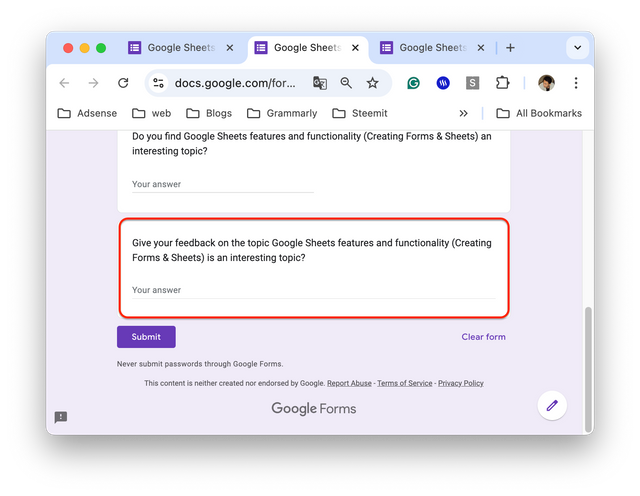
Repeat the steps as before and select the desired question model, I will give an example of a paragraph question model, pay attention to the steps in figure 1 and the results in figure 2.
 |  |
|---|---|
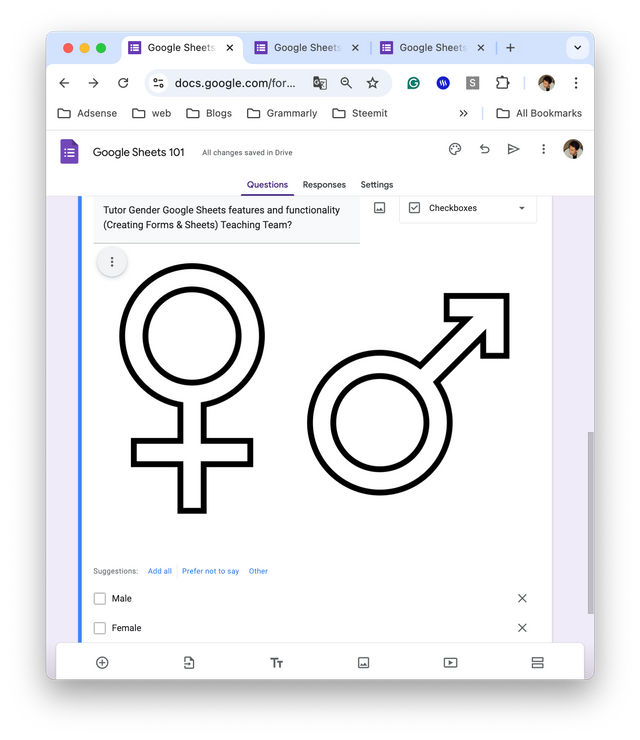
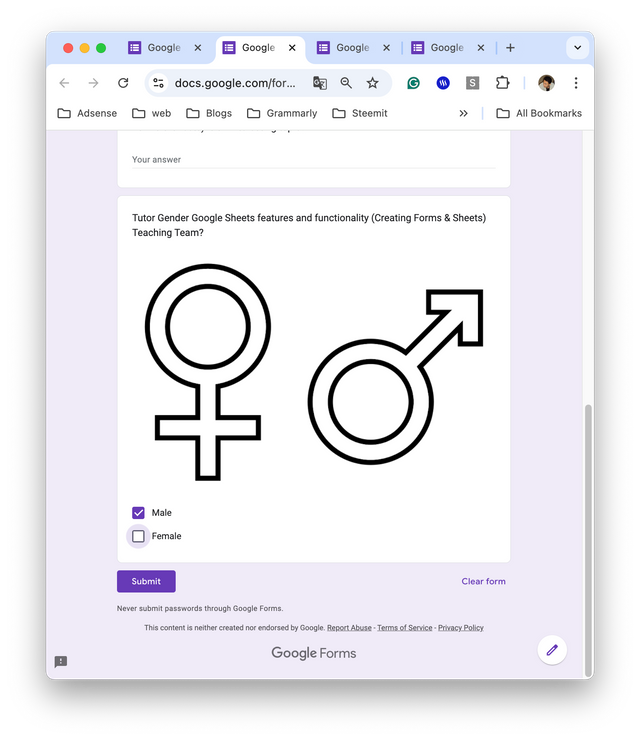
Create the next question and select the checkboxes question model, pay attention to the guide in image 1 and see the results in image 2.
 |  |
|---|---|
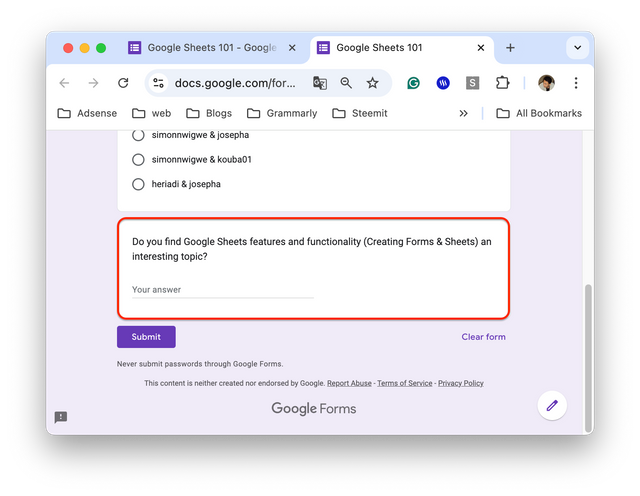
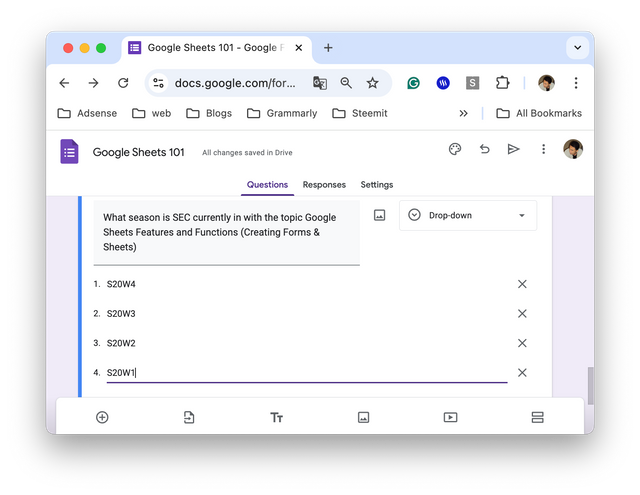
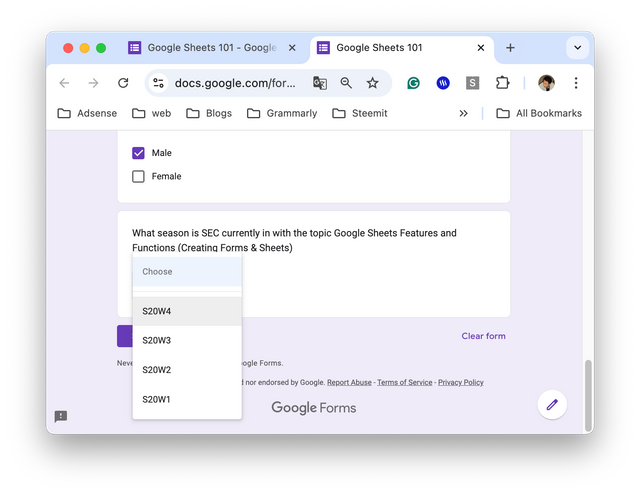
Every time you start making a new question, the steps are the same, the only difference is the choice of question model to be composed. Look at figure 1 and the results in figure 2.
 |  |
|---|---|
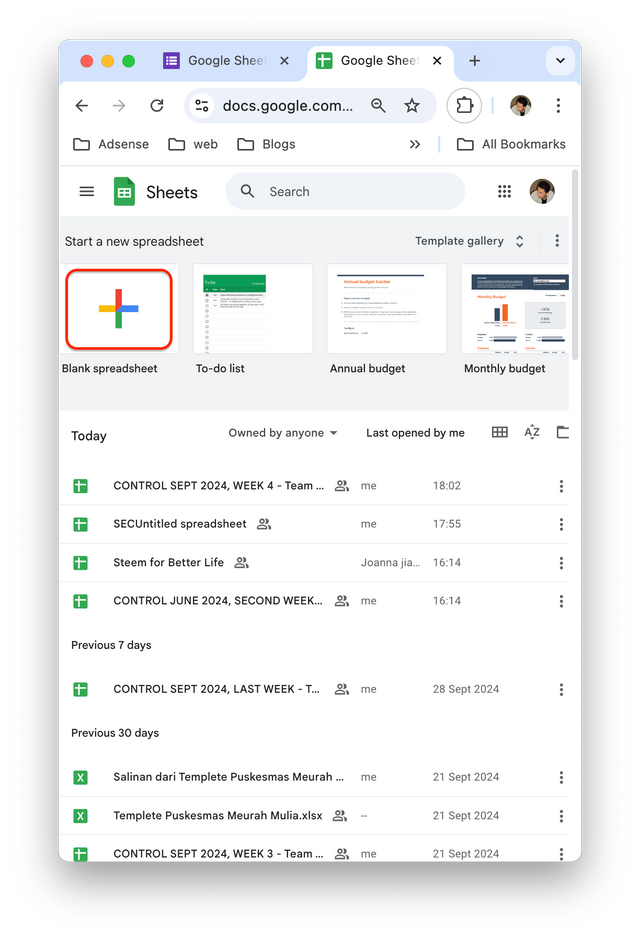
To start creating a spreadsheet, the steps that need to be taken are to open the Google page, then select the sheet as in image 1, then you will start a new sheet page by clicking the (+) sign as in the second image.
According to the instructions, this spreadsheet page is named SEC-S20W4. Then create 2 sheets with the names steemian Detail and database.
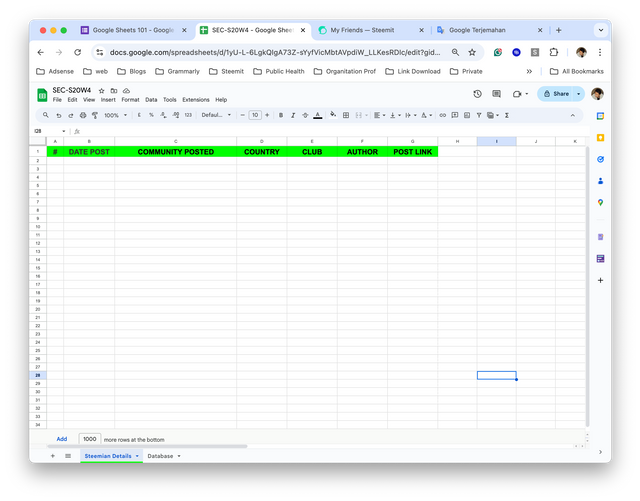
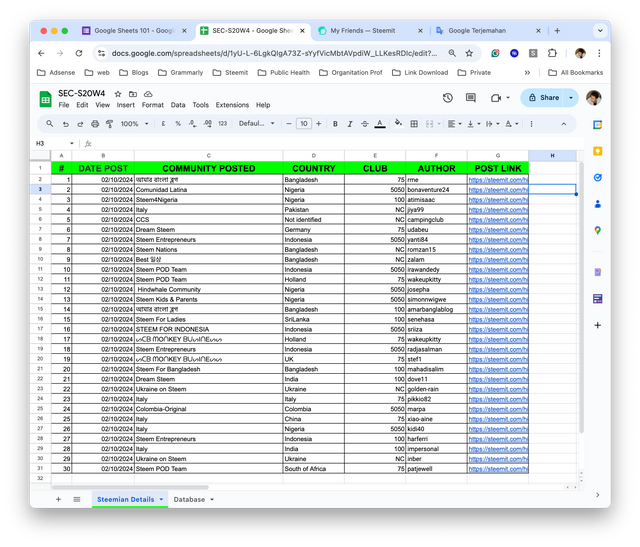
The image above shows that I have filled in row 1 containing the tasks that I have to input, including date post, Community Posted, Country, club, author and post link, each row and column that I create will contain information from 30 authors from various communities.
I will explain the application of each function from the table above in the table below:
| Author | =MID(G2,FIND("@",G2) + 1,FIND(CHAR(160),SUBSTITUTE(G2,"/",CHAR(160),5)) - 1 - (FIND("@",G2))) |
|---|---|
| Club | =INDEX(Database!$D$3:$D$32, MATCH(F2,Database!$B$3:$B$32, 0)) |
| Country | =INDEX(Database!$C$3:$C$35, MATCH(F2,Database!$B$3:$B$35, 0)) |
| Community Posted | =INDEX(Database!$G$3:$G$32, MATCH(O2,Database!$H$3:$H$32, 0)) |
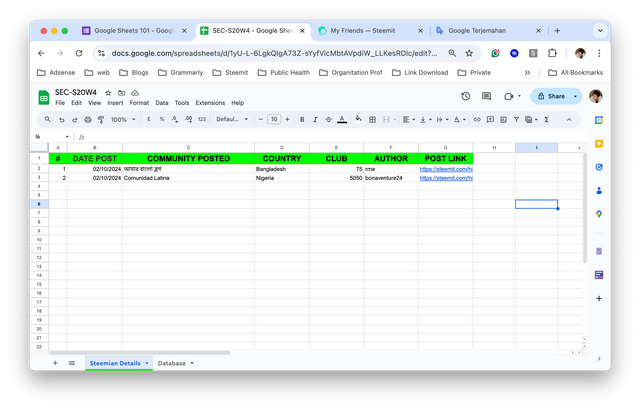
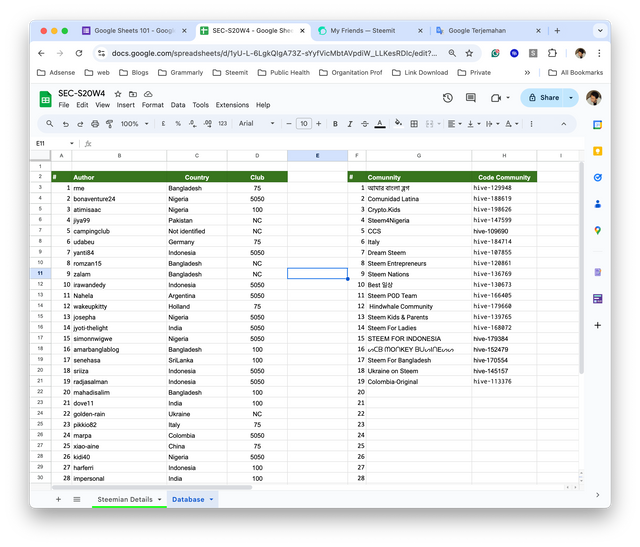
On the second sheet named Database, I input data manually, author, country and club, while the table next to it is community data. The goal is to connect the data needed on the steemian detail sheet.
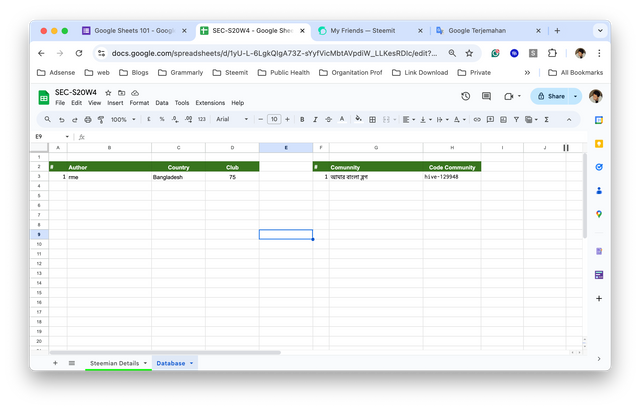
I will display two complete data which are the result of inputting post links from various communities with a total of 30 posts. For more details, see the image below.
 |  |
|---|---|
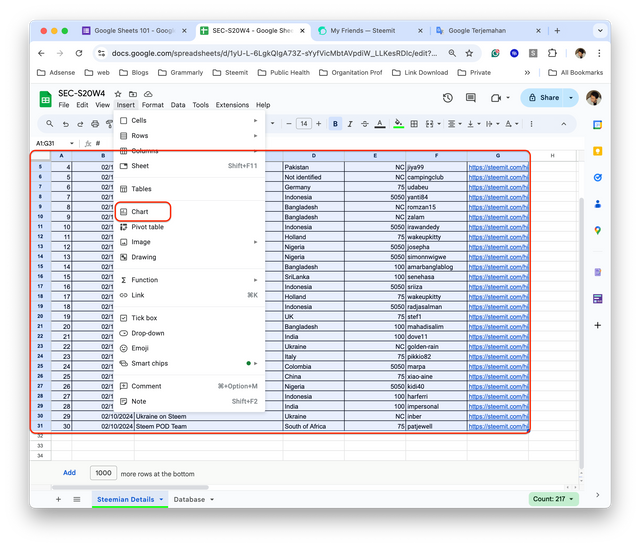
Next in the last part I will show you the guide in making bar charts, donuts. The first step is to block the list of tables that have been created, then select insert, select chart.
 |  |
|---|
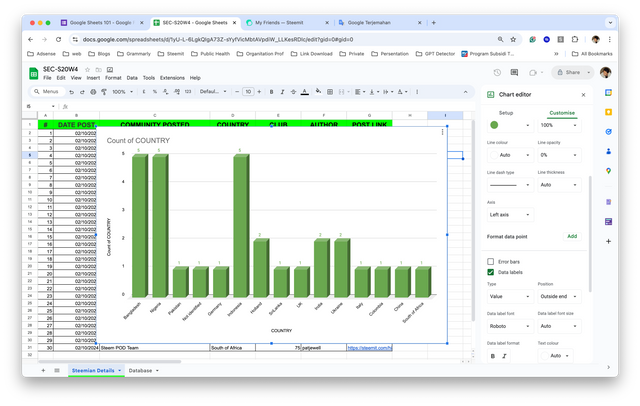
From the two charts in the form of a circle and a bar chart shows the relationship between the author and the country. However, to facilitate data filtering it would be better to use Pivot Table, pivot tables have advantages in organizing data according to needs, for example special data filters for club status, country, users and other data needed.
This is an important learning on the platform, at least every user can learn about spreadsheets and be able to apply them on this platform either as a community database, for the needs of the curation team or even for use in the work environment.
I have also provided access to the google sheet link which is a series of assignments in the two emails mentioned by the tutor.
I admit that it took quite a long time to complete this task, but with the motivation for self-development, I have completed it even though it is not perfect. Thank you for this week's material and hopefully it can be useful for all users of this platform.
Indonesia, October 2, 2024
@irawandedy
Penjelasan yang detail dan mudah untuk saya pahami. Ini dapat menjadikan ilmu pengetahuan untuk saya maupun mereka yang membacanya! Terima kasih sudah mengundang dalam tema ini😉
Ayo mas bro ikut berpartisipasi dalam topik ini, saya pikir tidak ada salahnya meluangkan sedikit waktu untuk memberikan kontribusi, anggap aja bentuk latihan
Akan kita coba jika memungkinkan untuk dilakukan tidak salah untuk segera dilakukan 😁
I invite @harferri, @azwar82 and @afrizalbinalka to participate in this topic
Why don't invite them in the post, Mister?
I forgot to do that, so decided to invite him via comments.
Is editing the post affecting the scoring?
Tidak, terkadang verifikator saat melakukan pemeriksaan plagiarisme menggunakan tool akan terindikasi plagiasi meskipun itu link postingan yang sama.
Jadi sebaiknya saya hindari mengedit, walaupun kemungkinan yang saya sebutkan diatas sangat kecil.
Waduh, saya sangat sering mengedit, mungkin karena itu banyak yang berlalat aritikel saya. Hahaha. Oke terimakasih Bang. Saya harap peripikator lain juga menyadari kemungkinan itu seperti Abang irawandedy pahami. Saya pernah dituduh teks saya dibuat AI, padahal saya cuma menterjemahkan via AI. Kapok. Hahaha.
Pada dasarnya akan lebih baik menggunakan bahasa nasional daripada menggunakan tool terjemahan atau perbaikan grammar.
Keunikan dan keanekaragaman platform ini justru terletak pada keberagaman bahasa yang digunakan.
Lantas kenapa saya menggunakan bahasa inggris! Mungkin karena tulisanku jelek, tidak seperti penulis kebanyakan yang memiliki gaya bahasa dan alur cerita yang mengesankan.
Saya bukan penulis dan menulis menjadi hal yang terberat dalam hidupku, jika harus memilih antara menulis dan mengangkat 10 goni gabah, saya akan memilih menggunakan kekuatan otot.
Dunia terus berubah, begitu juga dengan platform ini, jadi saya harus adaptif dan mencoba belajar menulis meskipun amburadul dan tidak menarik.
Hahaha... Pembahasannya sudah melenceng dari topik SEC.
Hahaha... Pembahasannya sudah melenceng dari topik SEC.
Nah, saya malah justru sering mengirim komentar yang cenderung "keluar" dari isi artikel, apakah jangan-jangan itu yang menjadi masalah saya? Hahaha. Gini, maksudnya saya tidak ingin komunikasi saya dengan seseorang dibatasi oleh artikelnya, itu mempersempit ruang engagement itu sendiri. Bagaimana menurut Bang @irawandedi? Apakah itu kuRang baik? Atau malah tidak baik?
Hi, @irawandedy,
Your post has been manually curated!
So many screenshots! And those moving pictures, are those gifs?
Thank you for voting for our witness
Your post is manually rewarded by the
World of Xpilar Community Curation Trail
BottoSTEEM OPERATED AND MAINTAINED BY XPILAR TEAM
BottoSteem
Robust Automations on STEEM Blockchain using the Power of AI
https://steemit.com/~witnesses vote xpilar.witness
"Become successful with @wox-helpfund!"
If you want to know more click on the link
https://steemit.com/@wox-helpfund ❤️
This post has been upvoted/supported by Team 5 via @philhughes. Our team supports content that adds to the community.