Topdown Analysis Of TRXUSDT Using Support And Resistance Strategy

Hello great minds,
I trust you are all doing perfectly fine and are enjoying activities in the community.
It is a great day and I feel overjoyed to come before you all in this great community today, to share my analysis on trxusdt.
I will be doing a breakdown of topdown analysis of trxusdt beginning from the monthly timeframe, down to the hourly timeframe.
And I will be making use of support and resistance strategy for my analysis, alongside the rsi indicator for trading confluence..
ANALYSIS USING SUPPORT AND RESISTANCE STRATEGY
Like I use to tell, my analysis starts from the higher timeframe, down to the lower timeframe.
From the higher timeframe, I search for the overall market trend as this will influence my trading decisions on the lower timeframe.
On the lower timeframe, I search for entries into the market, entries are very important if you are to apply risk management in trading..
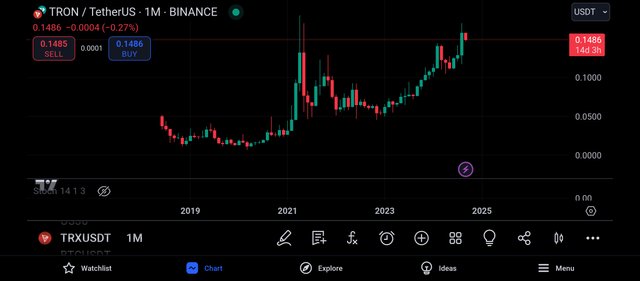
Begining my analysis from the monthly timeframe as usual, I can see how neat the price chart is.
There are no noise in the market as every candle on this timeframe is a valid one.
Also, I was able to detect the trend of the market, and from the screenshot above, I wouldn't say the market is on a bearish trend.
We can see that the current market price has broken a new level in the market, and as such we can say that the pair trxusdt is bullish overall..
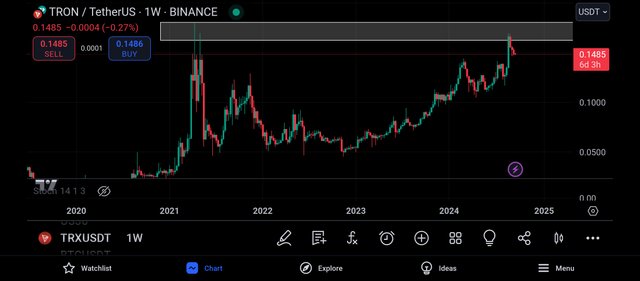
I then continued my analysis on the weekly timeframe and on this timeframe, I could see the market more clearly.
I could see more candles on this timeframe because each candle on this timeframe is being formed after a trading period of 7days.
And looking carefully, I was able to spot a key level and this level is functioning as a resistance level to the market price, and whenever the market trades towards this level, we can expect to see a bearish rejection of the market.
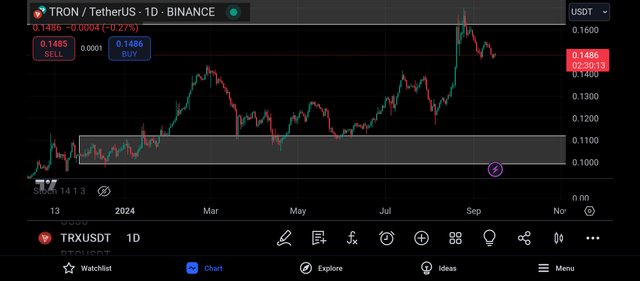
And moving to the daily timeframe, I realised that there are more candlestick here than on the weekly timeframe, and this is because each candle on this timeframe takes a trading period of 24hrs to be completed.
And I looked very carefully and I was able to spot another key level and this level is functioning as a support level to the market, and it is expected that whenever the market trades towards this level, we can expect to see a bullish rejection.
This support level can be said to be a valid support level because the market has made several touches on it and has been unable to break below it.
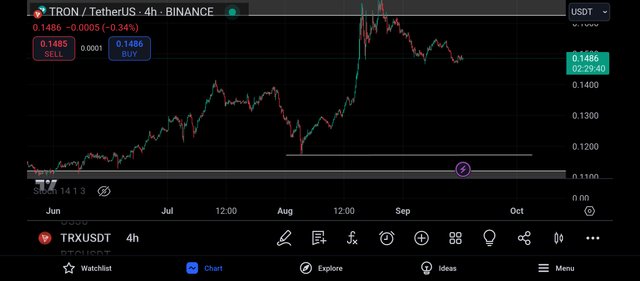
And moving to the 4hr timeframe, I could see lots of noise in the market, and this shows the presence of the buyers and sellers in the market.
And looking at the market, I realised that it has been rejected off it's resistance level and I can expect it to retrace back to retest this resistance level again before it begins to drop.
And while it drops, I expect it to get to a certain level which is functioning as my take profit level, and this level has been marked with the use of a straight line, just as shown above.
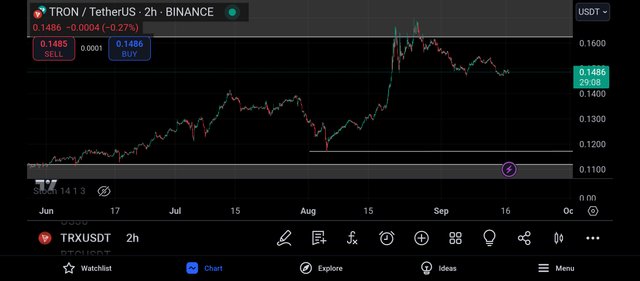
I then moved to the 2hr timeframe in search of entry into the market, and looking carefully, I could see the buyers and sellers struggling to drive the market to their preferred direction.
Getting to the 2hr timeframe, my bearish bias of the market has already been built and I am here to search for an entry.
And before doing that, I decided to search for confluence using the relative strength index indicator.
CONFLUENCE USING RELATIVE STRENGTH INDEX INDICATOR
The rsi indicator is a very important technical tool that is used in analysing the cryptomarket.
This Indicator is used to detect overbought and oversold market regions and this inturn influences my trading decisions.
When the market is overbought, it is a bearish trend reversal signal and when the market is oversold, it is a bullish trend reversal signal.
I then decided to apply this Indicator to the monthly timeframe first, before other timeframes.
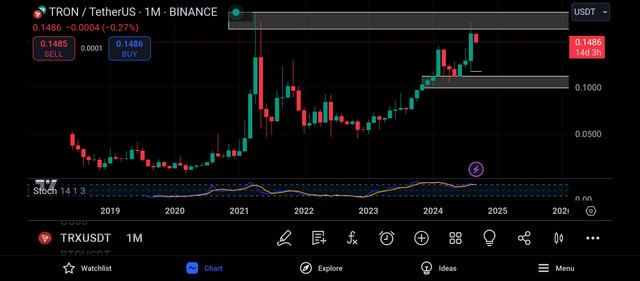
Applying the rsi to the monthly timeframe, I realised that the market is being overbought and an overbought market is detected when the rsi crosses above its 80% line.
And an overbought market can be understood to be a bearish trend reversal signal of the market, which implies the change in market strength from the buyers to the sellers.
And as such, I moved to the daily timeframe for more market analysis.
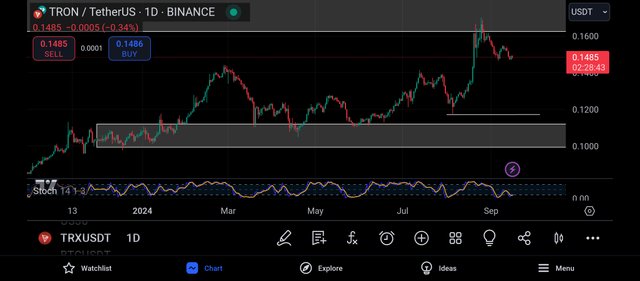
And moving to the daily timeframe, I could see that the market is being oversold and an oversold market is understood to be a bullish trend reversal of signal.
An oversold market can be detected when the rsi crosses below its 20% line, and when this happens, we can expect to see a change in market strength, from the bears to the bulls.
And then I decided to move to the 2hr timeframe for entry into the market.
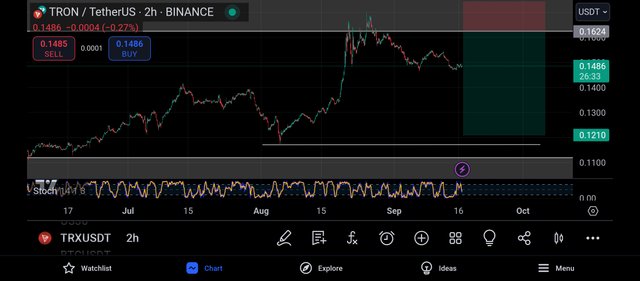
Getting to the 2hr timeframe, I could see the market more clearly and I expect the market to retrace and retest this resistance level.
And when such happens I can then place my sell entry on the market, and this can be seen from the above screenshot.
CONCLUSION
I have shared my personal analysis of trxusdt, and from my analysis, I expect to see a momentarily retracement to the upside then a bearish move.
This post of mine was not created as a financial advise but for educational purpose
https://x.com/JuecoYoung/status/1835804306123173894