Topdown Analysis Of AVAXUSDT Using Support And Resistance Strategy And RSI Indicator As Confluence
Hello great minds,
I feel honored to approach you all today to discuss on a very important issue in the cryptospace.
I believe you are all doing perfectly fine and are enjoying your activities in the community as you actively promote steemit across various social media platform.
Today I will be sharing my analysis on the token of avalanche network which is avax, and I will be sharing my analysis on avax against usdt.
Please stay tuned as I share my analysis
ANALYSIS USING SUPPORT AND RESISTANCE STRATEGY
Technical analysis are best started from the higher timeframe and then to the lower timeframe.
Some analyst prefer starting their analysis from the daily timeframe, down to the fewer minutes, but I begin mine from the monthly timeframe.
The monthly timeframe helps me to compress market activities and display them on a screen.
And the monthly timeframe also helps in eliminating unnecessary noise from the market.
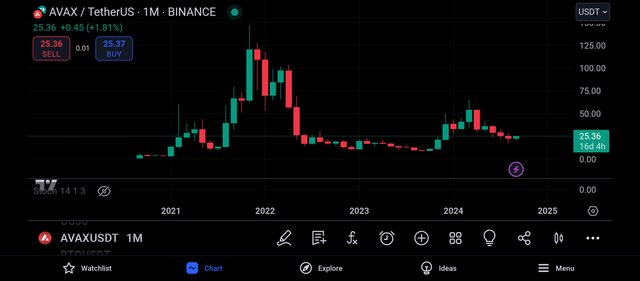
Beginning with the monthly timeframe of the pair AVAXUSDT, we can see the formation of bullish and bearish candles.
We can also see that there are few candles on this timeframe and this is because each candlestick were formed within the space of 1month.
Also from the above screenshot, we can notice that it is easier for the market trend to be identified, and from the above screenshot we see that the most recent leg of the market is bearish.
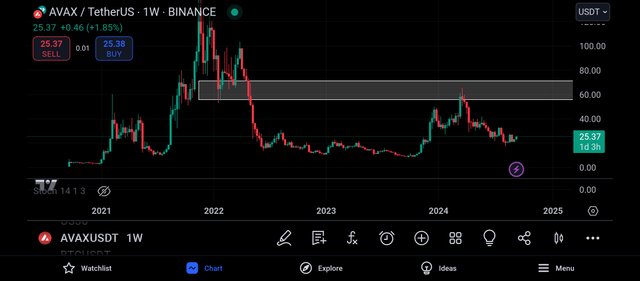
I then decided to continue my analysis on the weekly timeframe and on this timeframe I could see more candles and this is because each candle on this timeframe is being formed within the trading period of 7days.
And looking carefully at the market, I was able to spot a key level and this level is functioning as a resistance level to the market price.
And the market is expected to be rejected whenever it trades towards this level, as this level has more sellers than buyers.
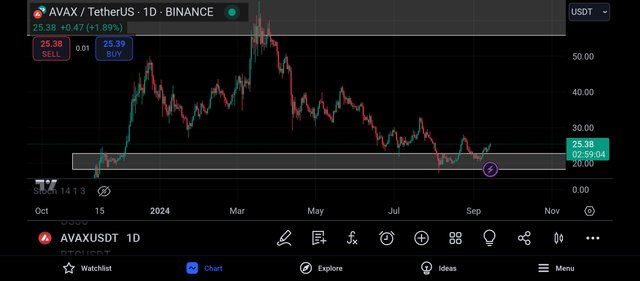
And moving to the daily timeframe, I could see noise in the market, and on this timeframe, it takes a trading period of 24hrs for each candle to be formed.
And looking carefully, I was able to identify another key level, and this time, this level is functioning as a support level to the market price, and the market is expected to see a bullish rejection whenever it trades towards this level.
And from the screenshot above, we can see that the market has made several touches on this level and has been unable to break below it, which makes this level a valid one.
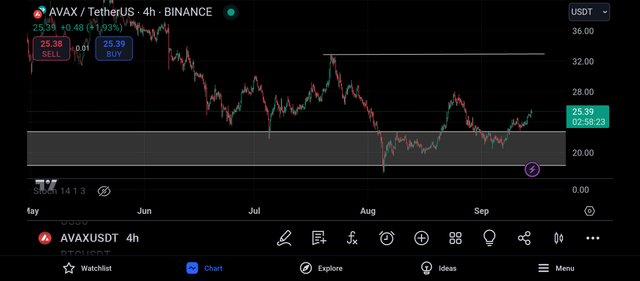
And moving to the 4hr timeframe I could see the market more clearly.
I could feel the presence of the buyers and sellers as they struggle to drive the market to their preferred direction.
And on this market, my bias is bullish to a certain level, and as such, I decided to search for another level which will function as my take profit level on the 4hr timeframe.
And as such, I decided to move to the 2hr timeframe in search of entry into the market.
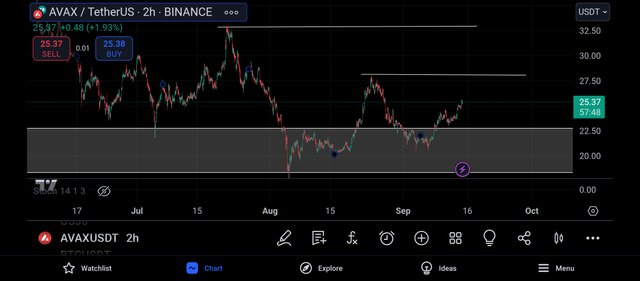
And getting to the 2hr timeframe, I could see lots of noise in the market, I could feel the presence of buyers and sellers but my bullish bias has already been established.
As I looked, I discovered another level which will function as my first take profit before the one spotted on the 4hr timeframe.
And to enter this trade, I decided to search for trading confluence using the relative strength index indicator.
CONFLUENCE USING RELATIVE STRENGTH INDEX INDICATOR
The rsi Indicator is a very important trading tool in the cryptomarket.
The rsi indicator is used to spot oversold and overbought market regions.
And when a market is spotted to be oversold, it is a signal that the market is about to experience a bullish move.
And when a market is spotted to be overbought, it is a signal that the market is about to experience a bearish move.
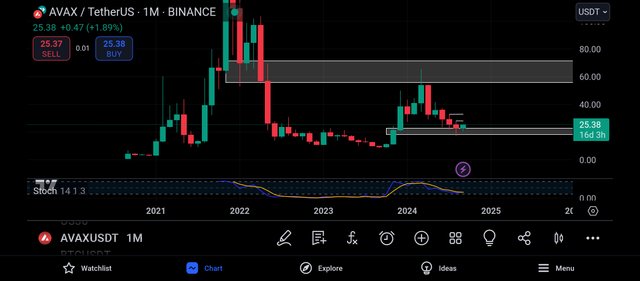
Applying the rsi to the monthly timeframe, I could see that the market is being oversold and this was detected because the rsi has crossed below its 20% line.
An oversold market is one that signals a bullish trend reversal of the market, that is, a change in market strength from the sellers to the buyers.
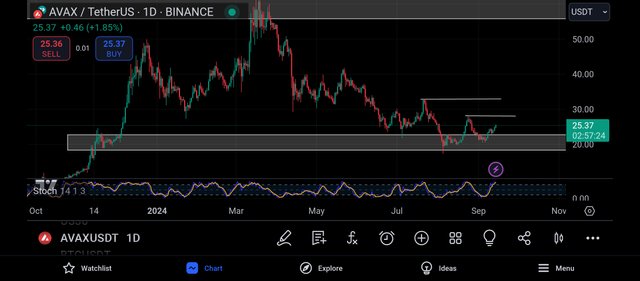
Moving to the daily timeframe, I could see that the market is being overbought as the rsi has crossed above its 80% line.
An overbought market is the opposite of an oversold market and it signals a bearish trend reversal of the market, a change in market strength from the buyers to sellers.
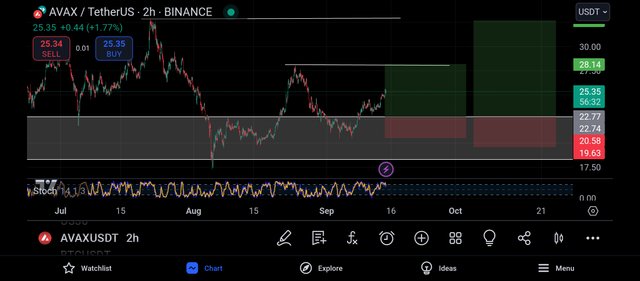
On the 2hr timeframe, I could see that the market is being overbought, and I can also see that the market has traded above its support level.
And as such, I decided to wait for the market to retrace and retest this support level, and then I can place a buy entry on the market, and this can be confirmed from the above screenshot.
CONCLUSION
Avalanche is a very nice crypto project in the cryptospace and its native token is what we know to be avax.
And as seen above, I have shared my analysis on AVAXUSDT, and I intend for my post to be taken as an educational content and not a financial advise.
https://x.com/JuecoYoung/status/1835076172310626798
Upvoted! Thank you for supporting witness @jswit.