Blockchain and Cryptocurrency Advanced - The ATR Indicator

The ATR indicator which is the short for the Average True Range Indicator is basically a technical indicator that measures the market volatility of an asset on average over a particular period of time. The ATR indicator has proven to be effective in measuring price volatility of an asset and is a very powerful for identifying how much the price of any given cryptocurrency asset has fluctuated during a particular period of time. The ATR indicator was developed by J. Welles Wilder and was published in his book that was published in 1978.
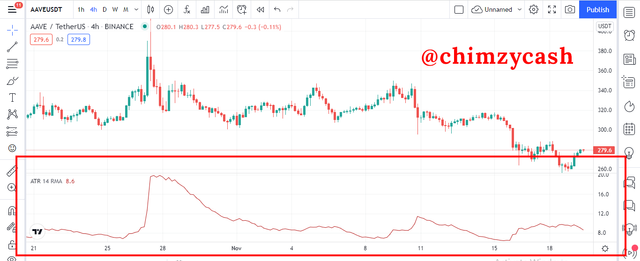
The sole purpose for creating the indicator was to measure the price volatility and price fluctuations of an asset on average over a particular period of time. The Average True Range Indicator has a default period length of 14. The ATR oscillator moves between low values and high values. When the ATR value is high, it can indicate that the price fluctuations is high and when the ATR value is low, it can indicate that the price fluctuations is much lower which either mean that the asset is moving sideways or during a period of consolidation.
.png)
ATR indicator on the AAVE/USDT Chart
Average True Range Calculation
When it comes to calculating the Average True Range, the True Range needs to be gotten. To calculate the True Range, there are 3 parts that is calculated.
1). True Range = CPH – CPL
Where;
Current Period High = CPH
Current Period Low = CPL
2). True Range = CPH - PPC
Where;
Current Period High = CPH
Previous Period Close = PPC
3). True Range = CPL - PPC
Where;
Current Period Low = CPL
Previous Period Close = PPC
Interpreting the True Range calculations
The first part of the True Range calculation which is the current high minus current low, shows the distance from current high to the current low. This is seen on the candlesticks and is utilized when the current candlestick is bigger than the previous candlestick.
The second part of the True Range calculation which is the current high minus previous close, shows the distance from current high to the previous close. This is seen on the candlesticks and is utilized when the current candlestick closes higher than the previous candlestick.
The third part of the True Range calculation which is the current low minus the previous close, shows the distance from the current low to the previous close. This is seen on the candlesticks and is utilized when the current candlestick closes lower than the previous candlestick.
The Average True Range takes into consideration the MA of the true range using the set period. The default period for the ATR indicator is 14 periods. Using the 14 period ATR, it is calculated as True Range divided by 14.
ATR = max[(CH – CL), abs(H – PC), abs(L – PC)] / 14
where;
Current High = CH
Current Low = CL
Low = L
Previous Close = PC
Using the ATR calculation, the value of the ATR is gotten using the set number of periods. The next ATR can be calculated as follows; using 14 period
Current ATR = [(Previous Average True Range × (period -1) + Current True Range] / period
Let’s take for instance, if the value of the first calculated ATR is 8.5
Let’s take for instance, AAVE/USDT
Previous ATR value = 7.5
True Range = 6.5
Periods = 14
Using the current ATR formula
Current ATR = [(Previous Average True Range × (period -1) + Current True Range] / period
Current ATR = (7.5 × (14 -1) + 6.5) / 14
Current ATR = (7.5 × (13) + 6.5) / 14
Current ATR = (7.5 × 13 + 6.5) / 14
Current ATR = 104 / 14
Current ATR = 7.43

This is actually quite the first time I will be hearing about this indicator actually. Quite the first time