Blockchain and Cryptocurrency Beginner - How to Add an Indicator on a Chart on TradingView

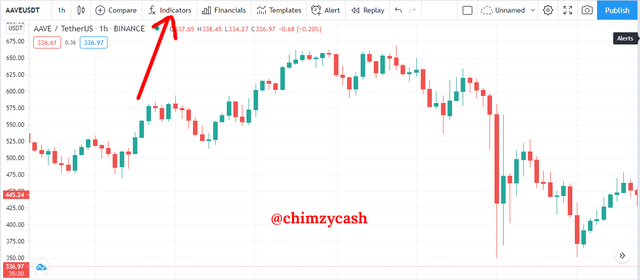
For this demonstration, I will be showing how to add the MACD indicator on a chart.
To add the MACD indicator on any cryptocurrency price chart, click on the indicators tab located at the top
.png)
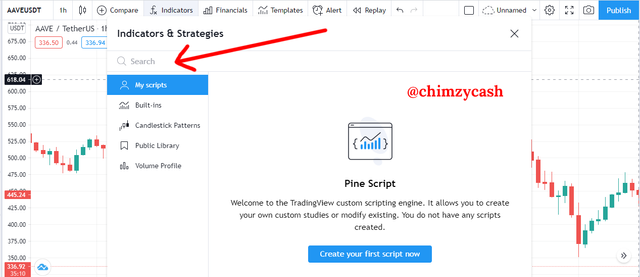
- The search window will pop up, click on the search input and type MACD
.png)
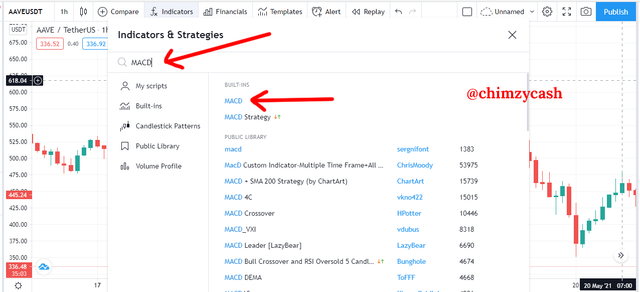
- All the indicators that is related to MACD will be displayed, choose the first indicator with only MACD
.png)
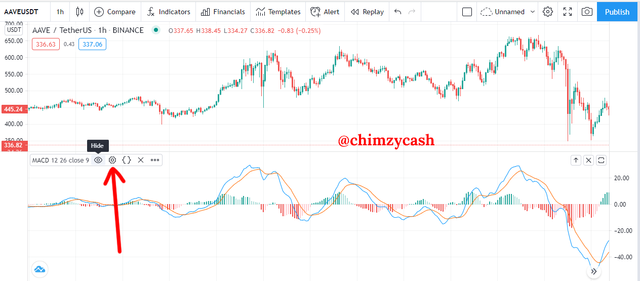
- To access the MACD indicator settings, click anywhere on the MACD pane and click on the settings gear icon
.png)
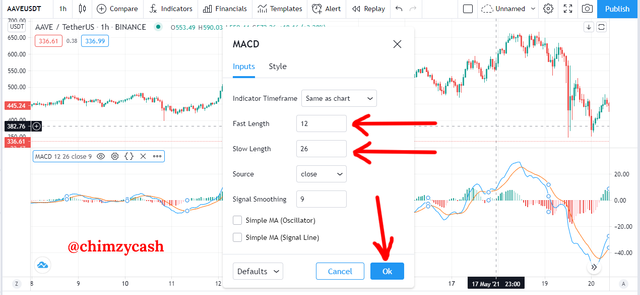
The MACD settings allows you to make changes to the inputs and styles based on your needs.
The input sections allows you to change the fast length, slow length, source and signal smoothing parameters to fit your analysis needs.
.png)
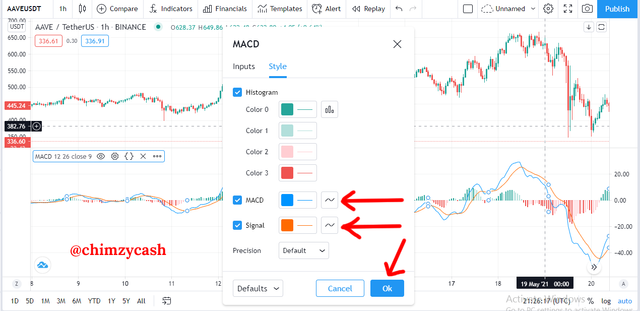
- The styles section allows you to change the visual look of the MACD elements such as the colours and thickness of the lines.
.png)
.png)
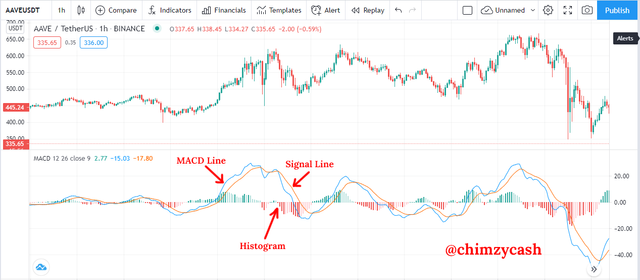
The MACD (Moving Average Convergence Divergence) indicator is a very powerful and yet easy to use indicator that is used to identify momentum of price of any cryptocurrency asset in the market. It is a trend-following momentum indicator and for me, it is a very useful indicator that can help determine market trends, entry and exit points based on the momentum of the price movements. To use the MACD to identify entry points, when the MACD line comes from below and crosses above the signal line. Also, to use the MACD to identify exit points, when the MACD line crosses comes from above and crosses below the signal line.