BITCOIN 💵💵💵
$BTC
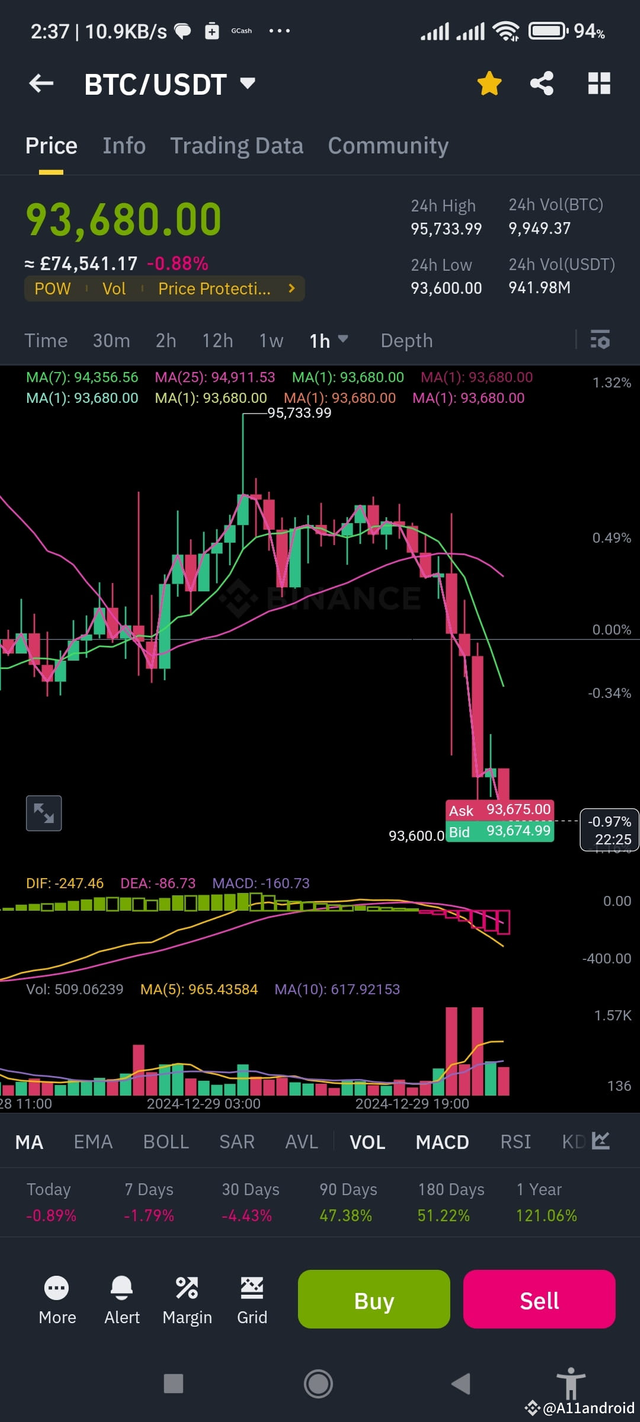
Let's analyze the current Bitcoin chart .
Current Market Overview
- Price: £93,680.00
- 24h Change: -0.88%
- 24h High: £95,733.99
- 24h Low: £93,600.00
- 24h Volume (BTC): 9,949.37
- 24h Volume (USDT): 941.98M
Technical Indicators - MACD: The MACD line is below the signal line, indicating a potential #bearish trend.
- RSI: The RSI is currently at 34%, which is in the oversold territory, suggesting that the price might be due for a rebound.
- Moving Averages: The price is below the 7-day and 25-day moving averages, indicating a short-term downtrend.
Chart Analysis;
The chart shows a recent decline in Bitcoin's price, with the price currently trading below the 7-day and 25-day moving averages. The MACD is also below the signal line, suggesting a potential bearish trend. However, the RSI is in the oversold territory, which could indicate a potential rebound.
When might Bitcoin start to pump up?
It's difficult to predict exactly when Bitcoin will start to pump up again. However, based on the current technical indicators, there are a few potential scenarios: - Rebound from #oversold conditions: If the RSI continues to remain in the oversold territory, it could signal a potential rebound in the price.
- $Breakout above resistance levels: If the price breaks above the 7-day and 25-day moving averages, it could signal a #bullish trend.
- Positive news or events: Positive news or events related to Bitcoin could also trigger a pump in the price.

Important Note: This analysis is based on the current market conditions and technical indicators. Market conditions can change rapidly, and this analysis should not be considered financial advice. It's always recommended to do your own research and consult with a financial advisor before making any investment