Analysis On Steem Price Chart
Today I will want us to be looking at the price chart of steemusdt pair to really glean at the happenings in the market which has been crazy in the past weeks with the continued downside of the cryptocurrency asset class making us really wonder what is happening if the bull run is over before it even began, well we are still early to this coming bull run and it hasn't even played out yet.
So I will be breaking down what I see from the price chart of steem and majorly focusing on the weekly and the daily timeframe which I believe it's the most important.
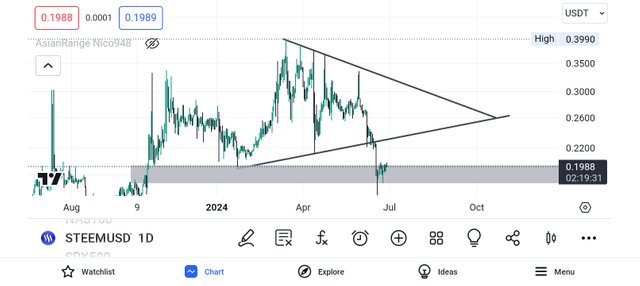
Screenshot from tradingview
From the pic above that shows the chart of steem against USD and really like months back steem seems to be forming a wedge pattern and honestly I admit I was kind of hoping it would break to the upside but ofcourse with every wedge pattern there is always a possibility of it breaking up or down.
Well we might be looking at things from the perspective that this is supposed to be a bull season right immediately after the halving and as such any pattern formed on the chart is likely to break out to the upside more than the downside but ofcourse this is still the unpredictable and volatile market, true in the general overview we might know where it's going to but sometimes it becomes hard to really predict the likely destination of where price is going accurately.
And the downside in steems price shouldn't really come as a surprise for a technical analyst as the chart has shown price forming a wedge pattern for months now and normally we know it could either break up or down and in this instance it broke down.
In this market it's good to always keep and open mind and it's important that we learn how to react to prices and not be rigid to our predictions.
Steem broke down from the wedge pattern it formed really well on a daily, though it still showed on the weekly but that pattern is well illustrated on the daily timeframe and hence it broke down it went right down to a fairvalue gap.
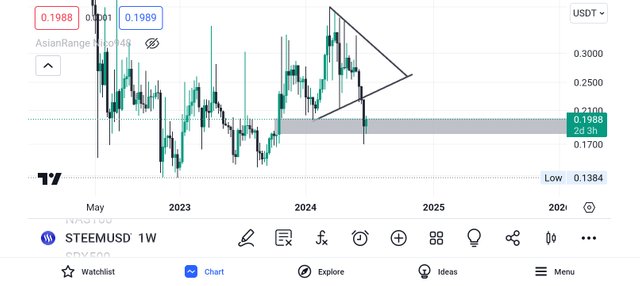
Screenshot from tradingview
Now the fair value is one am expecting to hold as we see from the weekly chart above, the FVG on the weekly timeframe seems a strong area of support for the falling price of steem and when it broke down it really reached the FVG on the weekly timeframe infact the previous weekly candle stick even wicked below the FVG and touched the order block below the weekly FVG, but it's important to note that it didn't close below the weekly FVG.
I would have really been worried if a weekly candle stick had close below that weekly FVG but it didn't and merely wicked below and was rejected and the body perfectly respected the FVG which ofcourse it's a good sign and we can see from the next weekly candle stick which we are still on still maintaining some good sign as it remains green and seems to be attempting to move off the FVG to a higher level.
Ofcourse it remains to be seen what we happen by the time this weekly candle stick closes though I believe if we close bullish then it's a good sign that we might get a good breather soon though I wouldn't say we are out of the danger zone yet. If we close bullish for this week the I believe we would move up nicely a little to the up side.
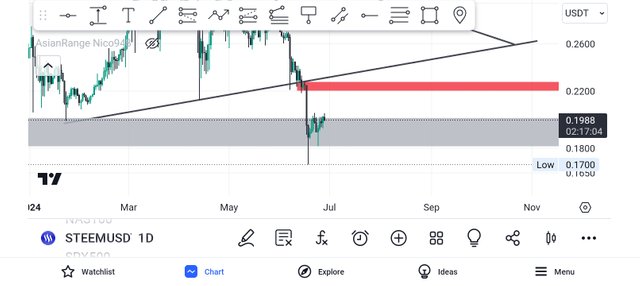
Screenshot from tradingview
Incase we move up from the weekly FVG then the next target am expecting for us to try first would be the $0.22 level and there seems to be a supply zone at that level and it would be a perfect retest of the wedge pattern which steem broke down from and that would sure act as a major resistance, so as we are moving off the FVG on the weekly I believe that bottom of the wedge pattern would be an area we are likely to test next as it would act likely as a strong resistance and if we get rejected there then that means more downside.
But then it all depends on how strong the weekly FVG is, if it's strong enough then I feel if the push of momentum from it it's quiet strong, stronger than the sellers waiting to short at the retest then it's more likely we smash through the resistance on our way up to a much higher price level but for now if we continue up from that $0.19 level my next target is $0.22 level and it's expected that it acts as a resistance.
Personally I expect us to be bullish and move off from that weekly FVG and on reaching to that zone then a slight retracement in reaction to the supply zone only to gather more momentum to shoot up even higher, I believe that the weekly FVG would hold and help push steem to much highs as buyers step in, well that remains to be seen hopefully in the coming weeks there is positive news to help push price in the right direction.
N/B: This is not intended to be a financial advice and everyone are urged to do there due diligence
Upvoted! Thank you for supporting witness @jswit.
https://x.com/frank_anayo/status/1806819495421579652?t=prEt2DMmPruCfYJIFn34XA&s=19