My technical analysis of the SOLUSDT Chart
Hello everyone, I trust you're doing fine. I'll be analyzing the Solana charts. Solana is one of the most popular altcoins, deservedly so. It is the token for the Solana blockchain. A lot of projects have been and are still being built on the Solana blockchain. In recent times, we've seen the price of Solana cross the $100 mark, and approaching the $200 price. As at the time of writing this post, the price of Solana was around $140, and I believe that the price will go back up. For a project that was launched in 2020, Solana has really done well over the years. I think the progress of Solana in terms of price and utility over time is very impressive.
Now let's get into the analysis.
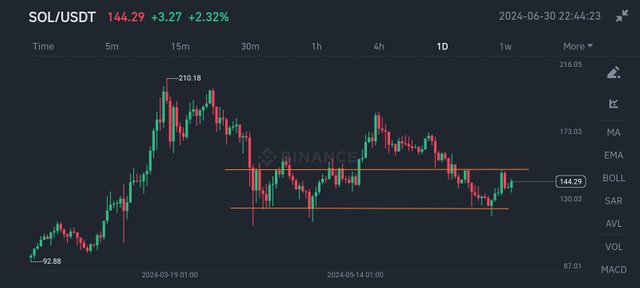
Solana's one day chart is quite an interesting one as you can see above. There is a lot to watch out for here. The price of Solana has seen several ups and downs in recent time. But one important thing to note is a very crucial support zone, which I indicated with the lower orange line. If you look at the chart really well, you'll notice that every time the price hits that zone, it bounces back up. This zone I am talking about is around the $126 price range. The significance of this price range is that whenever the price of Solana drops to within $126, traders should be weary because there's a high chance that it will go back up. However, if it breaks that support zone and goes below that price, then there's a high possibility that there will be a very hard fall in solana's price.
If you look at the chart, I drew an upper line indicating a resistance point (around $151). Price got pushed down on two occasions when it got there, until it finally broke out and went high. Eventually the price went down, and now, we can see that the price is approaching that point again and being resisted. As at the time of this analysis (30th June), the price of Solana was $144. I am watching to see if it will break out of the resistance eventually. I believe it will.
To understand better what was going on at the recent part of the 1 day chart, let's look at the 4 hour chart.
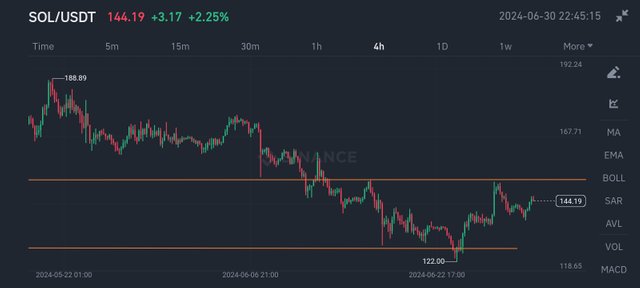
You can see how price was on the downtrend. It tried to push up a little but was resisted and it continued falling until it hit the support line, then an uptrend began. Even in the uptrend, price got to the resistance line again and got pushed back, but currently, it is going back up again, and like I said before, I have hope it will break the resistance this time.
As in many cases, even after breaking the resistance, price usually retraces back a little, but then, after retracement, there is usually a massive pump.
That's it for my analysis. I hope you enjoyed my analysis. I am looking forward to my next analysis here.
Note: This article is not a financial advise.
X link
Hi @oguzvic,
Please add a proper title, and tags, in your promotion post. You can use #steem, #steemit, $steem $sbd, and other content-relevant tags.
Thanks.
Noted. Thanks for the correction.
These days Solana is doing great in the market and it is also because now there are news that some companies have decided to file for its ETF however one company has already done it. It's too early to expect the outcome but I believe that things are going to be positive in the market for Solana.
Great T.A from you on solusdt, I truly find this captivating it shows great analytical skills from you, for me though almost all coins seem to be in consolidatory phase at the moment until a big move will ensure, hopefully to the upside as we have seen enough downside already.