You are viewing a single comment's thread from:
RE: Bitcoin: How to Read Those Bloody Charts? And My Short Term Prediction.
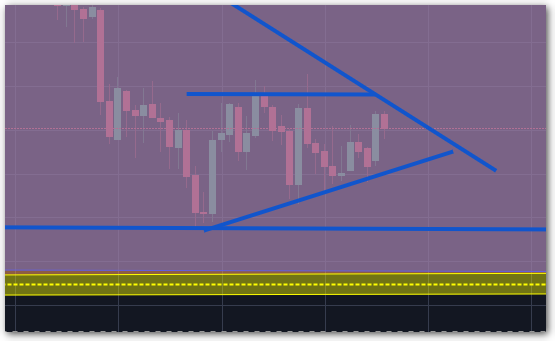
It's definitely a rising wedge. I just cancelled a post where I made a bitcoin price melting prediction. The hourly trend is very weak on the upside and strong on the downside, you can clearly see that there is a lot more volume when the market's going down. So blood on the streets tomorrow, crypto blood!
You can find my previous analyses in my blog. I predicted this would happen 3 days ago.
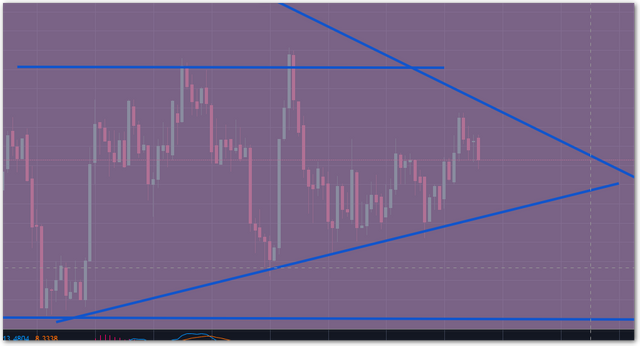
The price target for a meltdown could be anywhere from 5000 to 6000 but I don't expect it to go below 5000, though I don't think anyone can know the bottom. As long as big money is going out, prices will be suppressed. The sellers are big. That's the obvious part.
Yeah, the 1-Hour chart looks pretty downish and sideways...and had that slight uptick I was kinda expecting.
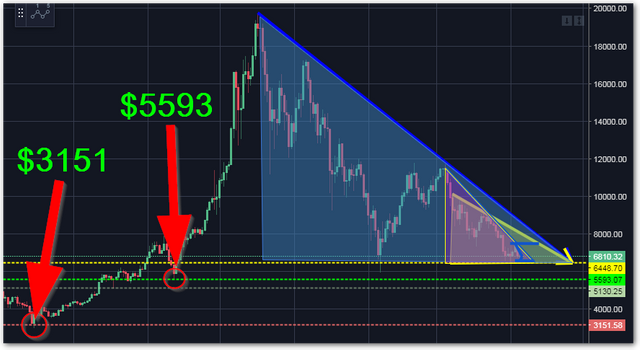
I'm keeping an eye because if it really breaks those support lines...the next fall could be around $5593 and then $3151.