How to connect 'Grafana' with 'Influxdb' <Ubuntu 17+> .
Hi.
Last time we studied what the munin is, in fact using munin makes you stuffy because of sloppy graphic interface of munin. If you want to check data graphically, you have to make your own plugin. But plugin has to be made with perl script, so if you don’t know language of perl you may hard to make it.

Interestingly, InfluxDB is optimized to take and save data from Munin. Because InfluxDB is based on ‘time series’ data. So it is great decision to connect munin with influxDB.
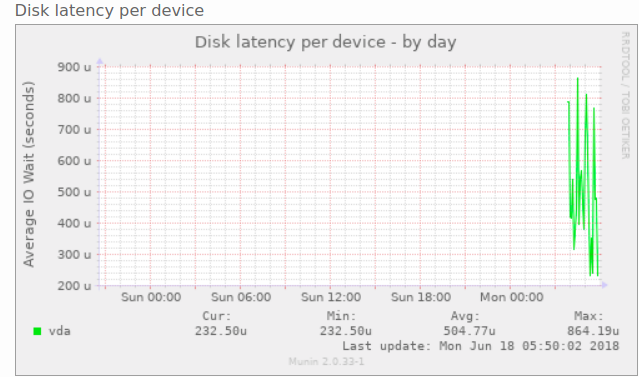
But I can’t find tutorial how to connect with them. So let’s study about this. In this time, I only teach you how to connect InfluxDB with Grafana. Next time, I will teach you how to make a gateway for connecting all of them.
# install InfluxDB for ubuntu user
curl -sL https://repos.influxdata.com/influxdb.key | sudo apt-key add -
# If you have error at curl,
apt-get install curl
source /etc/lsb-release
echo "deb https://repos.influxdata.com/${DISTRIB_ID,,} ${DISTRIB_CODENAME} stable" | sudo tee /etc/apt/sources.list.d/influxdb.list
( If you are not ubuntu user, visit https://docs.influxdata.com/influxdb/v0.13/introduction/installation )
# Update data you 'curled', install influxdb.
sudo apt-get update && sudo apt-get install influxdb
# Start influxdb.
sudo service influxdb start
Now let’s make basic database of InfluxDB.
$ influx
Connected to http://localhost:8086 version 0.13.x
InfluxDB shell 0.13.x# Executing Influx makes your bash like this style.
# Execute under commands.
CREATE DATABASE munin_db
CREATE USER admin WITH PASSWORD 'admin' WITH ALL PRIVILEGES
CREATE USER grafana WITH PASSWORD 'grafana'
GRANT ALL ON munin_db TO grafana
exit
In regular order, make two db. One is for munin, another is for grafana.
# Configure influxDB.
vim /etc/influxdb/influxdb.conf
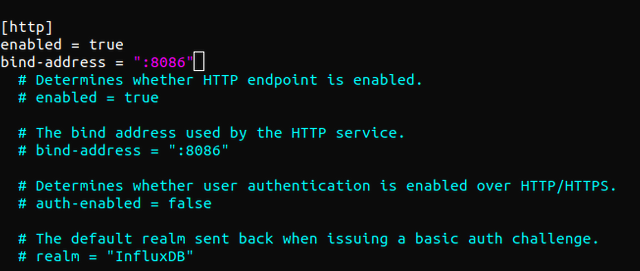
# In [http]
enabled = true
bind-address = ":8086" # Change the number.
# Save&Exit. and enter the command.
$ sudo systemctl restart influxdb.service.
Simple. Isn’t it? You can use ‘nano’, ‘leafpad’.. or vim. Now let’s install Grafana!
# Install grafana.
wget https://s3-us-west-2.amazonaws.com/grafana-releases/release/grafana_5.1.3_amd64.deb
sudo apt-get install -y adduser libfontconfig
# Unzip grafana files and install.
sudo dpkg -i grafana_5.1.3_amd64.deb
# also install the file below to allow access to ' https ' in case.
sudo apt-get install -y apt-transport-https
It’s very simple!
sudo service grafana-server start
sudo update-rc.d grafana-server defaults
#If you face problem these lines, command under lines.
sudo systemctl daemon-reload
sudo systemctl start grafana-server
sudo systemctl status grafana-server
# If you want it to turn on automatically every time you reboot, please run the command below.
sudo systemctl enable grafana-server.service
Let’s access http://yourserver:3000

It depends on your taste, beautiful logo made an entrance! Basic id and password of grafana is ‘admin’/‘admin’.
vi /etc/grafana/grafana.ini
# After command vi,
[users] # find this,
# disable user signup / registration
allow_sign_up = false # input left command.
...
[auth.anonymous] # If you lower it a little, you will meet auth.anonymous...
# enable anonymous access
enabled = true # enable to access.$ sudo service grafana-server restart
# Run this command to restart your grafana.
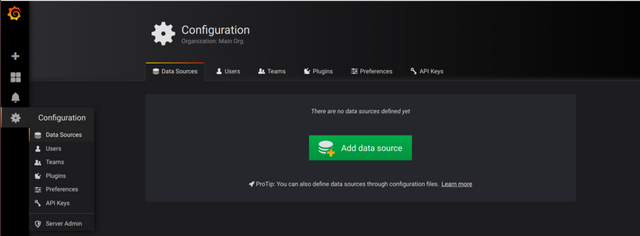
After log-in -> click the ‘data source’ -> click the button named ‘Add data source’.
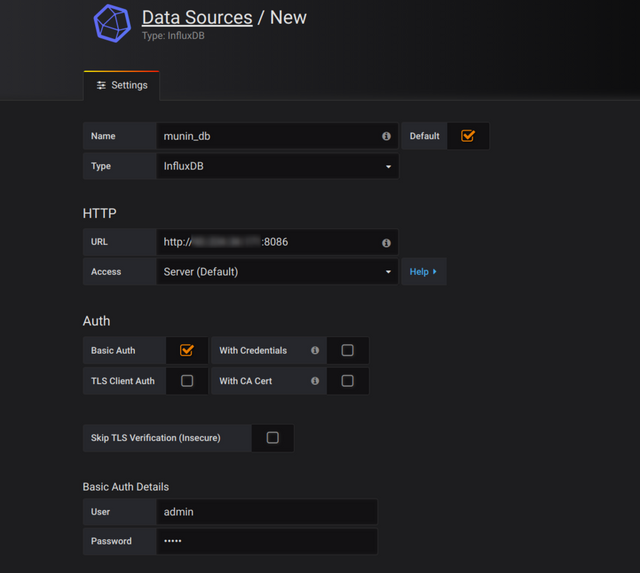
We made database named ‘munin_db’, so enter name with accuracy, and change ‘type’ to ‘InfluxDB’. Enter the url ‘http://serverhost:8086’, check the basic Auth.
Enter your admin/admin in username and password.
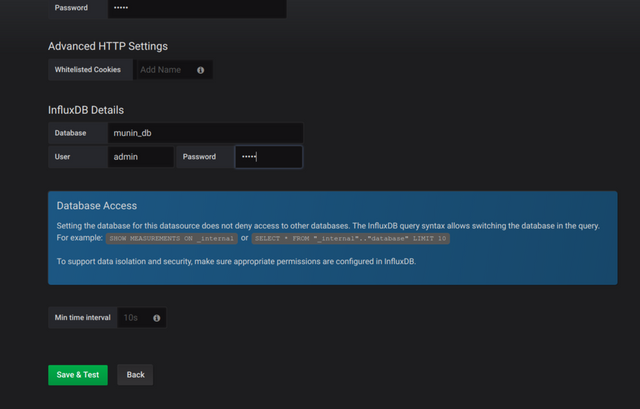
admin/admin
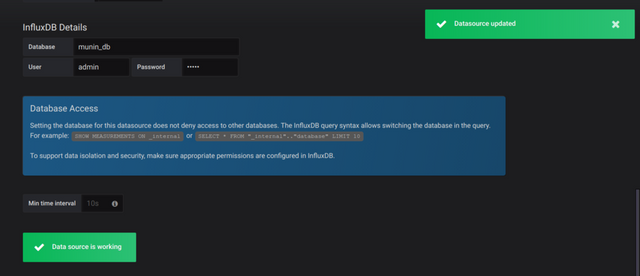
Clicking green button makes you like that.
Finally we linked InfluxDB with Grafana. Next time we will make a gateway to link them with munin. Voting makes me happy to write a tutorial. Thanks.
Thank you @wonseok786 for sharing the instructional post
thanks!!
You're welcome