TIB: Today I Bought (and Sold) - An Investors Journal #509 - Europe Financials, China Telecom, Payments, Electric Vehicles, Engineering Services, Oil, French Utility, Gold Mining, Electric Vehicles, 3D Printing, Crypto. Agriculture
Markets are beginning to grow uncomfortable with virus impacts and maybe also inflation. Trade action is buying into bottom dwellers and momentum in European banking. Profit taking in Tesla and gold mining and 3D Printing. A volatile week in agriculture and cryptocurrency yields great profits

Portfolio News
Market Stumbles
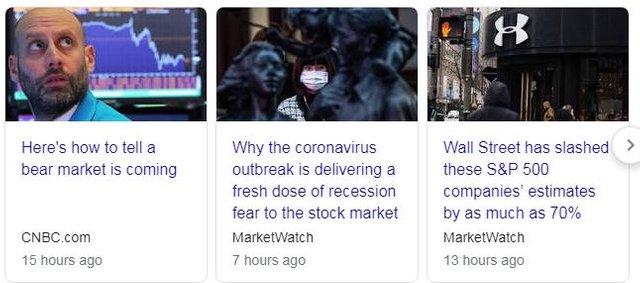
Despite good earnings. US markets begin to stumble with the reality of the Covid-19 virus impact beginning to sink in.
There are something like 400 million Chinese people restricted from moving - this is more than the population of the US - and it is having an impact on supply chains and base level consumer demand in China.
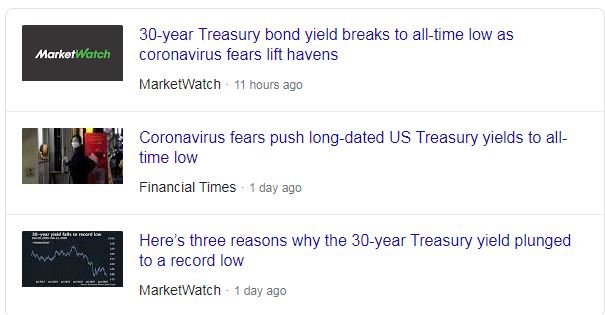
Treasury yields are moving lower too with the 30 year hitting an all time low. 3 factors to consider here are Covid-19 virus driving recession risk, potential for up to 40 basis points cut in US interest rates following easing by other central banks and the old bogey inflation may just be coming back.
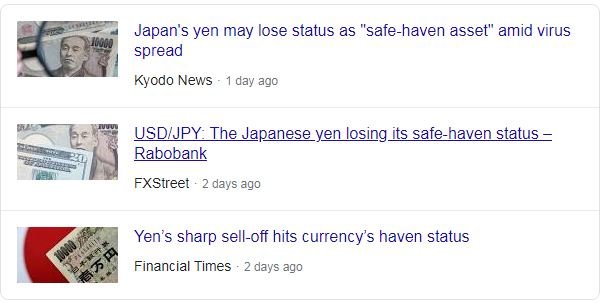
Of note is that the normal safe haven role of Japanese Yen has rolled over with shocking GDP numbers published following the sales tax hike. That is why I have my Japanese stock holdings hedged with a long USDJPY forex holding.
Bought
ING Groep N.V. (INGA.AS): Dutch Bank. Deployed profits from Electricite de France and Allianz SE sales (see below) to average down December 2021 strike 12 call options. Sadly there are not 11 strike options available that far out in time. This brings breakeven for the trade down to €12.57, 17% above the closing price of €10.73.
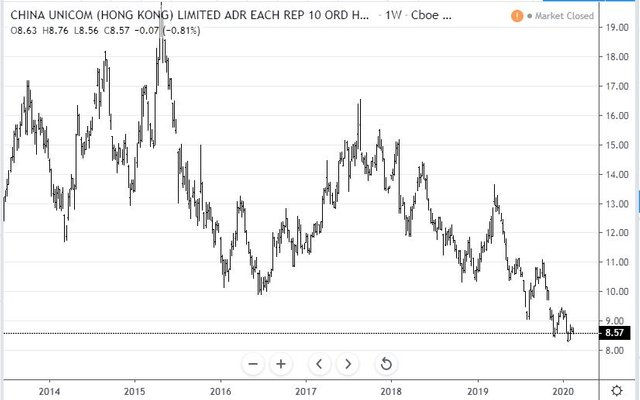
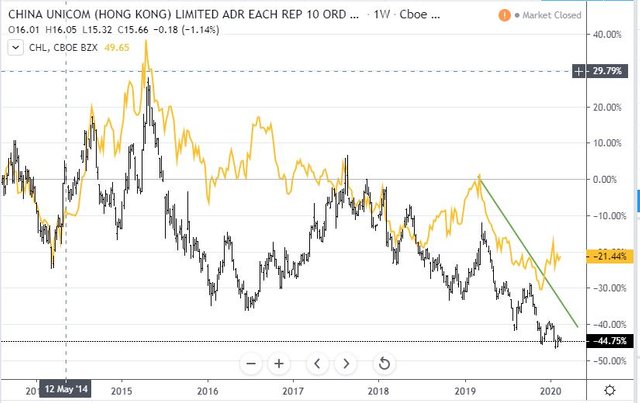
China Unicom (Hong Kong) Limited (CHU): China Telecom. Watched a CNBC segment some time ago about using Chinese telecom stocks as way to invest in China growth. I held off then as the trade deal was still up in the air and Hong Kong protests remained active. Along comes the corona virus and knocks stocks back a bit more - time to buy at what might be a bottom. Now the chart does not show that price has bottomed - it could still go lower.
I am invested in China Mobile (CHL is NYSE ADR) via its Hong Kong listing. It has bottomed as the Hong Kong protests take a back seat to corona virus. The comparative chart shows China Mobile (CHL - orange line) has made a higher high off its lows.
What interests me is there is a 23 percentage points gap - close half of that is a 20% positive move. I will be watching to see if the bottom is confirmed.
Fluor Corp (FLR): US Engineering Services. SEC announces an investigation into accounting irregularities and stock price gets hammered 25%. I am always keen to trade these market reactions as they tend to be over reactions. I chose to sit this one out until I saw price move up 2 days in a row. This averages down a well under water position. I did write a new covered call on the new holding - I used a weekly option for March 13 expiry so I could get an intermediate 16 strike vs 17.50 on offer for March monthly expiry.
Royal Dutch Shell plc (RDSA.AS): Europe Oil. Averaged down entry price in one portfolio on December 2022 strike 30 call options. This is well out-the-money vs €23.39 closing price but December 2022 feels like a long time away. This trade is really a way to grab back some capital on any improvement in oil price.
Commerzbank AG (CBK.DE): German Bank. European banks stocks have been on the move since Mario Draghi retired as Governor of European Central Bank. Stock I am holding will be assigned on covered call expiry. Time to stay invested. Bought a new parcel of stock to start the new covered call writing journey. I will nibble at a small parcel and keep adding if prices slide.
Deutsche Bank AG (DBK.DE): German Bank. Stock will be assigned on covered call expiry. Bought a new parcel of stock to start the new covered call writing journey. I will nibble at a small parcel and keep adding if prices slide. The naked puts written when price was sliding last month have all expired in my favour and reduced my effective entry price by €0.44 (4.5% discount)
Sold
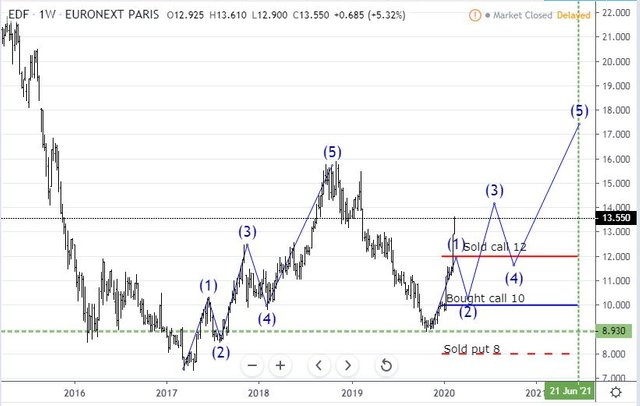
Electricite de France S.A. (EDF.PA): French Utility. With price opening at €12.86 closed out June 2021 10/12 bull call spread for a 97% profit on the spread since December 2019. I chose not to close out the strike 8 sold put option component of the call spread risk reversal. Had I done that overall profit would be 155% - I am looking for more and happy to run the risk of buying the stock at €8.
The updated chart shows that price has moved a lot harder than the Elliot Wave price scenario I modelled last in TIB498. This looks like a move worth watching - maybe the way to invest will be to buy stock and write covered calls with wider coverage in the same way as I am doing on ENGIE (ENGI.PA), the competing French utility.
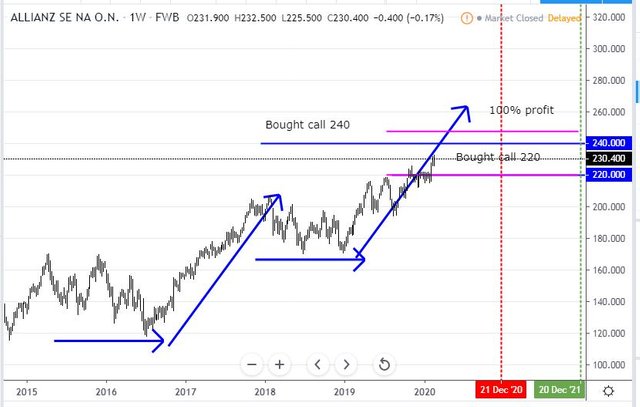
Allianz SE (ALV.DE): German Insurance. With price closing at €232, closed out December 2020 strike 220 call option for 48% profit since June 2019. The updated price chart shows price following the price scenario quite closely. There is even a chance that the December 2021 strike 240 call options could become profitable
Mastercard Inc (MA): US Payments. 33% profit since May 2019. Jim Cramer idea to reduce holding - my holding was small - closed it fully.
Yamana Gold Inc. (AUY): Gold Mining. With price closing at $4.42 closed out a January 2021 2.5/4 bull call spread for a blended profit of 202%. Initial trades were averaged down from open in October 2018 and then in February and June 2019. Profit on the last average down trade was 395% = the power of averaging down. I remain exposed to the stock in this portfolio. In another portfolio profit was 130% since February 2019 (i.e., did not do last averaging). In this portfolio, I am still holding the stock and a January 2021 4.5/5.5 bull call spread which has just gone in-the-money.
I was encouraged in watching CNBC Fast Money show on Friday where they were talking about gold and silver mining. They are getting into the trade when I am taking first round profits.
Tesla, Inc. (TSLA): Electric Vehicles. With price closing at $917.42 closed out January 2021 770/850 bull call spread for a 36% profit in 8 days. I must say when I set this trade up I was not expecting price to pop more than 10% in a week. Profit achieved is a lot lower than maximum because of a massive spike in implied volatility and a fair amount of time value left in the trade. I do retain the July 2020 sold 560 put. Were I to close that on trade day at last trade price (from the day before), profit would be 57%. I expect that put option price to drop further. Overall price would have to drop 63% for that trade to go to exercise.
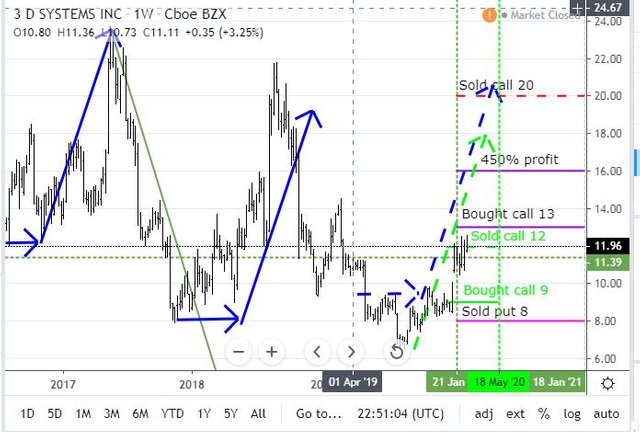
3D Systems Corporation (DDD): 3D Printing. With price closing at $12.26 closed out May 2020 9/12 bull call spread for 189% profit since December 2019. I remain exposed to the stock in this portfolio, though the strike 10 covered call written will be assigned and remove half the holding.
The updated chart shows price tracking as steeply as any of the price scenarios modelled with a delayed start. Trade just closed is the fluoro green trade. This looks like price wants to drive higher and may well bring the other trades I have open into profit.
Chicago Wheat Futures (WEAT): Wheat. 2 trades closed on trailed stop loss for average per contract profit of $11.30 (2.05%)
Corn Futures (CORN): Corn. One trade closed on trailed stop loss for average per contract profit of $1.50 (0.39%)
Soyabeans Futures (SOYB): Soybeans. One trade closed actively for average per contract profit of $3.40 (0.38%)
Shorts
A reminder on hedging strategy - looking to cover a price drop between 5 and 10% by buying a bear put spread with the bought leg at 5% lower and sold leg at 10% lower. I review the trades to explore converting to a ratio spread by selling another put at or below the first sold leg to cover the net premium.
Vanguard FTSE Europe Index Fund ETF (VGK): Europe Index. Bought a June 2020 55/52 bear put spread for $0.35 net premium as a hedging trade. This offers maximum profit potential of 757% for a 12.6% drop in price from Thursday close of $58.24. In my other portfolios I bought March 2020 56/54 bear put spreads for $0.19 net premium. This offers 952% profit potential for a 7.5% drop in price from Friday close of $58.05. I will look to convert these to a ratio spread if prices begin to slide. For the March expiries, I will explore selling a June put further out-the-money.
Invesco QQQ Trust (QQQ): Nasdaq Index. Bought a March 2020 218/209 bear put spread for $0.97 net premium as a hedging trade. This offers maximum profit potential of 828% for a 10.2% drop in price from Friday close of $230.27. I will look to convert these to a ratio spread if prices begin to slide.
SPDR S&P 500 ETF Trust (SPY): S&P 500 Index. Bought a March 2020 315/300 bear put spread for $1.00 net premium as a hedging trade. This offers maximum profit potential of 1400% for a 11.2% drop in price from Friday close of $333.48. I will look to convert these to a ratio spread if prices begin to slide.
Income Trades
Covered Calls
5 covered calls written for March expiry at average premium of 1.51% and coverage ratio of 12.7%.
Bought back L Brands (LB) and Cameco Corp (CCJ) as price was trading close to sold strikes. Cameco trade remained positive even after buy back (0.42% net). LB details presented below.
Naked Puts
Apple Inc (AAPL): US technology. Sold naked put at strike 270 for March to replace one expiring in February. I had hoped implied volatility on corona virus news would rise but it did not.
FireEye, Inc. (FEYE): Cybersecurity. Sold February 28 strike 15 put option to reduce entry cost on potential exercise on strike 16 - closing price on trade day of $15.61
L Brands, Inc. (LB): US Retail. Sold a March strike 20 put option against a $24.60 closing price - premium was 2.3%. My sense is the restructuring following departure of founder Wexner will underpin the price. Looks like I was not the only person to notice the high implied volatility.
https://finance.yahoo.com/news/implied-volatility-surging-l-brands-143702461.html
Also bought back 23.5 strike call options - net premium between the sold call, sold put and bought back call remains a positive trade. Price closed at $24.07 and I bought back at effective $23.77 = a good buy back on day one.
Valaris plc (VAL): Offshore Oil Drilling. Sold a March strike 4 put option against a $5.30 closing price - premium was 2.3%. Disappointing to see price collapse to $4.20 but still out-the-money
The Walt Disney Company (DIS): US Media. Sold a March strike 130 put option to replace one expiring in February.
Yamana Gold Inc. (AUY): Gold Mining. With price trading above $4 since February 13 closing at $4.43, structured a different income trade - sold a 5 strike call option and sold a 4 strike put option (called a short strangle). Basically this doubles the premium and what I want is price to stay between $4 and $5 to stay in the stock. Price can move 10% in either direction and still stay out-the-money.
ViacomCBS Inc (VIAC): US Media. ViacomCBS announced first results since the merger was completed - they disappointed markets which delivered a 17% price drop. Jim Cramer view was a shortage of vision spooked markets but he was not prepared to buy into the weakness. My question was at what price would I be prepared to buy and sell a put at that price? Sold a March 2020 27.5 strike put option for 2.1% premium which gives me an effective entry price of $26.93 = a further discount of 8% to Thursday's close of $29.29. Price did drop further 3.5% in Friday trade but not as far as the sold strike.
Cryptocurency
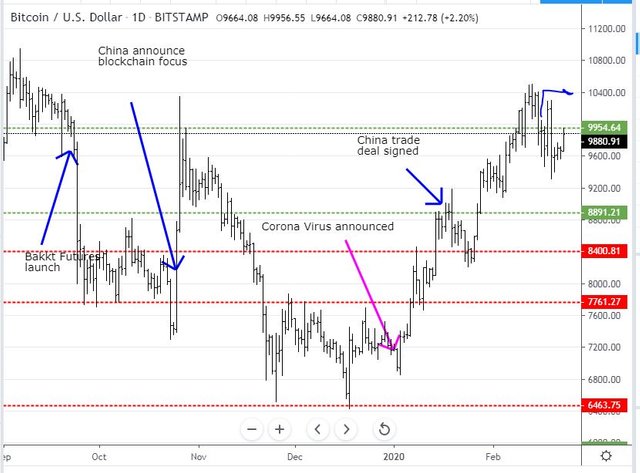
Bitcoin (BTCUSD): Price range for the week was $988 (9.96% of the open). Price rejected resistance at $9954 and pushed lower before having another go and failing again. Price does look as if it will confirm a higher low if it can break above $9954 for the 3rd time. Of note is the engulfing bar in the middle of the week - pushed higher and closed lower. This could be a telling move which goes against confirming the higher low
3 trades closed on trailed stop loss for average per contract profit of $136.39 (1.38%)
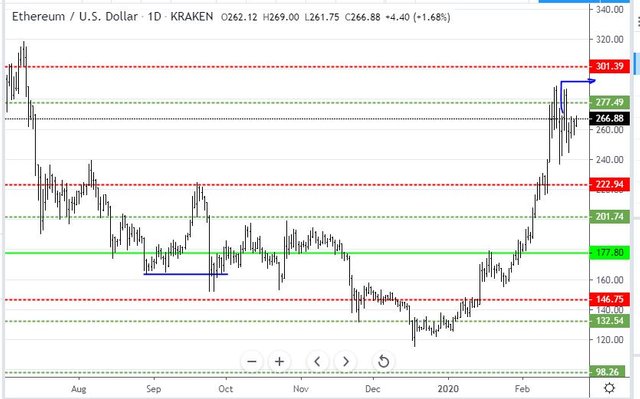
Ethereum (ETHUSD): Price range for the week was $45 (17% of the open). Price tried again to push up through and hold resistance at $277 and nearly matched the last highs before falling back. No engulfing bar in this series but the higher low is confirmed by highs close to each other.
2 trades closed on trailed stop loss for average per contract profit of $8.19 (3.22%)
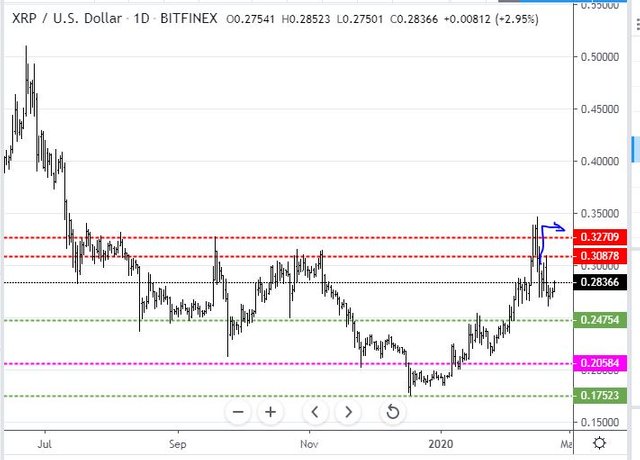
Ripple (XRPUSD): Price range for the week was $0.04836 (16.5% of the open). Price drifted lower before having a go at clearing $0.30 just touching resistance at $0.30878. The sellers were there and pushed back almost all the way back to $0.26 - I have a pending limit order sitting there waiting.
2 trades closed on profit targets set on $0.29 round number for average per contract profit of $0.0078 (2.77%). I am going to increase contract size by 50%.
CryptoBots
Profit Trailer Bot No closed trades - bot not switched back after bandwidth overage.
New Trading Bot Trading out using Crypto Prophecy. No closed trades
Currency Trades
Outsourced MAM account Actions to Wealth closed out 5 trades on AUDNZD for 0.45% losses for the week - all losing trades. No trades open.
Cautions: This is not financial advice. You need to consider your own financial position and take your own advice before you follow any of my ideas
Images: I own the rights to use and edit the Buy Sell image. News headlines come from Google Search. All other images are created using my various trading and charting platforms. They are all my own work
Covid-19 badge from is free to use https://www.cdc.gov/coronavirus/2019-ncov/communication/buttons-badges.html
Tickers: I monitor my portfolios using Yahoo Finance. The ticker symbols used are Yahoo Finance tickers
Charts: http://mymark.mx/TradingView - this is a free charting package. I have a Pro subscription to get access to real time forex prices
Bitcoin: Get started with mining Bitcoin for as little as $25 http://mymark.mx/Galaxy
February 17-23, 2020
