LiteCoin (LTC) Longer Term Fractals

SUMMARY
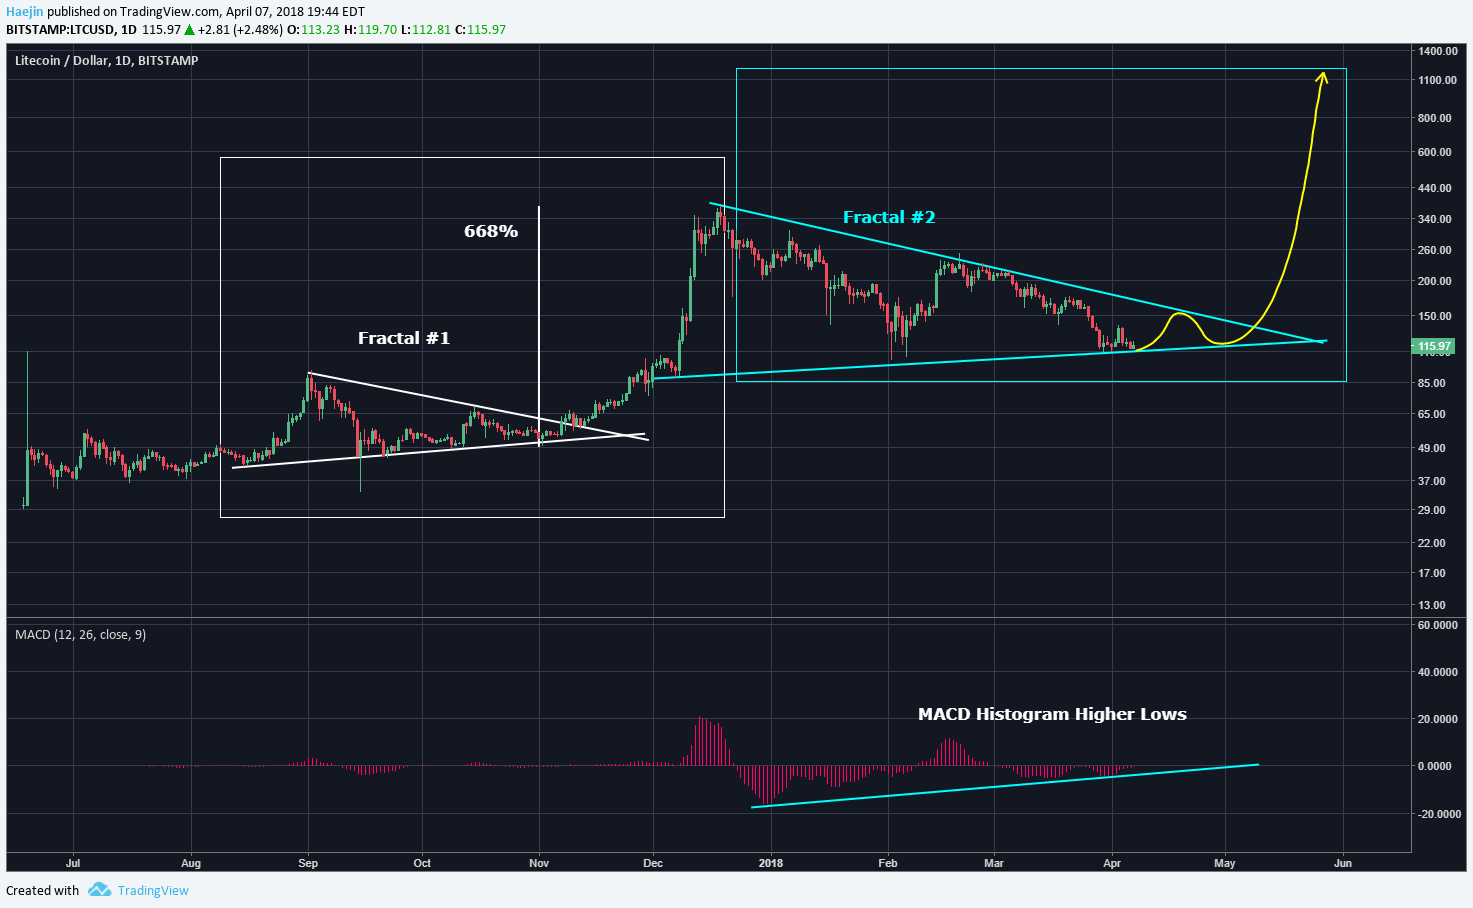
Here is the daily log chart of Litecoin (LTC/USD) in which once can identify two potential fractals (white & blue). The symmetrical triangl of Fractal #1 is less than 1/2 the size of Fractal #2. Remember, fractals are similar in pattern but not exact in features or time.
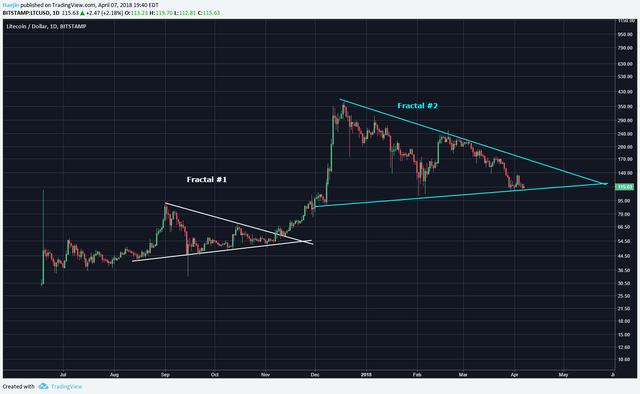
Using these two fractals, it's clear that Fractal #1 generated a 668% rise which was very impressive. The correction is seen as the Fractal #2's price movements. The white arrow also projects a potential price pathway for the Fractal #2 when it breaksout. The MACD historgram (9 day moving average) is shown without the longer 12 nad 26 day lines. The higher lows is very indicative of seller exhaustion and fits well into the Fractals #2's price moving within a contracting pair of lines. What would be more probable...a breakout or a collapse? Such must be a self answered question as my analysis is only provided to help augment your due diligence.
Legal Disclaimer: I am not a financial advisor nor is any content in this article presented as financial advice. The information provided in this blog post and any other posts that I make and any accompanying material is for informational purposes only. It should not be considered financial or investment advice of any kind. One should consult with a financial or investment professional to determine what may be best for your individual needs. Plain English: This is only my opinion, make of it what you wish. What does this mean? It means it's not advice nor recommendation to either buy or sell anything! It's only meant for use as informative or entertainment purposes.
Please consider reviewing these Tutorials on:
Elliott Wave Counting Tutorial #1
Elliott Wave Counting Tutorial #2
Elliott Wave Counting Tutorial #3
Laddering and Buy/Sell Setups.
Laddering Example with EOS
Tutorial on the use of Fibonacci & Elliott Waves
@haejin's Trading Nuggets
Essay: Is Technical Analysis a Quantum Event?
Follow me on Twitter for Real Time Alerts!!
Follow me on StockTwits for UpDates!!
--
--


Showing Hidden Bearish Divergence on the 1H chart
Short term I want LTC to drop back down to $50
End of the year $25,000 LTC
Litecoin a solid buy at $80.
Also represents a .786 retrace of the previous consolidation zone which jives with EW theory as this being completion of corrective wave leading into new accumulation.
Check out @TruthTrader. It tracks Haejin's performance. I give #Hgin a BIG FUCKING F For FUCKING FAILURE!!!!
So the previous analysis is invalidated now?
https://steemit.com/litecoin/@haejin/litecoin-ltc-this-was-just-an-abc-bounce
The probability of $89 to $77 is now zero?
All his post are bullshit. Visit @TruthTrader
@haejin thanks for sharing your information
Check out @TruthTrader. It tracks Haejin's performance.
I give #Hgin a BIG FUCKING F For FUCKING FAILURE!!!!
LitePay realese, LiteCoin price crossed $500 at 18 aprit, this is possiblety news?
thanks for information
Hola @Haejin, gracias por compartir tu analisis, saludos.
https://steemit.com/bitcoin/@jakob2450/the-central-banks-are-obsolete-the-hammer-is-about-to-fall
Good post. Stay with me.I Voted and followed