Marketing Strategy Part 4: Numbers that Guide You to Profit
In this last post in this Marketing Strategy series covering those aspects of business revenue growth that are too little discussed online, I want to talk to you about numbers.
Too many people are afraid of the numbers, but the numbers are our friends. The numbers are how financial success in our businesses can come down to simply doing more of what works and less of what’s having little effect.
The numbers make business success as reliable as finding that hidden object when you were a kid playing the hot/cold game. As long as you had someone calling out when you were getting warmer or colder, you were assured you would eventually find it if you just kept playing long enough and weren’t called in for dinner. In the same way, we can use numbers to always know when we’re getting warmer or colder in how we implement our business strategy.
I hope I’ve convinced you to be willing to even think about this. If I have, let’s now dig into how we work with the numbers effectively.

(Source: Pixalbay)
The Basics of How This Works
In a nutshell, we have marketing and sales strategy, which are clarified goals and hypotheses for how we believe we will increase revenue in the business. Then we have tactics, which are the methods we think will achieve the goals of those strategies. Then we need to have a way of testing those hypotheses and seeing if the tactics really do help us achieve our strategic goals.
This has got to get translated into numbers at this point, so that it is clear that the numbers are either headed in the right direction or the wrong direction. This can’t be subjective. Three is always more than 2. One is always less than 2. That’s the kind of clarity we need.
We also have to make sure that the numbers we’re tracking actually test our hypotheses. For example, let’s say you have a content marketing strategy with a goal of using it to increase sales of a digital product, and one of the tactics you’re using is blogging. Okay, we just need to know what the key indicators are for good performance or bad performance with our blogging leading to product sales. What is one number (one metric) you might look for that would tell you this?
The mistake so many people make is that even when they get as far as realizing they need to be tracking important numbers related to their business performance, they track the wrong numbers. They go for what is convenient data to collect, instead of using only what is meaningful data.
In this example, a lot of people would use the number of website visitors. It’s easy to see in an app like Google Analytics or Clicky that the number of site visitors is either going up or down. So you might look to see the number of site visitors going up each month and consider that to be an indicator that your content marketing is working.
But what if what’s really happening is that there are certain types of articles that attract visitors likely to buy and other types of articles that attract visitors who never buy anything?
And what if it is easier to get traffic for those undesirable article types, whether because there is little competition, or simply more people who fall into that bucket?
If you just aim to increase site traffic, you’re going to produce more of those articles that are bringing in the most traffic from search engines. And site traffic will likely go up if you do that.
Then, looking at only whether site traffic is going up or down and seeing that you are producing articles that cause site traffic to keep going up, you may wind up puzzled when you also see that sales are flat, or even decreasing.
You see, if your objective is to increase sales, you need to be writing more of the types of articles that lead to sales, not just articles that attract more traffic in general. But how do you know which articles lead to more sales?
Thinking about your own business right now, if you have a blog, do you know which articles are contributing the most to sales?
Let’s say you don’t sell from your website at all, so you just want to get people on your email list. Do you know which articles contribute the most to email signups?
Those are the meaningful indicators of whether what you’re doing is working, or whether you need to make an adjustment if you want to see more revenue with less work.
Using KPIs & Analytics Tools to Answer Important Questions
There’s a term for what I’ve been talking about all this time. It’s called a Key Performance Indicator, a KPI, and you need some for your business. The numbers we want to track must be KPIs, not just random numbers. And then we need to look at those target numbers (typically a target range) and know what to do based on what we see.
That’s where tools come in. And thankfully there are lots of tools, free and low cost, that help you do exactly this. In fact, there are so many that it really comes down to exactly what your business model is in terms of sorting out what you should be using. But everyone who has a website should be learning SOMETHING meaningful from the performance of that website. And Google Analytics is a reliable free tool for getting started with that. So let’s go a little further with our current example of content marketing meant to increase sales on a site that sells digital products and consider what we can learn with GA.
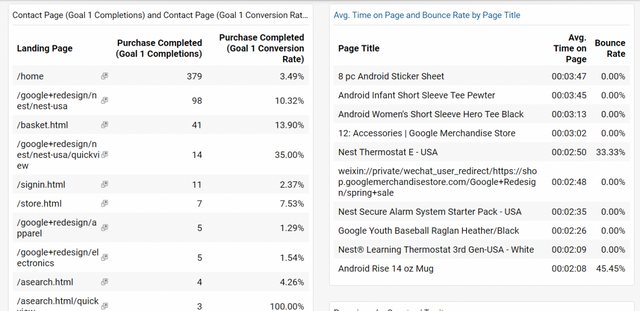
Here is a GA screenshot showing you the answer to the question, “Which pages on this site are attracting visitors most likely to buy something?”
In my sample data the site doesn’t actually have a blog, so we’re seeing regular site pages, but it works the same whether it is a blog post people are coming in through or a site page. Just pretend the pages you see are the names of blog articles.
Take a look at the pic now and see if you can answer the question yourself before I tell you in the next paragraph….
(Source: screenshot)
Can you see that the site entry page that attracts the most buyers is the home page in this example? It has led to 379 completed purchases in the last week, whereas the next highest money making entry page has brought in only 98 sales.
However, the page that gets the highest percentage of viewers to buy is the “google+redesign” page, which has 35% of the people who see the page buy something. Might be worth driving more traffic to that page!
(There’s also one page at 100%, but that’s because it is a post-sale page.)
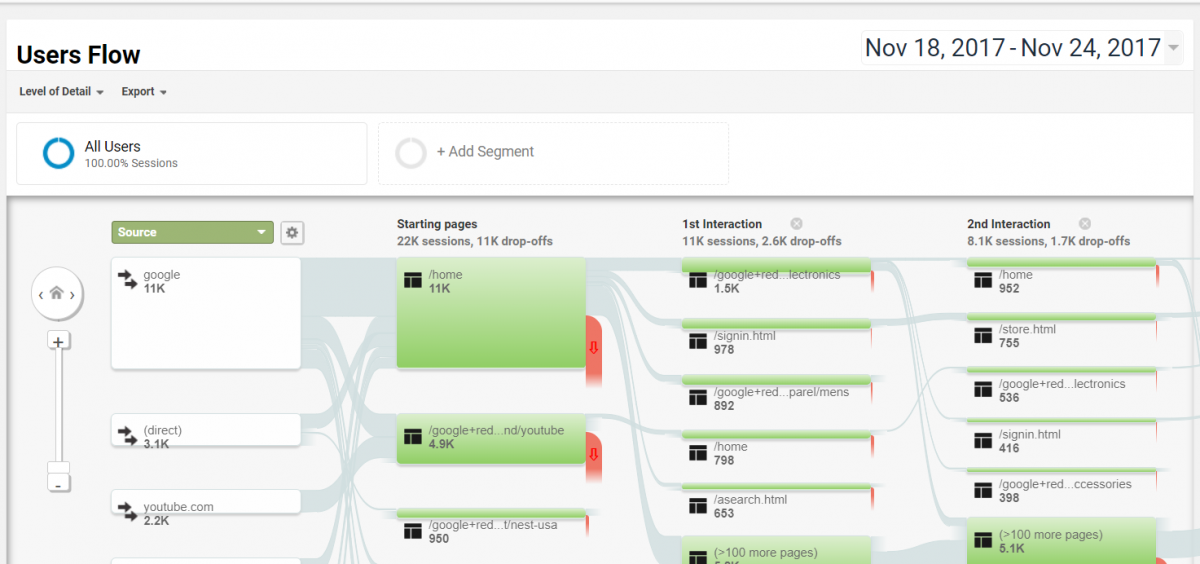
Below is another image revealing how visitors navigate through the site. It answers the question, “How well have I done at leading visitors who come in through any page to those pages that convert best?” (Can you see how that might be an important question to be able to answer?)
(Source: screenshot)
This one is hard to interpret in static form, so I’ll simply give you the answer without drilling down into how you see this shown in this screenshot. The answer is, “Not very well.”
There is a lot of traffic coming in from Google search and going to the homepage. That’s probably why the homepage is contributing so much to sales right now. Because from that homepage people aren’t navigating to any of the pages with the highest conversion rates that we saw in the other screenshot. Not on there first click from the homepage, not even on their second or third. They are falling off before they ever get to the places we most want them to go.
Now I’m going to make another hypothesis here that needs to be tested. That’s how using KPIs works. You see something not quite right (you’re getting colder), so you make an adjustment. You then have to track the results of that adjustment to see if it really does fix the problem.
In this case, the hypothesis I need to test is the idea that sending more people to a page that has a 35% conversion rate will still maintain about a 35% conversion rate for that page. We need to make changes to those first few pages folks are going to now to drive people to this target page, then see what the conversion rate for the page actually is a month later.
I suspect it will wind up still being a top converting page, but probably not as far ahead of the pack as it is now. Right now it is 3 times as effective as the next most effective page. It might settle at more like twice as effective as any other. Still worth doing, but we need to see all of this in the numbers, not just guess and move forward as if we know.
Even if the 35% conversion rate doesn’t quite hold, all we did was make some changes to those frequently visited pages to make this target page more prominent. That’s not much work, but the revenue increase likely to result from it is massive. Worth knowing you need to do that?
In Summary
The numbers aren’t scary when you realize that when it comes to carrying out any marketing/sales strategy and related tactics:
You are making assumptions based on hypotheses in your head, whether you articulate those assumptions or not.
You need to test those assumptions to see if they are true (find out if you’re really getting warmer or colder).The answers you get may lead you to revise your assumptions (if you’re getting colder when you expected to get warmer, change something).
You need to then test those revised assumptions as well (we’re still playing until we actually find the hidden object or get called in for dinner… which in a business is running out of money… oops).
All of this is pretty logical once you think about the right questions to ask and use the right tools to help you answer them. It’s not the least bit scary or even particularly mysterious.
You want to figure out what you need to do in order to achieve your key goals, and you want to know it pretty early on in the marketing and sales process. You don’t want to wait to see that there is either money in the bank or not. That’s too late.
Well I hope this series has been helpful to you. I’ve enjoyed organizing this aspect of my work into this generalized form. Normally I don’t think in generalities like this at all, because I was trained as a business consultant at the type of consulting firm where I was never expected to contribute anything about business that didn’t relate to a specific client’s specific situation. If you’ve been on my email list, you’ll know I almost never send emails. But I do think this generalized advice is both useful and bite-sized enough to be digestible. At the very least it should get you asking yourself the right questions, and at best it will be enough for you to start getting those all important answers to help your business increase revenue.
Let me know if you have questions, but please don’t ask me what tools to use. That’s just coming at it from the wrong level. That’s not the thing to be thinking about first; it’s what you think about last. Tools are the form of transportation you choose to take you to your destination, but whether it should be a plane, train, car, bike or boat depends on where you’re going, your transportation budget, and how soon you need to get there.
I share this caveat because I know that for many of you that’s the first question that’s coming to your mind, which takes us back to how I started the first post in this series. There is a tendency to want to have tactical conversations, particularly focusing on tools. But the best tool just creates an illusion of progress when it isn’t paired with an effective methodology for using the tool to achieve actual business objectives.
Have I convinced you?